Triangle Pattern, Falling Wedge Pattern, Rising Wedge Pattern and Channel

Introduction to Triangle Pattern, Falling Wedge Pattern, Rising Wedge Pattern and Channel
In this article, we will explain triangle pattern, falling wedge pattern, rising wedge pattern and channel for forex trading. Before we going into these price patterns, let us consider the support and resistance. The easiest techncial analysis you can perform with the peak trough analysis or the peak trough indicator is to draw the support and resistance. You can draw the support or resistance by connecting more than two points as outlined in the previous post (the points means peak or trough here). This is the most introductory technical analysis. However, it is recommended to understand this simple method if you are trading in forex and stock market as this method will provide the basis for more advanced technical analysis later.
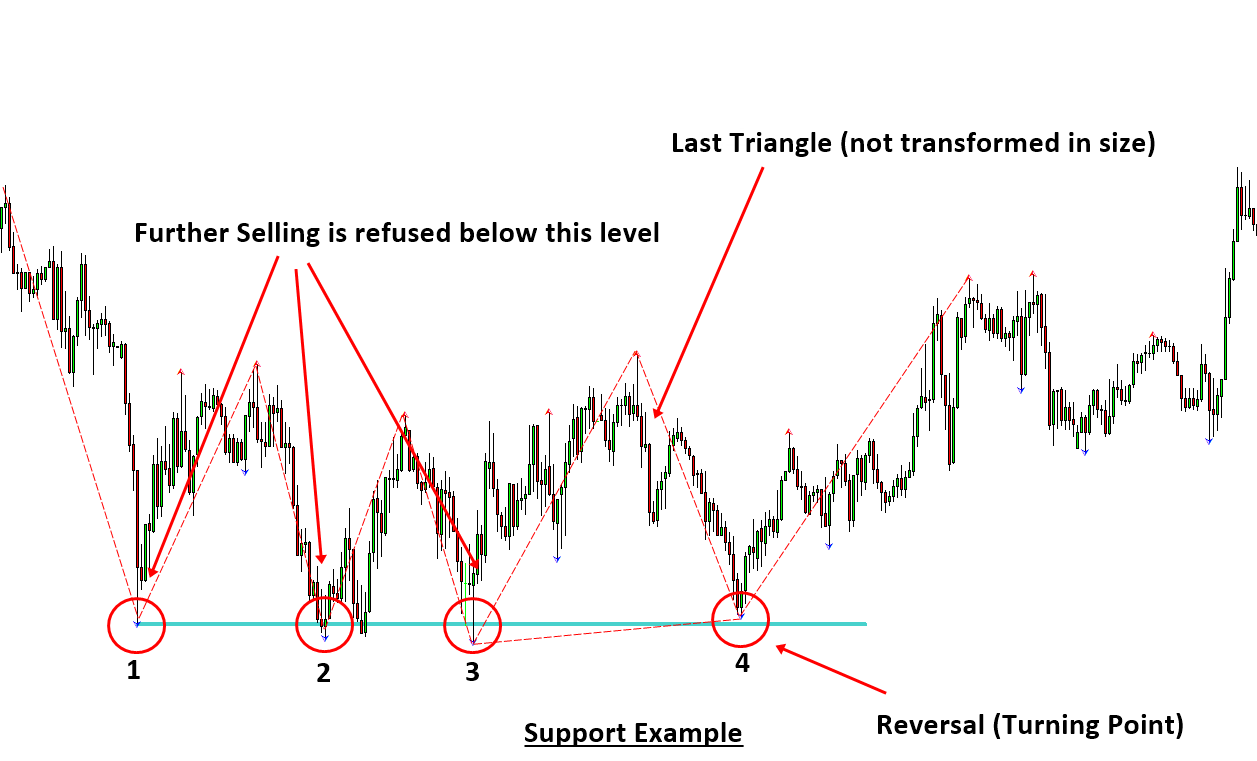
Once you understand how the support and resistance is drawn in your chart, understanding the triangle pattern, rising wedge pattern, falling wedge pattern and channel is easy. You can detect triangle pattern, falling wedge pattern, rising wedge patterns by combining one support and one resistance. Basically, the triangle pattern, rising wedge pattern, falling wedge pattern and channel are the extension of the support and resistance. Sometimes, you have to use the diagonal support and resistance to detect these price patterns.

If you want to detect the triangle pattern, rising wedge pattern, falling wedge pattern and channel pattern, then there are several options for forex trader. Firstly you can use the peak trough analysis indicator to do manual detection of these price patterns. Secondly, you can use the repainting automatic pattern scanner to detect these price patterns. Thirdly, you can use the non repainting automatic pattern scanner to detect these price patterns.
Manual Pattern Detection with Peak Trough Analysis (Free)
Peak trough analysis can be done in both qualitative and quantitative way. For the qualitative peak trough analysis, you can have a look at the Stock Market and Magnet experiment (Check the attached pdf file in this article). You can google it of course if you wish. For the peak trough anlaysis indicator, we are referring to the quantitative way or automatic ways to detect the peak trough analysis. This tool will detect the peaks and troughs in your chart automatically. With these detected peaks and troughs, you can detect the support and resistance. You can also detect the triangle pattern, rising wedge pattern, falling wedge pattern and channel pattern. We recommend using the peak trough anlaysis to avoid any subjective price pattern detection. For example, if you try to detect these price patterns with raw price series, there are high chance that you can introduce the subjective price patterns for your trading. In forex trading, you should try to reduce or to cut any chance to use the subjective pattern. Many traders have seen the similar criticism in Elliott Wave counting. Hence, this is already the known fact. The good news is that we provide the peak trough anslysis for free to every one. You can find the free indicators from the link below. Hence, you do not have to detect these price patterns with bear hands.
Peak Trough Analsyis for MetaTrader 4
Peak Trough Analysis for MetaTrader 5
Chart Pattern Scanner (Repainting)
Price breakout pattern scanner is the repainting chart pattern scanner. Price breakout pattern scanner can detect following patterns automatically. In addition, price breakout pattern scanner provide the renko chart to improve your market prediction with these price patterns.
- Head and Shoulder - Common tradable pattern.
- Reverse Head and Shoulder - This pattern is the reverse formation of the Head and Shoulder.
- Double Top - When the price hits resistance level twice and decline toward the support level, the trader can anticipate sudden bearish breakout through the support level.
- Double Bottom - The double bottom pattern is the reverse shape of the Double Top.
- Triple Top - When the price hits resistance level three times and decline toward the support level, the trader can anticipate sudden bearish breakout through the support level.
- Triple Bottom - The triple top pattern is the reverse pattern of the triple top.
- Triangle - Several different types of triangle pattern include symmetric Triangle, Ascending Triangle and Descending Triangle.
- Rising wedge - This pattern is similar to triangle. However, their angle is stiffer than standard triangle.
- Falling wedge -This pattern has similar look to triangle too. However, their angle is stiffer than standard triangle.
- 52 Candlestick patterns – the Price Breakout Pattern Scanner can detect 52 different bearish and bullish candlestick patterns include hanging man, shooting star, engulfing, doji, Harami, etc.
Price Breakout Pattern Scanner for MetaTrader 4
Price Breakout Pattern Scanner for MetaTrader 5
Chart Pattern Scanner (Non Repainting)
Chart Pattern MT is the non repainting chart pattern scanner. Chart Pattern MT can detect following patterns automatically. In addition, it provides the multiple timeframe pattern scanning. This means that you just need to attach one indicator to scan the price patterns across all timeframe. This feature is really handy for forex trader as you can work with only one chart per symbol.
- Triangle (Pattern Code = 0)
- Falling Wedge (Pattern Code = 1)
- Rising Wedge (Pattern Code = 2)
- Double Top (Pattern Code = 3)
- Double Bottom (Pattern Code = 4)
- Head and Shoulder (Pattern Code = 5)
- Reverse of Head and Shoulder (Pattern Code = 6)
- Cup and Handle or Cup with Handle (Pattern Code = 7)
- Reverse of Cup and Handle or Cup with Handle (Pattern Code = 8)
Chart Pattern Scanner for MetaTrader 4
Chart Pattern Scanner for MetaTrader 5
Other Chart Pattern Scanner for MetaTrader 4
Using Wedge, Triangle, Double Top, Double Bottom, Head and Shoulder and Cup with Handle patterns are well documented in many places on internet. You can also test the indicator in history before using them for your live trading. Further more, you can use Chart Pattern Scanner together with following tools for even higher precision and accuracy.
- Harmonic Pattern Plus
- Harmonic Pattern Scenario Planner
- Equilibrium Fractal Wave Analytics
- Mean Reversion Supply Demand
- Elliott Wave Trend
- Sideways Market Analyser
Other Chart Pattern Scanner for MetaTrader 5
Using Wedge, Triangle, Double Top, Double Bottom, Head and Shoulder and Cup with Handle patterns are well documented in many places on internet. You can also test the indicator in history before using them for your live trading. Further more, you can use Chart Pattern Scanner together with following tools for even higher precision and accuracy.
- Harmonic Pattern Plus
- Harmonic Pattern Scenario Planner
- Equilibrium Fractal Wave Analytics
- Mean Reversion Supply Demand
- Elliott Wave Trend
- Sideways Market Analyser
Trading Straetgy Guide
The following books will provide the good trading stratgy guide for support resistance as well as the triangle pattern, falling wedge pattern, rising wedge pattern and channel in detail.
1. Technical Analysis in Forex and Stock Market: Supply Demand Analysis and Support Resistance
2. Scientific Guide to Price Action and Pattern Trading
3. Profitable Chart Patterns in Forex and Stock Market
If you want to access the free forex trading education, then you can also visit our website here.
https://algotrading-investment.com/2019/07/23/trading-education/


")
![[iVISTscalp5]: TSI — Timing Strength Index](https://c.mql5.com/6/1015/splash-preview-772243.png "[iVISTscalp5]: TSI — Timing Strength Index")
