
Introduction to Elliott Wave Theory and Elliott Wave Pattern
This article is about to introduce Elliott Wave Indicator. Before we explain the practical Elliott Wave Indicator, let us cover some basics of Elliott Wave Theory. Ralph Nelson Elliott was one of very first person who believed that he could predict the stock market by studying the repeating price patterns in the price series. The Wave Principle from Elliott states that the wave patterns in different scales are repeating and superimposing on each other forming complex wave patterns. If harmonic pattern directly focuses on the short patterns made up from five points, the Wave Principle, developed by Ralph Nelson Elliott, describe how the financial market evolve to meet the equilibrium with the repeating wave patterns, equilibrium fractal waves. The advantage of Elliott Wave theory is that it is comprehensive as the theory provides multiple trading entries on different market conditions. With Elliott Wave theory, traders can perform both momentum trading and mean reversion trading. The disadvantage of Elliott Wave theory is that it is more complex comparing to other trading techniques. In addition, there are still some loose ends in detecting Elliott wave patterns. For this reason, many traders heavily criticize the lack of scientific methods of counting Elliott Waves.
Elliott Wave theory received good attention from many traders and investors for several decades. Elliott Wave theory is a useful technique to deal with the financial market with the dominating Equilibrium Fractal-Wave process. For the financial market with strong Equilibrium Wave process (2nd, 3rd and 4th columns in the Price Pattern Table), traders must use alternative methodology over Elliott Wave techniques because Elliott Wave Theory is not meant to deal with Wave process. Seasonality or other cyclic fluctuations can be dealt better with other techniques. For example, Seasonal Exponential Smoothing, Fourier Transform, Principal Component Analysis or Wavelet Transformation might do better job for such a case. Some literature review and empirical research can yield helpful insight on which market trader can trade better with Elliott Wave Theory. In our Book, we will introduce the fundamentals of the Wave Principle. At the same time, we will introduce the template and pattern approach towards more scientific wave counting for traders.
The Wave Principle states that the crowd or social behaviour follows a certain wave patterns repeating themselves. The Wave Principle identifies two wave patterns. They are impulse and corrective wave. Often, the term impulse wave is interchangeably used with the motive wave. Two terms are identical. Both motive and impulse wave progress during the main trend phase whereas the corrective wave progress during the corrective phase against the main trend. In general, the Impulse Wave has a five-wave structure, while the Corrective Wave have a three-wave structure (Figure 5-1). It is important to understand that these wave structures can override on smaller wave structure to form greater wave cycle (Figure 5-2). Elliott Wave theory is useful in identifying both trend market and correction market. As the Elliott Wave Theory already assumes that price progresses in the Fractal-Wave form, they do not suffer from lagging of price like the smoothing algorithm based technical indicators do.
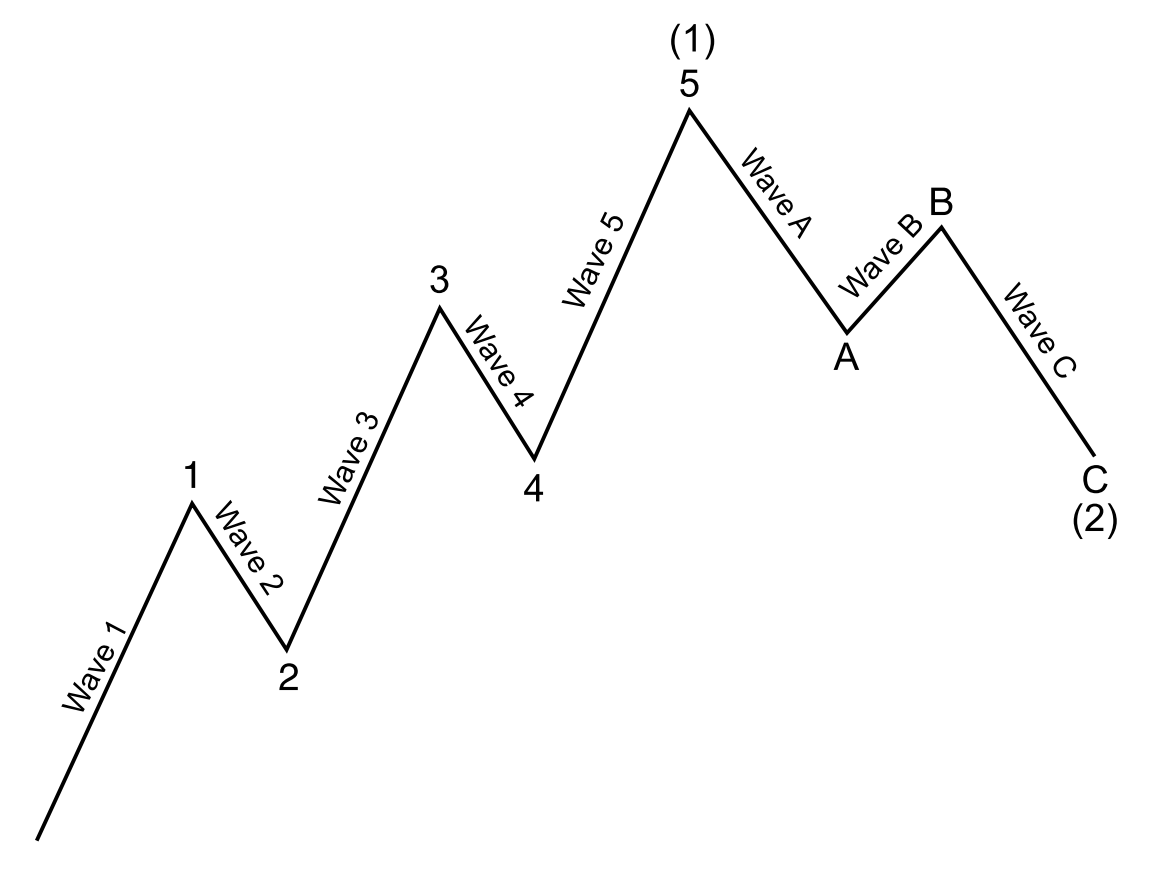
Figure 5-1: Illustrative example of five impulse wave and three corrective wave structure.
Elliott Wave and Fractal Wave
Fractal wave is a general teriminalogy that describes the self-similar structure over an extended, but finite, scale range in wave form. In short, fractal wave is more general term to describe the repeating wave pattern like Elliott Wave. Elliot wave is more specific application of fractal wave in the technical analysis domain. The repeating patterns in fractal wave is reflected directly in Elliott Wave as the impulse and corrective wave patterns are repeating over the bigger scale. In short, the several smaller impulse and corrective wave are combined to make bigger impulse and corrective wave. This repeats forever as it is projected in fractal wave. You might ask if it is important to study fractal wave before studying Elliott wave pattern ? In fact, the answer is that most people who understand the Elliott Wave theory already understand the fractal wave in details. Hence, if you are new then, you will become familar with fractal wave as well as Elliott Wave theory.
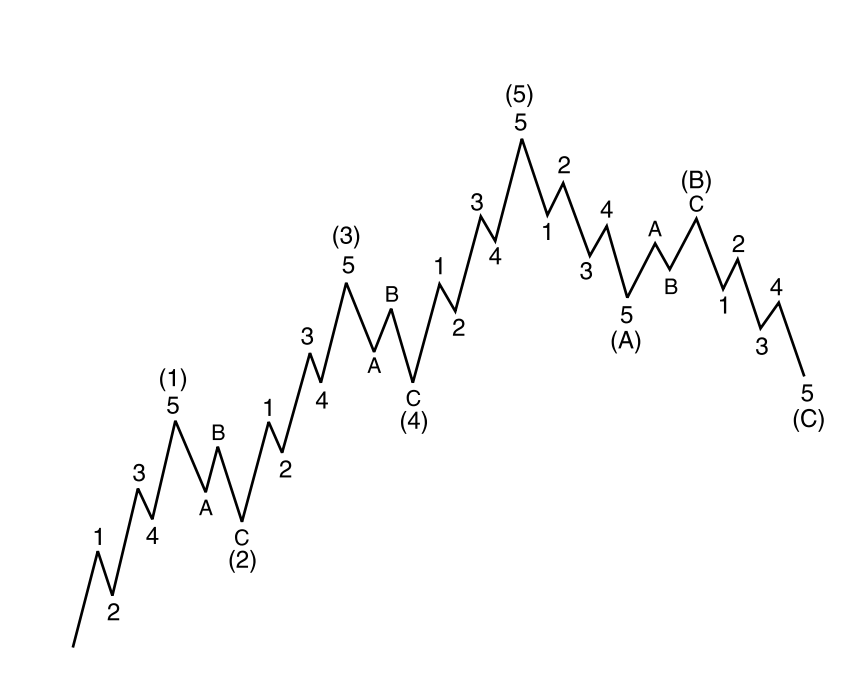
Figure 5-2: Lesser Impulse and corrective wave forming more complex wave patterns.
Elliott Wave Indicator Overview
The wave principle is rather general theory. As you will learn practical knowledge at work place after your school, we also need to develop practical knowledge after we have learnt the wave principle too. People who try to use the raw Wave principle may start with big disappointment because its complexity and frustrating results at the beginning. To apply the Wave principle in practice, we can have two alternative approaches. One is pattern approach and the other is wave-counting (or labelling) approach. In pattern approach, we can create Elliott Wave patterns with specific ratio sets based on the Wave principle. After we have figured out the sensible ratios for each pattern, we can test the pattern through data. We can also learn how to apply each pattern through the data too.
In wave –counting approach, you will start with the current chart and try to label minor and major cycles in your chart according to the wave principle. The outcome is to try to label each peak and trough as accurately as possible according to the Wave principle. Wave counting always involves the nested wave counting, which is open for the subjectivity of the practitioner. Comparing to the pattern approach, wave-counting approach is hard to test its trading outcome in real world trading for two reasons. Firstly, getting the agreement on wave cycle in Forex and Stock market is hard among the wave-counting practitioners. Secondly, chart data is always unique when you try to fit several nested wave cycles in wave counting. Hence, we are not able to copy and paste our past wave counting for the current market data because they do not fit simply. If we have to create unique counting every time, there is high chance of subjectivity. In Pattern approach, once the specific ratio set is provided, whoever used the patterns, you will get the pattern signal at the same time as long as you use the same data with the other traders. Pattern approach is more close to the mechanical signal what every trader is looking for.
The Elliott Wave Indicator for MetaTrader is a tool designed to help traders identify and analyze Elliott Wave patterns on price charts within the MetaTrader trading platform. The Elliott Wave Indicator for MetaTrader typically provides the following features:
- Identification of Wave Counts: The indicator aims to automatically identify and label Elliott Wave patterns on price charts, including impulse waves and corrective waves.
- Wave Labels: It labels waves according to Elliott Wave theory, such as labeling impulse waves with numbers (1, 2, 3, 4, 5) and corrective waves with letters (A, B, C).
- Wave Extensions and Retracements: The indicator may also highlight potential wave extensions (such as wave 3 being longer than wave 1) and retracements (such as wave 2 retracing a portion of wave 1).
- Fibonacci Ratios: Elliott Wave theory often involves the use of Fibonacci ratios to identify potential reversal or extension levels within waves. The indicator may include Fibonacci retracement and extension levels that correspond to specific Elliott Wave patterns.
- Visualization: The Elliott Wave Indicator typically visualizes wave counts and patterns on price charts, making it easier for traders to identify and analyze potential trading opportunities based on Elliott Wave theory.
Trading Platform for Elliott Wave Indicator
There are two options to use Elliott Wave Indicator for MetaTrader. Firstly, you can use MetaTrader 4 platform. Secondly, you can use MetaTrader 5 platform. We will compare MetaTrader 4 and MetaTrader 5 to provide you about knowledge over the trading execution. MetaTrader 4 (MT4) and MetaTrader 5 (MT5) are both popular trading platforms developed by MetaQuotes Software Corp. While they share some similarities, there are also key differences between the two.
-
Programming Language:
- MT4: Uses MQL4 (MetaQuotes Language 4) for programming custom indicators, scripts, and Expert Advisors (EAs).
- MT5: Uses MQL5 (MetaQuotes Language 5), which is an evolution of MQL4, but with additional features and improvements.
-
Number of Markets:
- MT4: Primarily focused on forex trading but can also be used for trading other financial instruments like commodities and indices.
- MT5: Supports trading in a wider range of markets including forex, stocks, commodities, and futures.
-
Order Execution:
- MT4: Utilizes the Market Maker model where trades are executed through the broker's dealing desk. It supports Instant Execution and Request Execution modes.
- MT5: Implements the Market Execution model which allows for Straight Through Processing (STP) and Direct Market Access (DMA). It supports four types of order execution: Market, Instant, Request, and Exchange.
-
Depth of Market (DOM):
- MT4: Does not support Depth of Market.
- MT5: Includes a Depth of Market feature, which shows the real-time liquidity of the market.
-
Number of Timeframes:
- MT4: Supports 9 timeframes: M1, M5, M15, M30, H1, H4, D1, W1, MN.
- MT5: Supports 21 timeframes: M1, M2, M3, M4, M5, M6, M10, M12, M15, M20, M30, H1, H2, H3, H4, H6, H8, H12, D1, W1, MN.
-
Backtesting:
- MT4: Offers backtesting capabilities but is considered less advanced compared to MT5.
- MT5: Provides more advanced and accurate backtesting functionalities, including multi-threaded optimization and access to tick data.
-
Hedging:
- MT4: Allows hedging, where traders can open multiple positions in the same instrument, in the opposite direction.
- MT5: Supports both netting and hedging modes. In netting mode, only one position per symbol is allowed, while in hedging mode, multiple positions can be opened per symbol.
-
User Interface:
- MT4: Known for its simple and intuitive interface.
- MT5: Offers a more modern and customizable interface with additional features like a built-in economic calendar and news feed.
-
Compatibility:
- MT4: Many traders and brokers are still using MT4, so it has a large library of indicators, EAs, and other tools available.
- MT5: While gaining popularity, it may have a smaller library of available tools compared to MT4, although it is growing steadily.
In summary, MT5 offers several advancements over MT4, including support for a wider range of markets, more advanced programming capabilities, improved backtesting functionalities, and a more customizable interface. However, MT4 still remains widely used, especially among forex traders, due to its simplicity, large user base, and extensive library of available tools. Although MetaTrader 5 is considered as newer trading platfrom, MetaTrader 4 is still good choice as they are reliable option for your trading. Next we will introduce Elliott Wave Indicator available in both MetaTrader 4 and MetaTrader 5 platform
Elliott Wave Trend
Elliott Wave Trend was designed for the scientific wave counting. This tool focuses to get rid of the vagueness of the classic Elliott Wave Counting using the guideline from the template and pattern approach. In doing so, firstly Elliott Wave Trend offers the template for your wave counting. Secondly, it offers Wave Structural Score to assist to identify accurate wave formation. It offers both impulse wave Structural Score and corrective wave Structure Score. Structural Score is the rating to show how good your Elliott Wave pattern is. 100% means that it is good wave pattern. The score below 80% or negative values means that you might have some mistakes in your analysis. Elliott Wave Trend will correct some obvious mistake in your wave counting if the counting goes against the three Wave rules proposed by Ralph Elliott. With Wave structural score, you can turn your Elliott Wave counting into Elliott Wave Pattern. To use Elliott Wave Trend, it is better to have some basic knowledge of using Elliott Wave Theory. The good news is that Elliott Wave Trend is the exclusive Elliott Wave tool for Forex trading.
Elliott Wave Trend for MetaTrader 4
Elliott Wave Trend for MetaTrader 5
X3 Chart Pattern Scanner
X3 Chart Pattern Scanner is not entirely Elliott Wave tool as you can trade with Harmonic Pattern, X3 Chart Pattern and Elliott Wave pattern. The good thing is that the pattern detection process in X3 Chart Pattern Scanner is fully automatic. This is probably convenient feature for many day traders who want to manage their trading and risk efficiently. In addition, you can adjust and modify the detectable chart patterns from the input page of X3 Chart Pattern Scanner. Hence, it is really great tool if you wish to fine tune your Eliott Wave Pattern before trading. What is even better with X3 Chart Pattern Scanner? It is non repainting and non lagging pattern scanner. This means that it is easy to use. Plus the historical patterns in chart can be used to test your trading strategy directly without resourcing any complicated testing software.
X3 Chart Pattern Scanner for MetaTrader 4
X3 Chart Pattern Scanner for MetaTrader 5
Elliott Wave Indicator for MetaTrader 4
Whether you are using Elliott Wave Trend or X3 Chart Pattern Scanner, you can always add more tools to improve your Elliott Wave trading. Here are the list of tools you can use together with Elliott Wave indicator.
- Harmonic Pattern Plus
- Harmonic Pattern Scenario Planner
- Price Breakout Pattern Scanner
- Ace Supply Demand Zone Indicator
- Mean Reversion Supply Demand Zone Indicator
- Advanced Price Pattern Scanner
Elliott Wave Indicator for MetaTrader 5
Whether you are using Elliott Wave Trend or X3 Chart Pattern Scanner, you can always add more tools to improve your Elliott Wave trading. Here are the list of tools you can use together with Elliott Wave indicator.
- Harmonic Pattern Plus
- Harmonic Pattern Scenario Planner
- Price Breakout Pattern Scanner
- Ace Supply Demand Zone Indicator
- Mean Reversion Supply Demand Zone Indicator
- Advanced Price Pattern Scanner
Articles for Elliott Wave Theory and Elliott Wave Pattern
Defining Chart Pattern Structure for Elliott Wave, Harmonic Pattern and X3 Chart Pattern
Introduction to the Wave Principle
Scientific Wave Counting with the Template and Pattern Approach
Impulse Wave Structural Score and Corrective Wave Structural Score
Channelling Techniques with Elliott Wave
Books for Elliott Wave Trading
Scientific Guide To Price Action and Pattern Trading (Wisdom of Trend, Cycle, and Fractal Wave)


")
