Young Ho Seo / Verkäufer
Veröffentlichte Produkte

Elliott Wave Trend wurde für die wissenschaftliche Wellenzählung entwickelt. Dieses Tool konzentriert sich darauf, die Unschärfe der klassischen Elliott-Wellenzählung zu beseitigen, indem es die Richtlinien des Template- und Pattern-Ansatzes nutzt. Dabei bietet Elliott Wave Trend erstens die Vorlage für Ihre Wellenzählung. Zweitens bietet es den Wave Structural Score, um die genaue Wellenbildung zu identifizieren. Es bietet sowohl den Structural Score für Impulswellen als auch den Structure Scor

Mean-Reversion-Angebot-Nachfrage-Indikator Mean Reversion Supply Demand ist ein Indikator zur Erkennung der wichtigen Angebots-Nachfrage-Zone in Ihrem Chart. Das Konzept des Angebots-Nachfrage-Handels beruht auf dem quantitativen Ungleichgewicht zwischen Kauf- und Verkaufsvolumen auf dem Finanzmarkt. In der Regel dient die Angebots-Nachfrage-Zone dazu, den Wendepunkt vorherzusagen. Damit eine Angebots-Nachfrage-Zone als erfolgreicher Handel funktioniert, sieht das Wellenmuster so aus, dass der K

Einführung in den Double Harmonic Volatility Indicator Die Verwendung der Fibonacci-Analyse für den Finanzhandel reicht fast 85 Jahre zurück, seit der Geburt der Elliott-Wellen-Theorie von R. N. Elliott. Bis heute verwenden Händler die Fibonacci-Analyse, um die Muster in den Preisreihen zu erkennen. Wir konnten jedoch niemanden finden, der versucht hat, die Fibonacci-Analyse für die Volatilität zu verwenden. Der Harmonic Volatility Indicator war die erste technische Analyse, die die Fibonacci-An

Elliott Wave Trend wurde für die wissenschaftliche Wellenzählung entwickelt. Dieses Tool konzentriert sich darauf, die Unschärfe der klassischen Elliott-Wellenzählung zu beseitigen, indem es die Richtlinien des Template- und Pattern-Ansatzes nutzt. Dabei bietet Elliott Wave Trend erstens die Vorlage für Ihre Wellenzählung. Zweitens bietet es den Wave Structural Score, um die genaue Wellenbildung zu identifizieren. Es bietet sowohl den Structural Score für Impulswellen als auch den Structure Scor

Die Peak-Trough-Analyse ist ein großartiges Werkzeug zur Erkennung von Spitzen und Tälern in Ihrem Diagramm. Das Tool Peak Trough Analysis kann drei verschiedene Algorithmen zur Erkennung von Spitzen und Tälern verwenden. Zu den drei Algorithmen gehören der Signal-Fraktal-Indikator von Bill Williams, der modifizierte Fraktal-Indikator und der ZigZag-Indikator. Sie können dieses Peak- und Trough-Analyse-Tool verwenden, um das Preismuster zu erkennen, das sich aus dem Equilibrium Fractal-Wave-Proz
FREE

Einführung in den Fractal Pattern Scanner Fractal Indicator bezieht sich auf einen technischen Indikator, der die fraktale Geometrie des Finanzmarktes nutzt. Fractal Pattern Scanner ist ein fortschrittlicher Fraktalindikator, der nach umfangreichen Forschungs- und Entwicklungsarbeiten im Bereich der fraktalen Geometrie auf dem Finanzmarkt die neueste Handelstechnologie bietet. Das wichtigste Merkmal von Fractal Pattern Scanner ist die Fähigkeit, die Wahrscheinlichkeit des Wendepunkts sowie die

Einführung in den Fractal Pattern Scanner Fractal Indicator bezieht sich auf einen technischen Indikator, der die fraktale Geometrie des Finanzmarktes nutzt. Fractal Pattern Scanner ist ein fortschrittlicher Fraktalindikator, der nach umfangreichen Forschungs- und Entwicklungsarbeiten im Bereich der fraktalen Geometrie auf dem Finanzmarkt die neueste Handelstechnologie bietet. Das wichtigste Merkmal von Fractal Pattern Scanner ist die Fähigkeit, die Wahrscheinlichkeit des Wendepunkts sowie die T

Einführung Dieser Indikator erkennt Volumen-Spread-Muster für Kauf- und Verkaufsgelegenheiten. Die Muster umfassen Nachfrage- und Angebotsmuster, die Sie für den Handel verwenden können. Diese Muster sind jedoch am besten geeignet, um die Nachfragezone (=Kumulierungsbereich) und die Angebotszone (=Verteilungsbereich) zu erkennen. Das Nachfragemuster zeigt im Allgemeinen eine potenzielle Kaufgelegenheit an. Das Angebotsmuster deutet im Allgemeinen auf eine potenzielle Verkaufsgelegenheit hin. Es
FREE

Einführung in den Fibonacci-Volatilitätsindikator Der Volatilitätsindikator kann Ihnen helfen, einen statistischen Vorteil für Ihren Handel zu erkennen. Insbesondere, wenn Sie mit Price Action und Price Patterns handeln, empfehlen wir Ihnen, den Volatilitätsindikator zusammen mit Ihrer Strategie zu verwenden. Der Fibonacci Volatilitätsindikator kombiniert die Marktvolatilität mit der Fibonacci-Analyse, um Ihnen einen fortgeschrittenen Volatilitätsindikator zu bieten. Wichtigste Merkmale Fibonacc

Einführung
Auto Chart Alert ist ein praktisches Tool, um Alarme für Ihren Handel in Ihrem Chart zu setzen. Mit Auto Chart Alert können Sie die Alarmlinie mit einem Klick an die gewünschte Stelle in Ihrem Chart setzen. Auto Chart Alert ist ein großartiges Tool, wenn Sie auf wichtige Unterstützungs- und Widerstandsniveaus für Ihren Handel achten müssen. Sie können einen akustischen Alarm, eine E-Mail und eine Push-Benachrichtigung erhalten, wenn der Kurs die Alarmlinie an der von Ihnen gewünschte
FREE

Einführung in den Timebox-Indikator Der Time Box Indicator ist ein unverzichtbarer Indikator für jeden Trader. Er zeigt tägliche, wöchentliche und monatliche Boxen an, je nach Ihren Präferenzen. Sie können jedoch alle wichtigen Kursniveaus in Ihrem Chart automatisch erweitern. Sie können diese als wichtige Unterstützungs- und Widerstandsniveaus verwenden. Es ist ein sehr einfaches, aber effektives Werkzeug für Ihren Handel.
Grafik-Einstellung Weißes Diagramm verwenden Linienstil für den aktuell
FREE

Die Peak-Trough-Analyse ist ein großartiges Werkzeug zur Erkennung von Spitzen und Tälern in Ihrem Diagramm. Das Tool Peak Trough Analysis kann drei verschiedene Algorithmen zur Erkennung von Spitzen und Tälern verwenden. Zu den drei Algorithmen gehören der orginale Fraktal-Indikator von Bill Williams, der modifizierte Fraktal-Indikator und der ZigZag-Indikator. Sie können dieses Peak- und Trough-Analyse-Tool verwenden, um das Preismuster zu erkennen, das sich aus dem Equilibrium Fractal-Wave-Pr
FREE

Einführung Dieser Indikator erkennt Volumen-Spread-Muster für Kauf- und Verkaufsgelegenheiten. Die Muster umfassen Nachfrage- und Angebotsmuster, die Sie für den Handel verwenden können. Diese Muster sind jedoch am besten geeignet, um die Nachfragezone (=Kumulierungsbereich) und die Angebotszone (=Verteilungsbereich) zu erkennen. Das Nachfragemuster zeigt im Allgemeinen eine potenzielle Kaufgelegenheit an. Das Angebotsmuster deutet im Allgemeinen auf eine potenzielle Verkaufsgelegenheit hin. Es

Einführung in Fractal Moving Average Der Indikator Fractal Moving Average wurde als Teil des Fractal Pattern Scanners entwickelt. Innerhalb des Fractal Pattern Scanners wurde der Fractal Moving Average Indikator als eine Vielzahl von Chart-Objekten implementiert. Bei über Tausenden von Chart-Objekten haben wir festgestellt, dass dies nicht die beste und effizienteste Art war, den Indikator zu betreiben. Es war zu rechenintensiv für den Indikator. Daher haben wir uns entschlossen, die Indikatorve
FREE

Einführung in den X3 Chart Pattern Scanner X3 Cherart Pattern Scanner ist ein nicht nachzeichnender und nicht nachlaufender Indikator zur Erkennung von X3 Chartmustern, einschließlich Harmonic Pattern, Elliott Wave Pattern, X3 Pattern und Japanese Candlestick Pattern. Historische Muster stimmen mit Signalmustern überein. So können Sie leicht eine solide Handelsstrategie in Ihrem Chart entwickeln. Noch wichtiger ist, dass dieser großartige Musterscanner das optimale Muster seiner Art erkennen kan

Einführung Harmonische Muster eignen sich am besten zur Vorhersage potenzieller Wendepunkte. Traditionell wurden Harmonic Patterns manuell identifiziert, indem man Spitzen- und Tiefpunkte im Chart miteinander verband. Die manuelle Erkennung harmonischer Muster ist mühsam und nicht für jedermann geeignet. Bei der manuellen Erkennung von Mustern ist man oft subjektiven Einschätzungen ausgesetzt. Um diese Einschränkungen zu vermeiden, wurde Harmonic Pattern Plus entwickelt, um den Prozess der Erke

Einführung Dieser Indikator erkennt Volumen-Spread-Muster für Kauf- und Verkaufsgelegenheiten. Die Muster umfassen Nachfrage- und Angebotsmuster, die Sie für den Handel verwenden können. Diese Muster sind jedoch am besten geeignet, um die Nachfragezone (=Kumulierungsbereich) und die Angebotszone (=Verteilungsbereich) zu erkennen. Das Nachfragemuster zeigt im Allgemeinen eine potenzielle Kaufgelegenheit an. Das Angebotsmuster deutet im Allgemeinen auf eine potenzielle Verkaufsgelegenheit hin. Es
FREE

Einführung in das Auftragsrisikomanagement EA ORM EA wurde speziell für die schnelle und präzise Ausführung von Marktaufträgen entwickelt, die mit unseren unten aufgeführten Price Action- und ökonometrischen Handelsstrategien verwendet werden können. ORM EA ist vollautomatisch und ORM EA ist sehr einfach zu bedienen. ORM EA ist völlig kostenlos. Sie können diese robuste Auftragsausführungsfunktion dieses ORM EA auch für jede andere Ihrer eigenen Handelsstrategien verwenden.
Handelsstrategie-Lei
FREE

Einführung in den Timebox-Indikator Der Time Box Indicator ist ein unverzichtbarer Indikator für jeden Trader. Er zeigt tägliche, wöchentliche und monatliche Boxen an, je nach Ihren Präferenzen. Sie können jedoch alle wichtigen Kursniveaus in Ihrem Chart automatisch erweitern. Sie können diese als wichtige Unterstützungs- und Widerstandsniveaus verwenden. Es ist ein sehr einfaches, aber effektives Werkzeug für Ihren Handel.
Grafik-Einstellung Weißes Diagramm verwenden Linienstil für den aktuell
FREE

Einführung
Auto Chart Alert ist ein praktisches Tool, um Alarme für Ihren Handel in Ihrem Chart zu setzen. Mit Auto Chart Alert können Sie die Alarmlinie mit einem Klick an die gewünschte Stelle in Ihrem Chart setzen. Auto Chart Alert ist ein großartiges Tool, wenn Sie auf wichtige Unterstützungs- und Widerstandsniveaus für Ihren Handel achten müssen. Sie können einen akustischen Alarm, eine E-Mail und eine Push-Benachrichtigung erhalten, wenn der Kurs die Alarmlinie an der von Ihnen gewünschte
FREE

Wie verwendet man die Pair Trading Station? Die Pair Trading Station wird für den H1-Zeitrahmen empfohlen und Sie können sie für alle Währungspaare verwenden. Um Kauf- und Verkaufssignale zu generieren, befolgen Sie die folgenden Schritte, um die Pair Trading Station auf Ihrem MetaTrader-Terminal anzuwenden. Wenn Sie die Pair Trading Station auf Ihren Chart laden, wird die Pair Trading Station die verfügbaren historischen Daten auf Ihrer MetaTrader-Plattform für jedes Währungspaar auswerten. Auf

Einführung in den Harmonic Pattern Scenario Planner
Der gegenwärtige Zustand des Devisenmarktes kann viele verschiedene mögliche Preispfade durchlaufen, um sein zukünftiges Ziel zu erreichen. Die Zukunft ist dynamisch. Daher ist die Planung Ihres Handels mit möglichen Zukunftsszenarien ein wichtiger Schritt für Ihren Erfolg. Um einem solch mächtigen Konzept gerecht zu werden, stellen wir Ihnen den Harmonic Pattern Scenario Planner vor, das erste prädiktive Harmonic Pattern Tool der Welt unter s

Einführung in den GARCH-Indikator GARCH ist die Abkürzung für Generalized Autoregressive Conditional Heteroskedasticity (verallgemeinerte autoregressive bedingte Heteroskedastizität) und ist ein in der Finanzbranche häufig verwendetes Volatilitätsvorhersagemodell. Das GARCH-Modell wurde erstmals von dem dänischen Wirtschaftswissenschaftler Tim Peter Bollerslev im Jahr 1986 vorgestellt. Der Nobelpreisträger von 2003, Robert F. Engle, leistete mit Tims Arbeit ebenfalls einen wichtigen Beitrag zur
FREE

Einführung Der Excessive Momentum Indicator ist ein Momentum-Indikator, der das exzessive Momentum direkt aus rohen Preisreihen misst. Der Excessive Momentum Indicator wurde ursprünglich von Young Ho Seo entwickelt und ist eine Erweiterung des Preisaktions- und Musterhandels. Dieser Indikator demonstriert das Konzept der Equilibrium Fractal Wave und der praktischen Anwendung zur gleichen Zeit. Excessive Momentum erkennt Marktanomalien und gibt uns viele Hinweise auf potenzielle Umkehr- und Ausbr

Einführung in Fractal Moving Average Der Indikator Fractal Moving Average wurde als Teil des Fractal Pattern Scanners entwickelt. Innerhalb des Fractal Pattern Scanners wurde der Fractal Moving Average Indikator als eine Vielzahl von Chart-Objekten implementiert. Bei über Tausenden von Chart-Objekten haben wir festgestellt, dass dies nicht die beste und effizienteste Art war, den Indikator zu betreiben. Es war zu rechenintensiv für den Indikator. Daher haben wir uns entschlossen, die Indikatorv
FREE

Einführung in den GARCH-Indikator GARCH ist die Abkürzung für Generalized Autoregressive Conditional Heteroskedasticity (verallgemeinerte autoregressive bedingte Heteroskedastizität) und ist ein in der Finanzbranche häufig verwendetes Volatilitätsvorhersagemodell. Das GARCH-Modell wurde erstmals 1986 von dem dänischen Wirtschaftswissenschaftler Tim Peter Bollerslev vorgestellt. Der Nobelpreisträger von 2003, Robert F. Engle, leistete mit Tims Arbeit ebenfalls einen wichtigen Beitrag zur Verfeine
FREE

Einführung in das Auftragsrisikomanagement EA ORM EA wurde speziell für die schnelle und präzise Ausführung von Marktaufträgen entwickelt, die mit unseren unten aufgeführten Price Action- und ökonometrischen Handelsstrategien verwendet werden können. ORM EA ist vollautomatisch und ORM EA ist sehr einfach zu bedienen. ORM EA ist völlig kostenlos. Sie können diese robuste Auftragsausführungsfunktion dieses ORM EA auch für jede andere Ihrer eigenen Handelsstrategien verwenden.
Handelsstrategie-Lei
FREE

Price Breakout Pattern Scanner ist ein automatischer Scanner für Trader und Investoren. Er kann folgende Muster automatisch aus Ihrem Chart erkennen. Kopf und Schulter - Übliches handelbares Muster. Reverse Head and Shoulder - Dieses Muster ist die umgekehrte Formation von Head and Shoulder. Double Top - Wenn der Kurs zweimal auf ein Widerstandsniveau trifft und dann in Richtung des Unterstützungsniveaus fällt, kann der Händler einen plötzlichen bärischen Ausbruch durch das Unterstützungsniveau

Einführung in Sideways Market Analyzer Ein bemerkenswerter Zeitraum mit geringer Volatilität und trendlosen Bewegungen auf dem Finanzmarkt wird als Seitwärtsmarkt bezeichnet. Früher oder später wird die geringe Volatilität zunehmen und der Kurs wird nach dem Seitwärtsmarkt einen Trend aufnehmen. Unter Handelsgesichtspunkten kann ein Seitwärtsmarkt als sehr guter Einstiegszeitpunkt für Händler dienen. Ein Sideways Market ist auch häufig Ausdruck einer Ansammlung von Großaufträgen von Großanlegern

Einführung in den Harmonic Pattern Scenario Planner
Der gegenwärtige Zustand des Devisenmarktes kann viele verschiedene mögliche Preispfade durchlaufen, um sein zukünftiges Ziel zu erreichen. Die Zukunft ist dynamisch. Daher ist die Planung Ihres Handels mit möglichen Zukunftsszenarien ein wichtiger Schritt für Ihren Erfolg. Um einem solch mächtigen Konzept gerecht zu werden, stellen wir Ihnen den Harmonic Pattern Scenario Planner vor, das erste prädiktive Harmonic Pattern Tool der Welt unter

Einführung in Smart Renko Die Hauptmerkmale von Renko Charting betreffen die Preisbewegung. Um Ihnen eine Vorstellung von seinem Funktionsprinzip zu geben, wird das Renko-Chart so konstruiert, dass ein Ziegelstein über oder unter dem Chart platziert wird, wenn der Kurs eine Bewegung über einen vordefinierten Bereich, die sogenannte Ziegelsteinhöhe, hinaus macht. Daher kann man natürlich eine klare Preisbewegung mit weniger Rauschen als bei anderen Charttypen sehen. Das Renko-Charting kann eine v
Einführung in den Support Resistance Indicator Unterstützung und Widerstand sind wichtige Kursniveaus, auf die man während des Intraday-Marktes achten sollte. Diese Preisniveaus werden oft vor der Entwicklung eines neuen Trends getestet oder stoppen den bestehenden Trend, was zu einer Trendumkehr an diesem Punkt führt. Hochpräzise Unterstützungs- und Widerstandsniveaus sind für erfahrene Händler unverzichtbar. Viele typische Handelsstrategien wie Ausbrüche oder Trendumkehr können gut um diese Un

Dieser innovative technische Indikator wurde entwickelt, um ruhige Marktphasen zu erkennen, bevor ein Markt mit hoher Volatilität einsetzt. Wie viele gute technische Indikatoren ist auch der Market Activity Index sehr stabil und kann ohne allzu große Einschränkungen auf viele Finanz- und Nicht-Finanzinstrumente angewendet werden. Der Marktaktivitätsindex eignet sich am besten, um die abwechselnden Formen von Märkten mit niedriger und hoher Volatilität zu visualisieren. Er ist ein sehr nützliches

Mean-Reversion-Angebot-Nachfrage-Indikator Mean Reversion Supply Demand ist ein Indikator zur Erkennung der wichtigen Angebots-Nachfrage-Zone in Ihrem Chart. Das Konzept des Angebots-Nachfrage-Handels beruht auf dem quantitativen Ungleichgewicht zwischen Kauf- und Verkaufsvolumen auf dem Finanzmarkt. In der Regel dient die Angebots-Nachfrage-Zone dazu, den Wendepunkt vorherzusagen. Damit eine Angebots-Nachfrage-Zone als erfolgreicher Handel funktioniert, sieht das Wellenmuster so aus, dass der K
Einführung in den Wendepunktindikator Die Trajektorien der Finanzmarktbewegungen ähneln sehr stark den polynomialen Krümmungen mit dem Vorhandensein von Zufallsschwankungen. Es ist allgemein bekannt, dass Wissenschaftler die Finanzdaten in viele verschiedene zyklische Komponenten zerlegen können. Wenn der Finanzmarkt mindestens einen Zyklus aufweist, dann muss der Wendepunkt für diese Finanzmarktdaten vorhanden sein. Unter dieser Annahme sollten die meisten Finanzmarktdaten eine Vielzahl von Wen

Einführung in Order Risk Panel Pro EA Order Risk Panel Pro EA ist die professionelle Version des einfachen Order Risk Management EA. Order Risk Panel Pro EA enthält drei leistungsstarke Funktionen in einem. Zu den drei leistungsstarken Funktionen gehören das visuelle Handels- und Risikomanagement, der Harmonic Volatility Line Indikator und das Trade Statistics Panel. Für alle diese drei Funktionen erhalten Sie den Preis von einer. Erstens bietet das Order Risk Panel Pro eine hocheffiziente visue
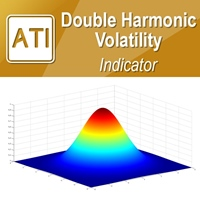
Einführung in den Double Harmonic Volatility Indicator Die Verwendung der Fibonacci-Analyse für den Finanzhandel reicht fast 85 Jahre zurück, seit der Geburt der Elliott-Wellen-Theorie von R. N. Elliott. Bis heute verwenden Händler die Fibonacci-Analyse, um die Muster in den Preisreihen zu erkennen. Wir konnten jedoch niemanden finden, der versucht hat, die Fibonacci-Analyse für die Volatilität zu verwenden. Der Harmonic Volatility Indicator war die erste technische Analyse, die die Fibonacci-An

Einführung in EFW Analytics EFW Analytics wurde entwickelt, um die Aussage "Wir handeln, weil es auf dem Finanzmarkt Regelmäßigkeiten gibt" zu erfüllen. EFW Analytics ist eine Reihe von Tools zur Maximierung Ihrer Handelsperformance durch Erfassung der sich wiederholenden fraktalen Geometrie, die als fünfte Regelmäßigkeit im Finanzmarkt bekannt ist. Die Funktionalität von EFW Analytics besteht aus drei Teilen. Erstens ist der Equilibrium Fractal Wave Index ein Sondierungsinstrument zur Unterstüt

EFW Pattern Trader ist ein leistungsstarker Musterscanner für den Devisen- und Aktienhandel. Die Mustererkennung in EFW Pattern Trader nutzt die Fraktale Wellentheorie, die die endlosen Auf- und Abwärtsbewegungen des Marktes erfasst. Daher kann EFW Pattern Trader als robuster Preisaktionsindikator betrachtet werden. Alle Muster in EFW Pattern Trader können visuell in Ihrem Strategietester getestet werden. Das visuelle Backtesting mit dem Muster zeigt Ihnen, wie sich das Muster wahrscheinlich im

Einführung in den harmonischen Volatilitätsindikator Der harmonische Volatilitätsindikator ist die erste technische Analyse, die die Fibonacci-Analyse auf die finanzielle Volatilität anwendet. Der harmonische Volatilitätsindikator ist eine weitere Ebene des Preisaktionshandels, die robuste Fibonacci-Ratios (0,618, 0,382 usw.) mit der Volatilität kombiniert. Ursprünglich wurde der harmonische Volatilitätsindikator entwickelt, um die Einschränkungen und Schwächen des Gann-Winkels, auch bekannt als

Einführung Der Excessive Momentum Indicator ist ein Momentum-Indikator, der das exzessive Momentum direkt aus rohen Preisreihen misst. Der Excessive Momentum Indicator wurde ursprünglich von Young Ho Seo entwickelt und ist eine Erweiterung des Preisaktions- und Musterhandels. Dieser Indikator demonstriert das Konzept der Equilibrium Fractal Wave und der praktischen Anwendung zur gleichen Zeit. Excessive Momentum erkennt Marktanomalien und gibt uns viele Hinweise auf potenzielle Umkehr- und Ausbr

Ace Angebot-Nachfrage-Zonen-Indikator Das Konzept der Angebots-Nachfrage-Zone beruht auf dem quantitativen Missverhältnis zwischen Kauf- und Verkaufsvolumen auf dem Finanzmarkt. Die Angebots- und Nachfragezone kann einen guten Ein- und Ausstieg bieten. Eine Zone ist leichter zu handeln als eine Linie. Die Angebots-Nachfrage-Zone kann einen detaillierten Handelsplan und ein Risikomanagement ermöglichen. Ihre Fähigkeit, die Marktrichtung vorherzusagen, ist hoch. Der Ace Supply Demand Zone Indicato

Einführung in den Fibonacci-Volatilitätsindikator Der Volatilitätsindikator kann Ihnen helfen, einen statistischen Vorteil für Ihren Handel zu erkennen. Insbesondere, wenn Sie mit Price Action und Price Patterns handeln, empfehlen wir Ihnen, den Volatilitätsindikator zusammen mit Ihrer Strategie zu verwenden. Der Fibonacci Volatilitätsindikator kombiniert die Marktvolatilität mit der Fibonacci-Analyse, um Ihnen einen fortgeschrittenen Volatilitätsindikator zu bieten. Wichtigste Merkmale Fibonacc
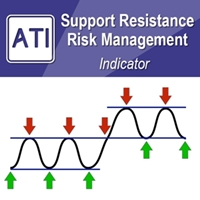
Einführung in das Risikomanagement von Support Resistance Support Resistance ist die vertrauenswürdigste technische Analyse. Allerdings wird das Risikomanagement für die Unterstützung und den Widerstand nicht oft praktiziert. Daher stellen wir eine effektive Risikomanagement-Methode für den Unterstützungs- und Widerstandshändler vor. In dem Buch: Scientific Guide To Price Action and Pattern Trading (Wisdom of Trend, Cycle, and Fractal Wave) wird beschrieben, wie man Support Resistance, Fibonacci

Einführung in Chart Pattern MT Chart Pattern MT ist ein Chartmuster-Scanner zur Erkennung von Dreiecksmustern, fallenden Keilmustern, steigenden Keilmustern, Kanalmustern und so weiter. Chart Pattern MT verwendet einen hochentwickelten Algorithmus zur Erkennung von Chartmustern. Wir haben es jedoch so gestaltet, dass es einfach zu bedienen ist und eine intuitive Benutzeroberfläche hat. Chart Pattern MT zeigt Ihnen alle Muster in Ihrem Chart im effizientesten Format für Ihr Trading. Sie müssen ke

Wie verwendet man die Pair Trading Station? Die Pair Trading Station wird für den H1-Zeitrahmen empfohlen und Sie können sie für alle Währungspaare verwenden. Um Kauf- und Verkaufssignale zu generieren, befolgen Sie die folgenden Schritte, um die Pair Trading Station auf Ihrem MetaTrader-Terminal anzuwenden. Wenn Sie die Pair Trading Station auf Ihren Chart laden, wird die Pair Trading Station die verfügbaren historischen Daten auf Ihrer MetaTrader-Plattform für jedes Währungspaar auswerten. Auf

Einführung Harmonische Muster eignen sich am besten zur Vorhersage potenzieller Wendepunkte. Traditionell wurden Harmonic Patterns manuell identifiziert, indem man Spitzen- und Tiefpunkte im Chart miteinander verband. Die manuelle Erkennung harmonischer Muster ist mühsam und nicht für jedermann geeignet. Bei der manuellen Erkennung von Mustern ist man oft subjektiven Einschätzungen ausgesetzt. Um diese Einschränkungen zu vermeiden, wurde Harmonic Pattern Plus entwickelt, um den Prozess der Erken

Price Breakout Pattern Scanner ist ein automatischer Scanner für Trader und Investoren. Er kann folgende Muster automatisch aus Ihrem Chart erkennen. Kopf und Schulter - Übliches handelbares Muster. Reverse Head and Shoulder - Dieses Muster ist die umgekehrte Formation von Head and Shoulder. Double Top - Wenn der Kurs zweimal auf ein Widerstandsniveau trifft und dann in Richtung des Unterstützungsniveaus fällt, kann der Händler einen plötzlichen bärischen Ausbruch durch das Unterstützungsniveau

Einführung in Sideways Market Analyzer Ein bemerkenswerter Zeitraum mit geringer Volatilität und trendlosen Bewegungen auf dem Finanzmarkt wird als Seitwärtsmarkt bezeichnet. Früher oder später wird die geringe Volatilität zunehmen und der Kurs wird nach dem Seitwärtsmarkt einen Trend aufnehmen. Unter Handelsgesichtspunkten kann ein Seitwärtsmarkt als sehr guter Einstiegszeitpunkt für Händler dienen. Der Sideways Market ist auch häufig Ausdruck einer Ansammlung von Großaufträgen von Großanlegern

Einführung in Smart Renko Die Hauptmerkmale von Renko Charting betreffen die Preisbewegung. Um Ihnen eine Vorstellung von seinem Funktionsprinzip zu geben, wird das Renko-Chart so konstruiert, dass ein Ziegelstein über oder unter dem Chart platziert wird, wenn der Kurs eine Bewegung über einen vordefinierten Bereich, die sogenannte Ziegelsteinhöhe, hinaus macht. Daher kann man natürlich eine klare Preisbewegung mit weniger Rauschen als bei anderen Charttypen sehen. Das Renko-Charting kann eine v

Einführung in den Support Resistance Indicator Unterstützung und Widerstand sind wichtige Kursniveaus, auf die man während des Intraday-Marktes achten sollte. Diese Preisniveaus werden oft vor der Entwicklung eines neuen Trends getestet oder stoppen den bestehenden Trend, was zu einer Trendumkehr an diesem Punkt führt. Hochpräzise Unterstützungen und Widerstände sind für erfahrene Händler unverzichtbar. Viele typische Handelsstrategien wie Ausbrüche oder Trendumkehr können gut um diese Unterstüt
Dieser innovative technische Indikator wurde entwickelt, um ruhige Marktphasen zu erkennen, bevor ein Markt mit hoher Volatilität einsetzt. Wie viele gute technische Indikatoren ist auch der Market Activity Index sehr stabil und kann ohne allzu große Einschränkungen auf viele Finanz- und Nicht-Finanzinstrumente angewendet werden. Der Marktaktivitätsindex eignet sich am besten, um die abwechselnde Form von Märkten mit niedriger und hoher Volatilität sichtbar zu machen. Er ist ein sehr nützliches

Einführung in den Wendepunktindikator Die Trajektorien der Finanzmarktbewegungen ähneln sehr stark den polynomialen Krümmungen mit dem Vorhandensein von Zufallsschwankungen. Es ist allgemein bekannt, dass Wissenschaftler die Finanzdaten in viele verschiedene zyklische Komponenten zerlegen können. Wenn der Finanzmarkt mindestens einen Zyklus aufweist, dann muss der Wendepunkt für diese Finanzmarktdaten vorhanden sein. Unter dieser Annahme sollten die meisten Finanzmarktdaten eine Vielzahl von Wen

Einführung in Order Risk Panel Pro EA Order Risk Panel Pro EA ist die professionelle Version des einfachen Order Risk Management EA. Order Risk Panel Pro EA enthält drei leistungsstarke Funktionen in einem. Zu den drei leistungsstarken Funktionen gehören das visuelle Handels- und Risikomanagement, der Harmonic Volatility Line Indikator und das Trade Statistics Panel. Für alle diese drei Funktionen erhalten Sie den Preis von einer. Erstens bietet das Order Risk Panel Pro eine hocheffiziente visue
Einführung in EFW Analytics EFW Analytics wurde entwickelt, um die Aussage "Wir handeln, weil es auf dem Finanzmarkt Regelmäßigkeiten gibt" zu erfüllen. EFW Analytics ist eine Reihe von Tools zur Maximierung Ihrer Handelsperformance durch Erfassung der sich wiederholenden fraktalen Geometrie, die als fünfte Regelmäßigkeit im Finanzmarkt bekannt ist. Die Funktionalität von EFW Analytics besteht aus drei Teilen. Erstens ist der Equilibrium Fractal Wave Index ein Sondierungsinstrument zur Unterstüt

EFW Pattern Trader ist ein leistungsstarker Musterscanner für den Devisen- und Aktienhandel. Die Mustererkennung in EFW Pattern Trader nutzt die Fraktale Wellentheorie, die die endlosen Auf- und Abwärtsbewegungen des Marktes erfasst. Daher kann EFW Pattern Trader als robuster Preisaktionsindikator betrachtet werden. Alle Muster in EFW Pattern Trader können visuell in Ihrem Strategietester getestet werden. Das visuelle Backtesting mit dem Muster zeigt Ihnen, wie sich das Muster wahrscheinlich im

Einführung in den harmonischen Volatilitätsindikator Der harmonische Volatilitätsindikator ist die erste technische Analyse, die die Fibonacci-Analyse auf die finanzielle Volatilität anwendet. Der harmonische Volatilitätsindikator ist eine weitere Ebene des Preisaktionshandels, die robuste Fibonacci-Ratios (0,618, 0,382 usw.) mit der Volatilität kombiniert. Ursprünglich wurde der harmonische Volatilitätsindikator entwickelt, um die Einschränkungen und Schwächen des Gann-Winkels, auch bekannt als

Einführung Dieser Indikator erkennt Volumen-Spread-Muster für Kauf- und Verkaufsgelegenheiten. Die Muster umfassen Nachfrage- und Angebotsmuster, die Sie für den Handel verwenden können. Diese Muster sind jedoch am besten geeignet, um die Nachfragezone (=Kumulierungsbereich) und die Angebotszone (=Verteilungsbereich) zu erkennen. Das Nachfragemuster zeigt im Allgemeinen eine potenzielle Kaufgelegenheit an. Das Angebotsmuster deutet im Allgemeinen auf eine potenzielle Verkaufsgelegenheit hin. Es

Ace Angebot-Nachfrage-Zonen-Indikator Das Konzept der Angebots-Nachfrage-Zone beruht auf dem quantitativen Missverhältnis zwischen Kauf- und Verkaufsvolumen auf dem Finanzmarkt. Die Angebots- und Nachfragezone kann einen guten Ein- und Ausstieg bieten. Eine Zone ist leichter zu handeln als eine Linie. Die Angebots-Nachfrage-Zone kann einen detaillierten Handelsplan und ein Risikomanagement ermöglichen. Ihre Fähigkeit, die Marktrichtung vorherzusagen, ist hoch. Der Ace Supply Demand Zone Indicato

Einführung in den X3 Chart Pattern Scanner X3 Cherart Pattern Scanner ist ein nicht nachzeichnender und nicht nachlaufender Indikator zur Erkennung von X3 Chartmustern, einschließlich Harmonic Pattern, Elliott Wave Pattern, X3 Pattern und Japanese Candlestick Pattern. Historische Muster stimmen mit Signalmustern überein. So können Sie leicht eine solide Handelsstrategie in Ihrem Chart entwickeln. Noch wichtiger ist, dass dieser großartige Musterscanner das optimale Muster seiner Art erkennen kan

Einführung in das Risikomanagement von Support Resistance Support Resistance ist die vertrauenswürdigste technische Analyse. Allerdings wird das Risikomanagement für die Unterstützung und den Widerstand nicht oft praktiziert. Daher stellen wir eine effektive Risikomanagement-Methode für den Unterstützungs- und Widerstandshändler vor. In dem Buch: Scientific Guide To Price Action and Pattern Trading (Wisdom of Trend, Cycle, and Fractal Wave) wird beschrieben, wie man Support Resistance, Fibonacci

Einführung in Chart Pattern MT Chart Pattern MT ist ein Chartmuster-Scanner zur Erkennung von Dreiecksmustern, fallenden Keilmustern, steigenden Keilmustern, Kanalmustern und so weiter. Chart Pattern MT verwendet einen hochentwickelten Algorithmus zur Erkennung von Chartmustern. Wir haben es jedoch so gestaltet, dass es einfach zu bedienen ist und eine intuitive Benutzeroberfläche hat. Chart Pattern MT zeigt Ihnen alle Muster in Ihrem Chart im effizientesten Format für Ihr Trading. Sie müssen ke