X3 Chart Pattern Scanner MT5
- Indikatoren
-
Young Ho Seo
 Harmonic Pattern Indicator - Repainting + Japanese Candlestick Pattern Scanner + Automatic Channel + Many more
https://www.mql5.com/en/market/product/4488 - Version: 8.71
- Aktualisiert: 12 Januar 2022
- Aktivierungen: 5
Einführung in den X3 Chart Pattern Scanner
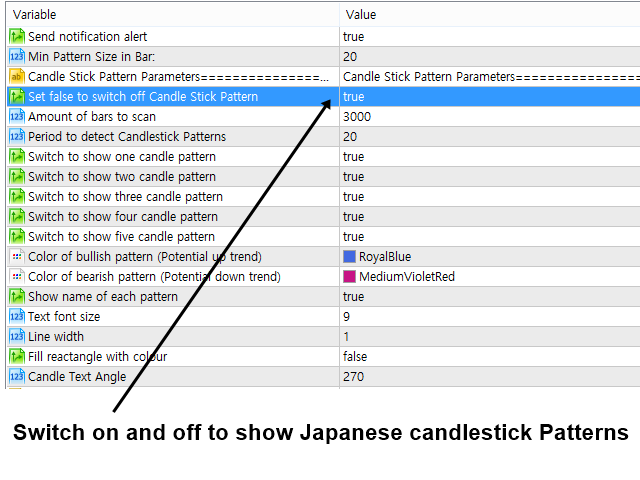
X3 Cherart Pattern Scanner ist ein nicht nachzeichnender und nicht nachlaufender Indikator zur Erkennung von X3 Chartmustern, einschließlich Harmonic Pattern, Elliott Wave Pattern, X3 Pattern und Japanese Candlestick Pattern. Historische Muster stimmen mit Signalmustern überein. So können Sie leicht eine solide Handelsstrategie in Ihrem Chart entwickeln. Noch wichtiger ist, dass dieser großartige Musterscanner das optimale Muster seiner Art erkennen kann. Darüber hinaus können Sie einzelne Muster nach Ihren Wünschen ein- und ausschalten. Wenn Sie zum Beispiel nur mit harmonischen Mustern handeln möchten, schalten Sie einfach alle Elliott-Wellen- und X3-Muster aus. Beachten Sie auch, dass jedes Muster mit der RECF-Notation anpassbar ist. Japanische Candlestick-Muster sind eine Art Bonuspaket, das dem Indikator hinzugefügt wurde. Japanische Candlestick-Muster können als sekundäre Bestätigung für harmonische Muster, Elliott-Wellen- und X3-Muster verwendet werden. Sie können auch die japanischen Candlestick-Muster ein- und ausschalten.
Kategorie der harmonischen Muster
Zu den erkennbaren harmonischen Mustern gehören Optimal AB=CD, Optimal Butterfly-Muster, Optimal Gartley-Muster, Optimal Bat-Muster, Optimal Alternate Bat-Muster, Optimal Shark-Muster, Optimal Crab-Muster, Optimal Deep Crab-Muster, Optimal Cypher-Muster, Optimal 5-0-Muster und Optimal 3 Drives-Muster.
Elliott-Wellen-Muster-Kategorie
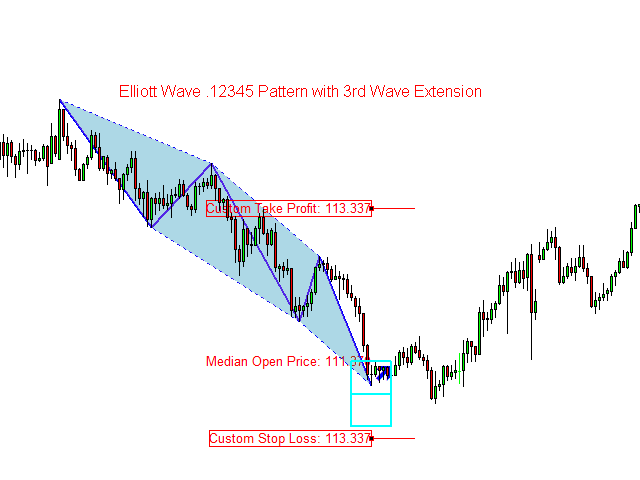
Zu den erkennbaren Elliott-Wellen-Mustern gehören Elliott-Welle .1234-Muster, Elliott-Welle .12345-Muster, Elliott-Welle .12345AB-Muster und Elliot-Welle .12345ABC-Muster. Darüber hinaus können Sie die Struktur der Elliott-Wellen-Muster nach Belieben ändern.
X3 Chart-Muster Kategorie
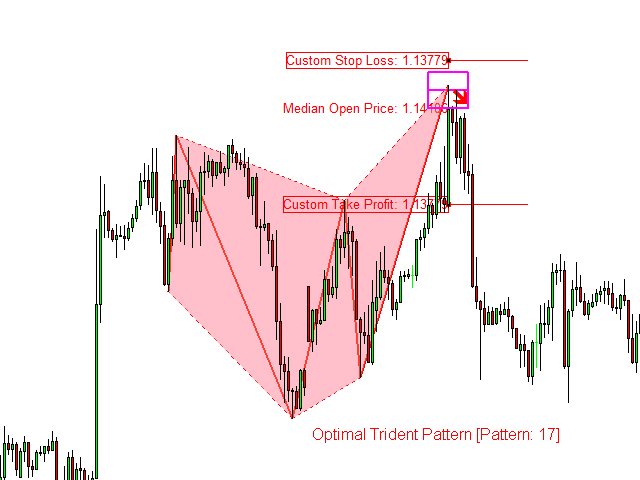
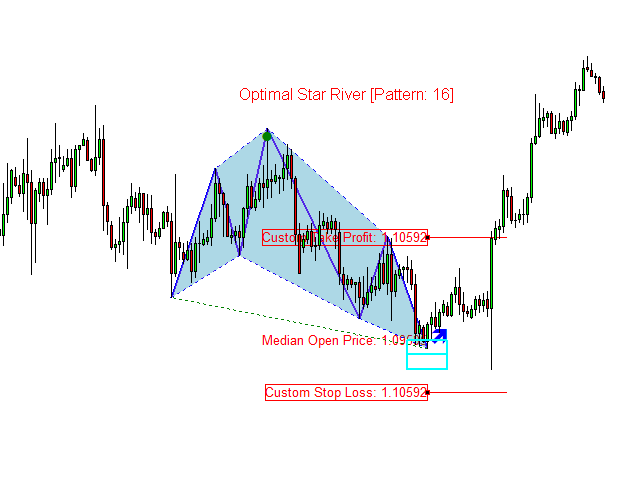
Zu den erkennbaren X3 Chartmustern gehören Star River Pattern, Trident Pattern, Horse Pattern, Eagle Pattern und Phoenix Pattern.
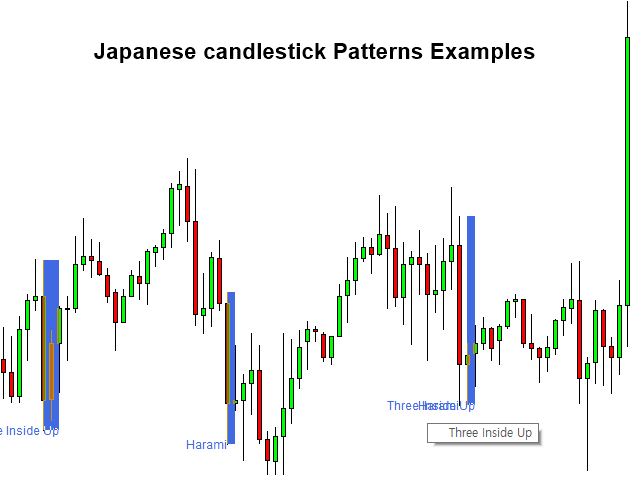
Kategorie Japanische Candlestick-Muster
Erkennbare japanische Candlestick-Muster umfassen Engulfing, Piercing Line, Morning Star, Doji Star, Hammer, Harami und viele weitere japanische Candlestick-Muster, die ebenfalls erkannt werden können.
Produktmerkmale
- Harmonische Muster, Elliott-Wellen-Muster und X3 Chart-Muster-Scanner, die sich nicht wiederholen und nicht verzögern
- Intervall der Mustervervollständigung
- Potenzielle Umkehrzone
- Potenzielle Fortsetzungszone
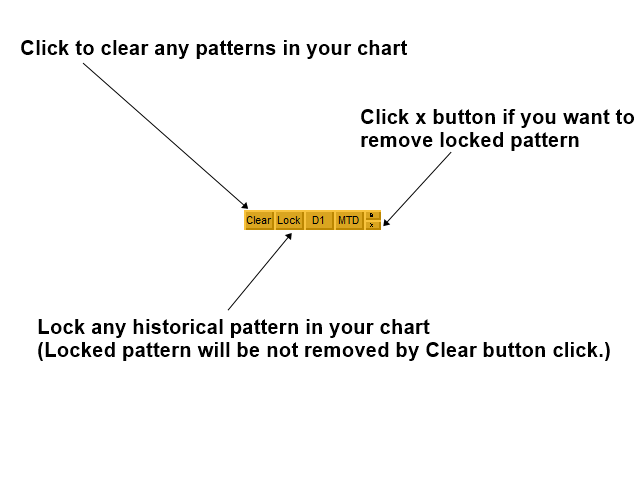
- Pattern Locking und Unlocking Funktion
- Interaktiver Stop-Loss und Take-Profit entsprechend Ihrem Reward/Risk-Verhältnis
- Historische Patterns
- Kann rund 52 japanische Candlestick-Muster erkennen
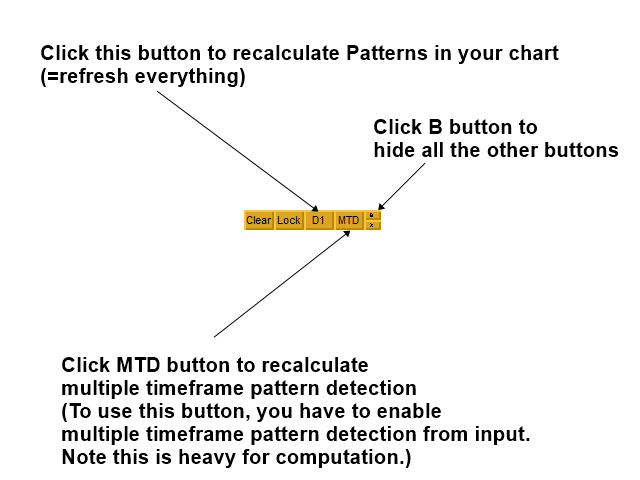
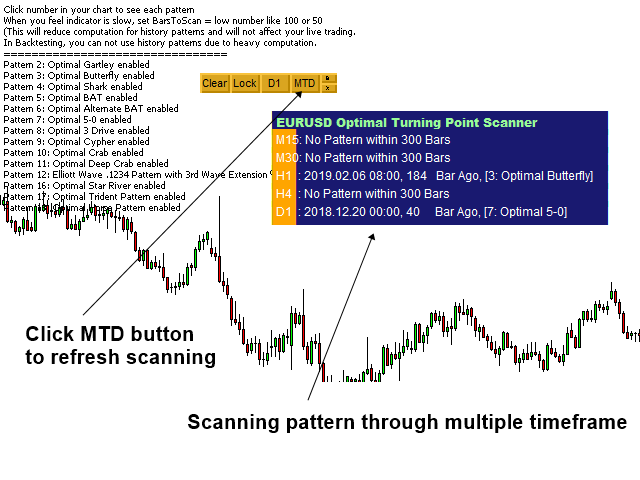
- Scannen von Mustern in mehreren Zeitrahmen für harmonische Muster, Elliott-Wellen-Muster und X3-Muster
Einstieg und Ausstieg für den Handel
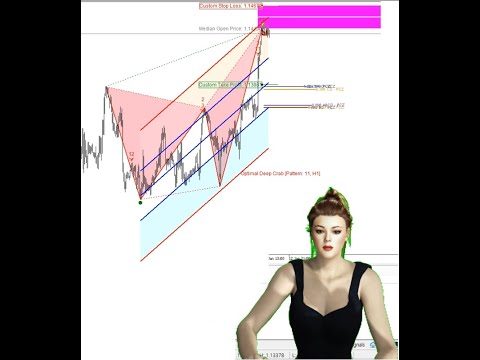
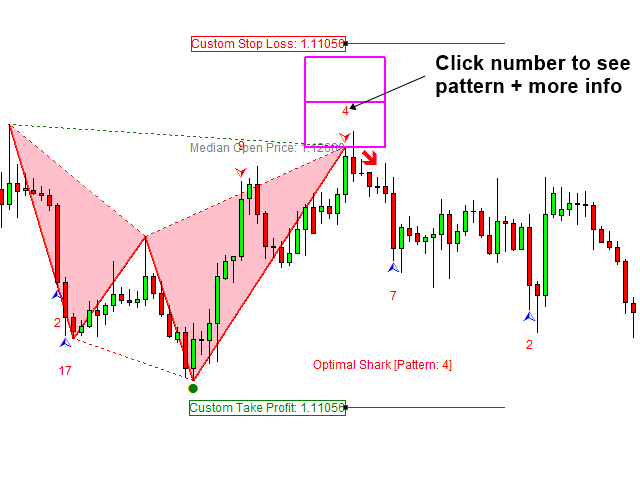
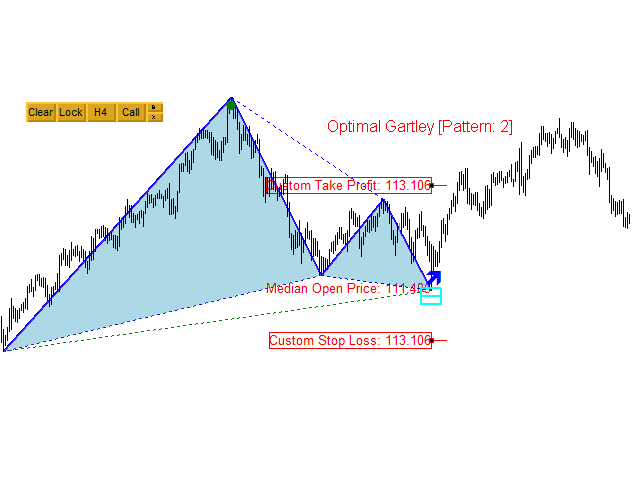
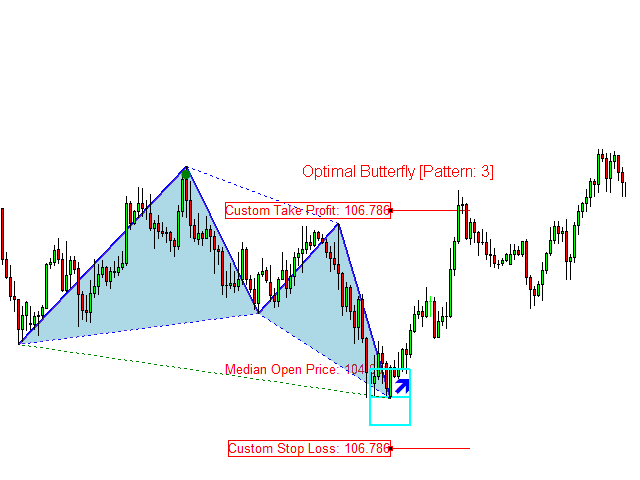
Dieser Indikator bietet drei wesentliche Komponenten für den Handel und die Verwaltung des Handelsrisikos, einschließlich des Intervalls für den Musterabschluss, der potenziellen Umkehrzone und der potenziellen Fortsetzungszone. Die vorgesehenen Stop-Loss- und Take-Profit-Ebenen sind beweglich und anpassbar. Die potenzielle Umkehrzone kann verwendet werden, um den Ort des Wendepunkts zu identifizieren. Die potenzielle Fortsetzungszone kann zur Vorhersage der zukünftigen Kursbewegung nach der Erkennung des Wendepunkts verwendet werden. Das Pattern Completion Interval ist der taktische Ort, an dem Sie den Break-Even oder den Trail-Stop für Ihren Gewinn setzen oder einen neuen Einstieg je nach Marktlage eröffnen können.
Sekundäre Bestätigung
Jeder erfahrene Händler wird empfehlen, die sekundäre Bestätigung zusammen mit X3-Chartmustern zu verwenden. Je nach Ihren Fähigkeiten können Sie verschiedene sekundäre Bestätigungstechniken mit dem X3 Chart Pattern Scanner kombinieren.
- Andere technische Indikatoren (z.B. RSI, CCI, MACD, etc.)
- Angebot-Nachfrage-Analyse
- Fundamentale Analyse
- Elliott-Wellen-Analyse
- Dreiecksmuster, steigender Keil und fallender Keil
Leitfaden zur Handelsstrategie
Eine detaillierte Handelsstrategie finden Sie unter dem unten stehenden Link. Wir empfehlen dringend, diesen Leitfaden zu lesen, bevor Sie diesen Indikator verwenden.
https://www.mql5.com/en/blogs/post/750344
https://www.mql5.com/en/blogs/post/750343
Wichtiger Hinweis
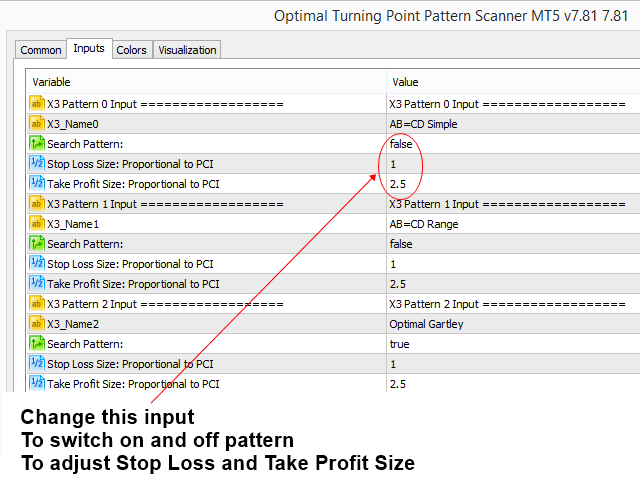
Der X3 Chart Pattern Scanner bietet viele gute Muster. Verwenden Sie jedoch nur die Muster, die Ihnen gefallen, da jedes Muster im Scanner ein- und ausgeschaltet werden kann. Dieser Indikator ist im Strategietester bis zu 80% seiner Funktionen testbar. Bitte testen Sie ihn vor dem Kauf. Dies ist ein Produkt von der Stange. Daher akzeptieren wir keine Änderungen oder Anpassungswünsche für dieses Produkt. Darüber hinaus bieten wir keine Code-Bibliothek oder Unterstützung für Ihre Kodierung für dieses Produkt.


I've tried so many pattern but Author pattern scanner is really top notch quality product, deserved more than 5 stars!