Time Box Indicator MT5
- Indikatoren
-
Young Ho Seo
 Harmonic Pattern Indicator - Repainting + Japanese Candlestick Pattern Scanner + Automatic Channel + Many more
https://www.mql5.com/en/market/product/4488 - Version: 1.5
- Aktualisiert: 4 März 2022
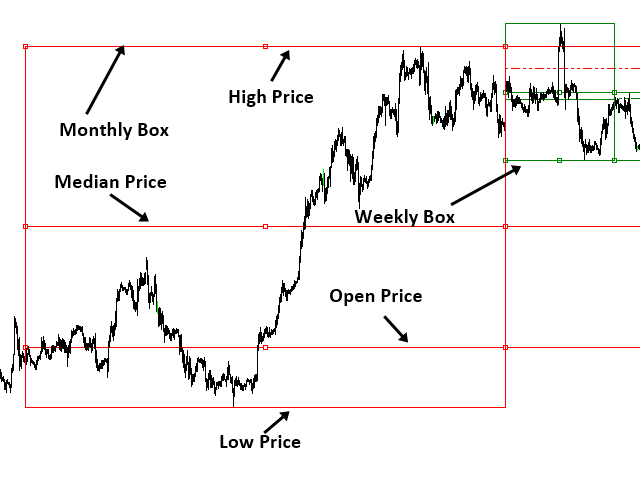
Einführung in den Timebox-Indikator
Der Time Box Indicator ist ein unverzichtbarer Indikator für jeden Trader. Er zeigt tägliche, wöchentliche und monatliche Boxen an, je nach Ihren Präferenzen.
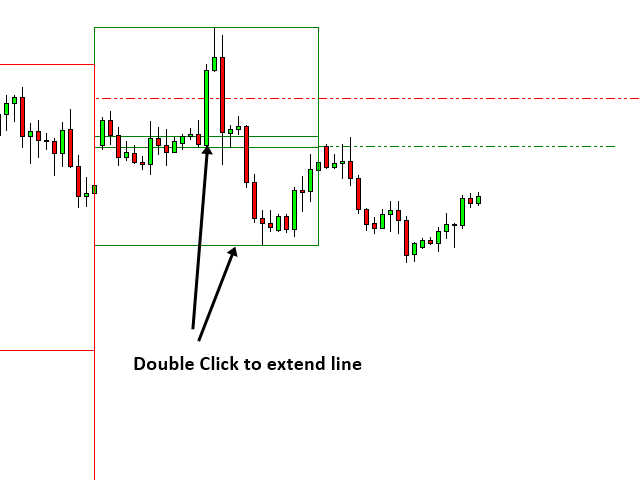
Sie können jedoch alle wichtigen Kursniveaus in Ihrem Chart automatisch erweitern. Sie können diese als wichtige Unterstützungs- und Widerstandsniveaus verwenden.
Es ist ein sehr einfaches, aber effektives Werkzeug für Ihren Handel.
Grafik-Einstellung
- Weißes Diagramm verwenden
- Linienstil für den aktuellen Eröffnungskurs
Tägliche Einstellung
- Zeitrahmen für die tägliche Box aktualisieren
- Anzahl der anzuzeigenden Tage
- Farbe der Tagesbox
- Breite der Tagesbox
Wöchentliche Einstellung
- Zeitrahmen für wöchentliche Box aktualisieren
- Anzahl der anzuzeigenden Wochen
- Farbe der Wochenbox
- Breite der Wochenbox
Monatliche Einstellung
- Zeitrahmen für monatliche Box aktualisieren
- Anzahl der anzuzeigenden Monate
- Farbe der Monatsbox
- Breite der Monatsboxen
Anleitung zur Handelsstrategie
Sie können den Time Box Indicator zusammen mit einer der folgenden technischen Analysen verwenden.
Analyse der Volumenspanne: https: //www.mql5.com/en/blogs/post/747652
Indikator zur Erkennung von harmonischen Mustern: https: //www.mql5.com/en/blogs/post/747647
Momentum-Indikator: https: //www.mql5.com/en/blogs/post/747633
Angebot-Nachfrage-Indikator: https: //www.mql5.com/en/blogs/post/747632
Dreiecksmuster, fallende Keilmuster, steigende Keilmuster und Kanäle: https: //www.mql5.com/en/blogs/post/747649
Elliott-Wellen-Indikator: https: //www.mql5.com/en/blogs/post/747668
Volatilitäts-Indikator: https: //www.mql5.com/en/blogs/post/747670
Wichtiger Hinweis
Dies ist ein Produkt von der Stange. Daher akzeptieren wir keine Änderungen oder Anpassungswünsche für dieses Produkt. Darüber hinaus bieten wir keine Code-Bibliothek oder Unterstützung für Ihre Codierung für dieses Produkt.


OK