Volume Spread Pattern Detector MT4
- Indikatoren
-
Young Ho Seo
 Harmonic Pattern Indicator - Repainting + Japanese Candlestick Pattern Scanner + Automatic Channel + Many more
https://www.mql5.com/en/market/product/4488 - Version: 1.9
- Aktualisiert: 3 März 2022
Einführung
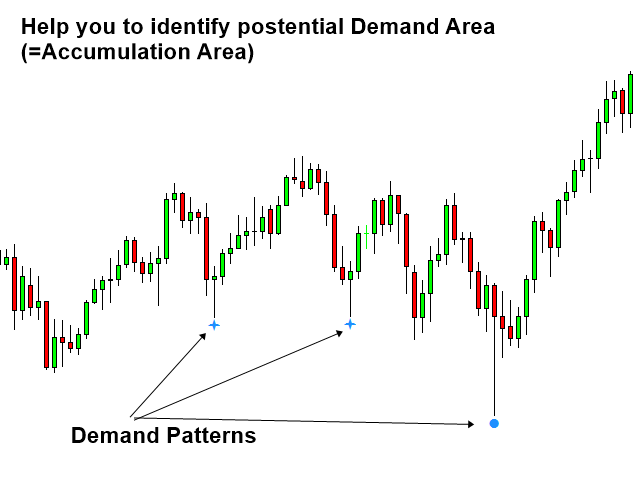
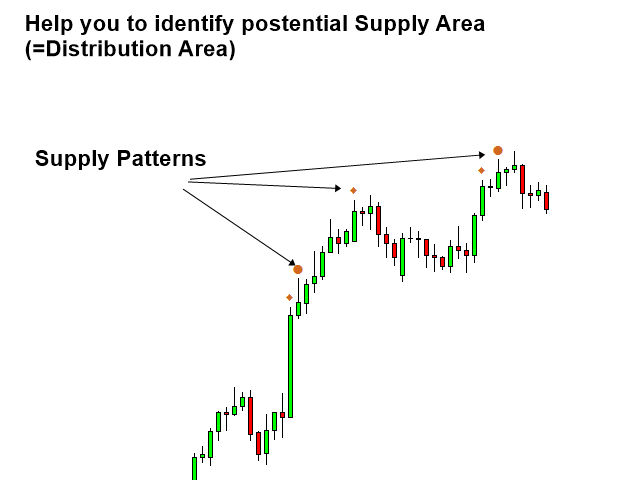
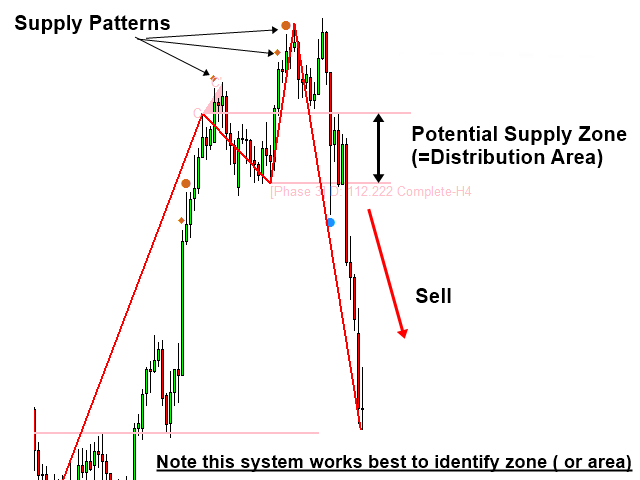
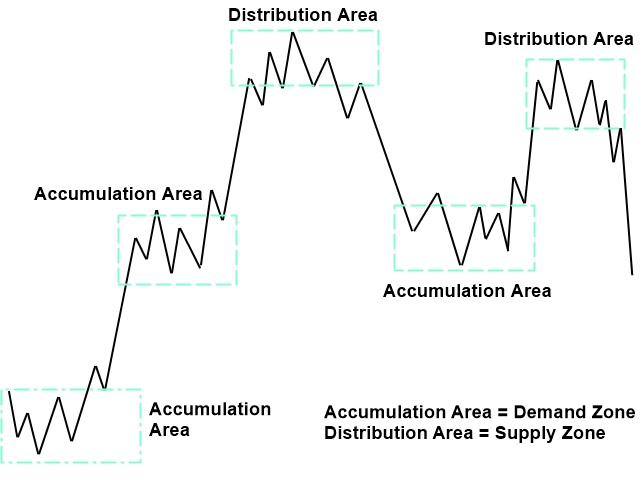
Dieser Indikator erkennt Volumen-Spread-Muster für Kauf- und Verkaufsgelegenheiten. Die Muster umfassen Nachfrage- und Angebotsmuster, die Sie für den Handel verwenden können. Diese Muster sind jedoch am besten geeignet, um die Nachfragezone (=Kumulierungsbereich) und die Angebotszone (=Verteilungsbereich) zu erkennen. Das Nachfragemuster zeigt im Allgemeinen eine potenzielle Kaufgelegenheit an. Das Angebotsmuster deutet im Allgemeinen auf eine potenzielle Verkaufsgelegenheit hin. Es handelt sich dabei um die zugrunde liegenden Muster und nicht um direkte Kursbewegungen. Die Wirkung des Kauf- und Verkaufsmarktes kann manchmal erst nach der Beobachtung mehrerer dieser Muster eintreten. Daher sind diese Muster nützlich, um eine mögliche Nachfragezone (=Kumulierungsbereich) oder Angebotszone (=Verteilungsbereich) zu erkennen. Insgesamt handelt es sich um einen leichten und einfachen Indikator zur Unterstützung Ihrer Handelsoperationen. Das Handelsprinzip basiert auf der modifizierten Volumen-Spread-Analyse. Wir verwenden die Unterphasen A, B, C, D und E der Wyckoff-Phasen nicht, da deren Erkennung sehr subjektiv ist. Stattdessen konzentrieren wir uns auf die Identifizierung von Akkumulations- und Distributionsbereichen anhand von Nachfrage- und Angebotsmustern. Dies ist ein einfacher und effektiverer Ansatz.
Eingabe Empfehlung
In den meisten Fällen können Sie die Standardeinstellung für diesen Volumen-Spread-Indikator verwenden. Vielleicht möchten Sie jedoch einige Eingaben für Ihre speziellen Bedürfnisse ändern. Hier finden Sie die vollständige Beschreibung der Eingabeeinstellungen.
Berechnungseinstellungen
- Zu scannende Takte: Anzahl der Balken zur Berechnung der Nachfrage- und Angebotsmuster.
- Indikator-Periode: Berechnungszeitraum für die Erstellung der einzelnen Angebots- und Nachfragemuster.
- Lookback-Faktor: 1.0 als Standard
- Signal-Rausch-Verhältnis: nur von 0,4 bis 1,0. (Eingabe, um zufällige Schwankungen in den Daten zu filtern.)
Einstellung des Indikators
- Weißen Hintergrund für das Diagramm verwenden: Setzen Sie diese Option auf false, wenn Sie nur die schwarze Standard-Hintergrundfarbe verwenden möchten.
- Farbe des Angebotsmusters: Farbe der Angebotsmuster.
- Farbe der Nachfragemuster: Farbe der Nachfragemuster
- Neutrale Musterfarbe: Farbe der neuronalen Muster oder keine Muster.
Handelsstrategie-Leitfaden
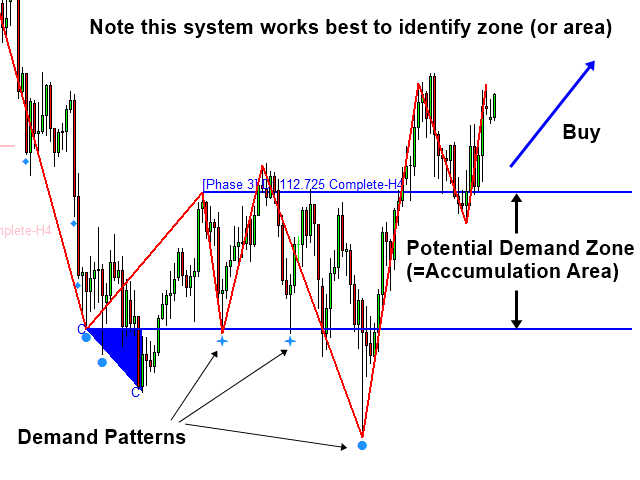
Der Volume Spread Pattern Indicator eignet sich am besten, um die Nachfragezone (=Kumulierungsbereich) und die Angebotszone (=Verteilungsbereich) zu identifizieren. Wenn Sie mit dem Indikator für übermäßiges Momentum arbeiten, wird der C-Punkt des übermäßigen Momentums zum Verkaufs-Höhepunkt (SC) oder zum Kauf-Höhepunkt (BC). Dann werden Sie Nachfrage- und Angebotsmuster verwenden, um den Akkumulationsbereich und den Distributionsbereich für Ihren Handel zu bestätigen. Sowohl kurzfristiger als auch langfristiger Handel ist möglich. Bitte prüfen Sie den unten stehenden Leitfaden für den Handel:
Strategie-Leitfaden: https: //www.mql5.com/en/blogs/post/750390
Bitte beachten Sie, dass Volume Spread Pattern Detector nur die Demo- oder Light-Version von Volume Spread Pattern Indicator ist. Stellen Sie sicher, dass Sie Volume Spread Pattern Indicator (Paid Version) verwenden, nachdem Sie Volume Spread Pattern Detector getestet und verstanden haben.Wichtiger Hinweis
Dies ist ein Produkt von der Stange. Daher akzeptieren wir keine Änderungen oder Anpassungswünsche für dieses Produkt. Darüber hinaus bieten wir keine Code-Bibliothek oder Unterstützung für Ihre Codierung für dieses Produkt.


Здравый подход, совместно с волновым анализом особенно хорошо