Pair Trading Station MT4
- Indikatoren
-
Young Ho Seo
 Harmonic Pattern Indicator - Repainting + Japanese Candlestick Pattern Scanner + Automatic Channel + Many more
https://www.mql5.com/en/market/product/4488 - Version: 7.2
- Aktualisiert: 13 Oktober 2021
- Aktivierungen: 5
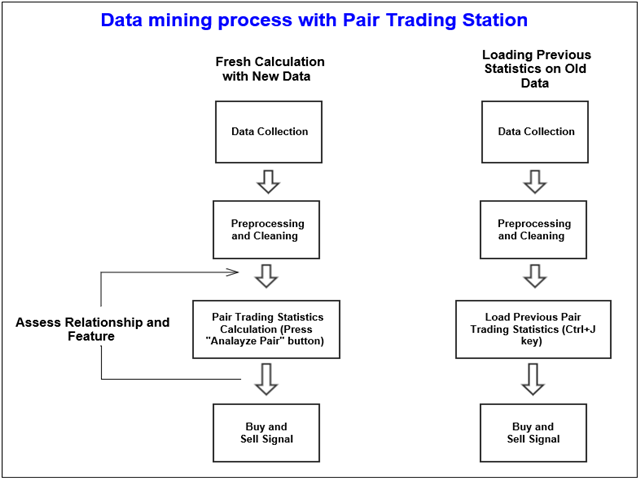
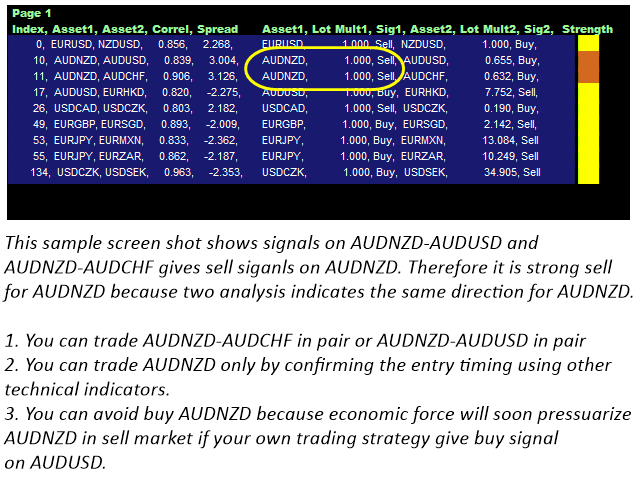
Wie verwendet man die Pair Trading Station?
Die Pair Trading Station wird für den H1-Zeitrahmen empfohlen und Sie können sie für alle Währungspaare verwenden. Um Kauf- und Verkaufssignale zu generieren, befolgen Sie die folgenden Schritte, um die Pair Trading Station auf Ihrem MetaTrader-Terminal anzuwenden.
- Wenn Sie die Pair Trading Station auf Ihren Chart laden, wird die Pair Trading Station die verfügbaren historischen Daten auf Ihrer MetaTrader-Plattform für jedes Währungspaar auswerten. Auf Ihrem Chart wird zu Ihrer Information die Menge der verfügbaren historischen Daten für jedes Währungspaar am Anfang angezeigt. Die Mindestvoraussetzung für die Berechnung der Paarhandelsstatistiken hängt von den verfügbaren historischen Daten ab. Für EURUSD und GBPUSD beispielsweise muss das MetaTrader-Terminal über passende historische Daten verfügen, um die Paarhandelsstatistiken für diese Paare zu berechnen. Wenn es nicht genügend historische Daten gibt, können Sie einige Dinge tun. Erstens können Sie Charts für dieses Währungspaar öffnen und MetaTrader kann einige historische Daten laden. Zweitens können Sie das Zentrum für historische Daten verwenden, um die historischen Daten manuell zu laden.
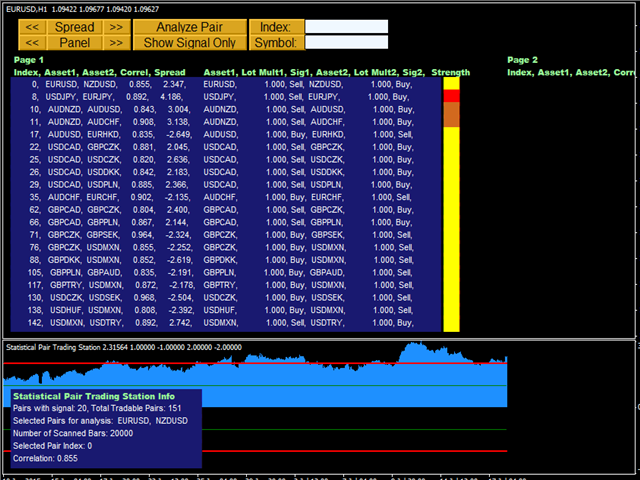
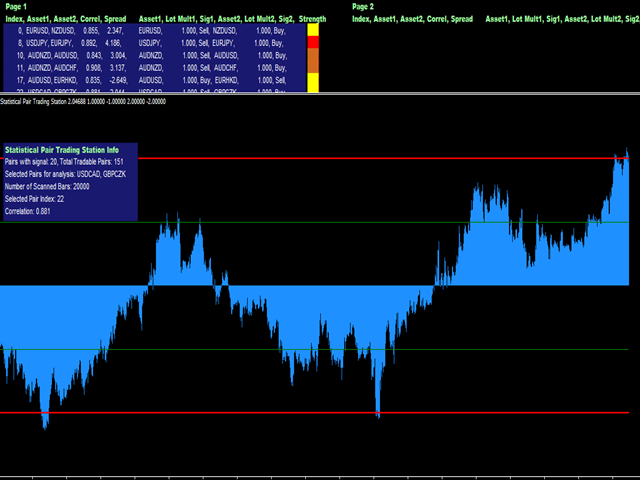
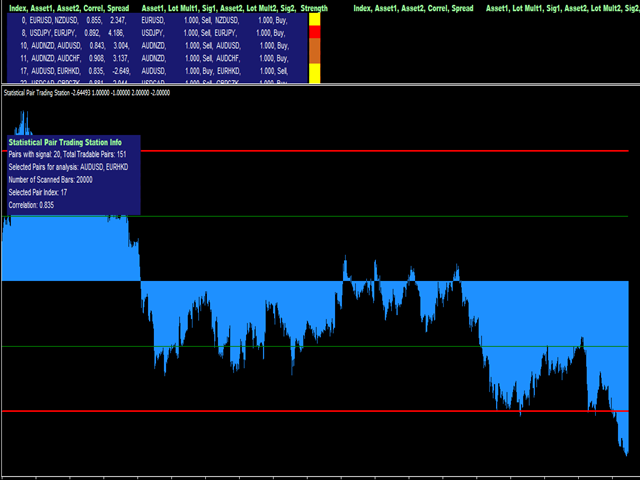
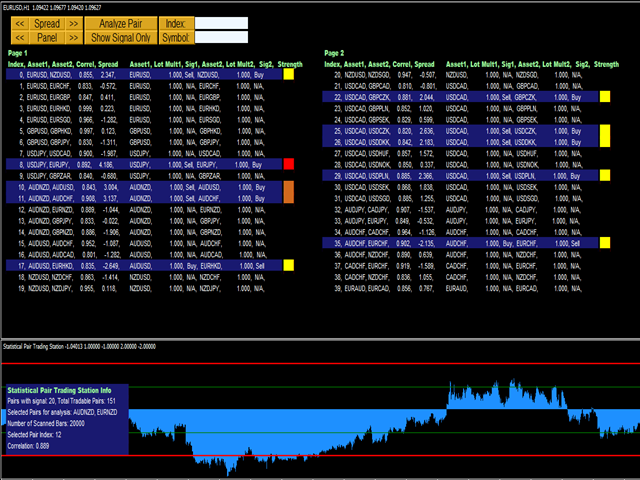
- Zweitens müssen Sie das Korrelationsniveau für die Pair Trading Station festlegen, um Handelssignale zu generieren. Ein höheres Korrelationsniveau gibt Ihnen genauere Handelssignale, aber Sie erhalten möglicherweise weniger Handelssignale. Unserer Erfahrung nach muss die Korrelation größer als 0,7 sein.
- Sobald Sie die Anzahl der für die Berechnung zu verwendenden Balken und das Korrelationsniveau festgelegt haben, ist es an der Zeit, Ihre Pair Trading Station zu bitten, eine intensive Berechnung durchzuführen, um Handelssignale zu generieren. Klicken Sie einfach auf die Schaltfläche "Pair analysieren", um die Berechnung fortzusetzen. Die Berechnung kann zwischen 30 Sekunden und mehreren Minuten dauern. Die Berechnungszeit hängt hauptsächlich von zwei Faktoren ab: der Anzahl der zu verwendenden Balken und der Anzahl der Währungspaare in Ihrer Marktüberwachung. Wenn Sie die Paarhandelsstatistiken bereits vor einiger Zeit berechnet haben, müssen Sie die intensive Berechnung nicht erneut durchführen, da die Pair Trading Station die neuesten Paarhandelsstatistiken speichert. Um die neuesten Paarhandelsstatistiken zu laden, müssen Sie nur die Tasten "Strg "+J auf Ihrer Tastatur drücken.
Unbedingt lesen und befolgen
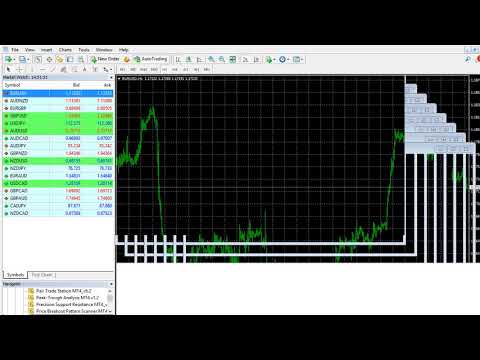
Achten Sie auf die richtige Anzahl von Symbolen in Ihrer Marktüberwachung. Andernfalls kann es Ihre CPU und Ihren Speicher überlasten. Beginnen Sie zunächst mit 8 wichtigen Symbolen in der Marktbeobachtung und erhöhen Sie die Anzahl schrittweise, wenn Sie den Prozess verstehen.
Viele Händler sind sich nicht bewusst, wie viele historische Daten in Ihren Charts geladen werden. In der Standardeinstellung werden normalerweise kurze historische Daten, die von Ihrem Broker voreingestellt sind, in Ihre Charts geladen. Um die Anzahl der historischen Daten in Ihren Charts für viele Währungspaare schnell zu erhöhen, können Sie im History Center nur H1 historische Daten zur schnellen Verarbeitung herunterladen. Sobald die Paarhandelsstatistiken berechnet und gespeichert sind, müssen Sie sich keine Sorgen mehr darüber machen, ob Ihr Broker Ihre historischen Daten überschreibt oder löscht, da die Pair Trading Station weiterhin Signale unter Verwendung der gespeicherten Informationen erzeugt.
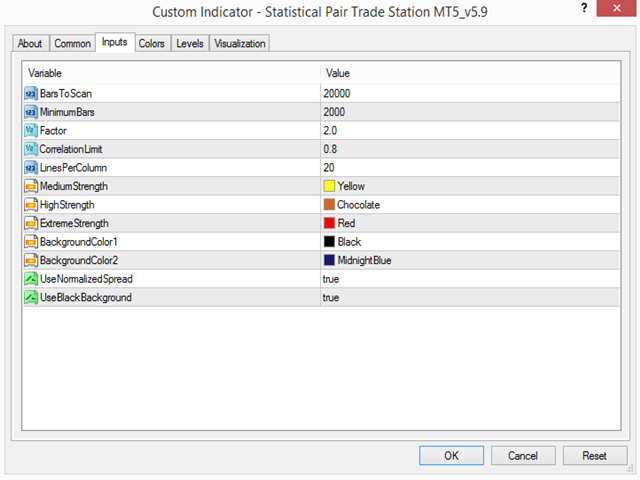
Eingabevariable Beschreibung
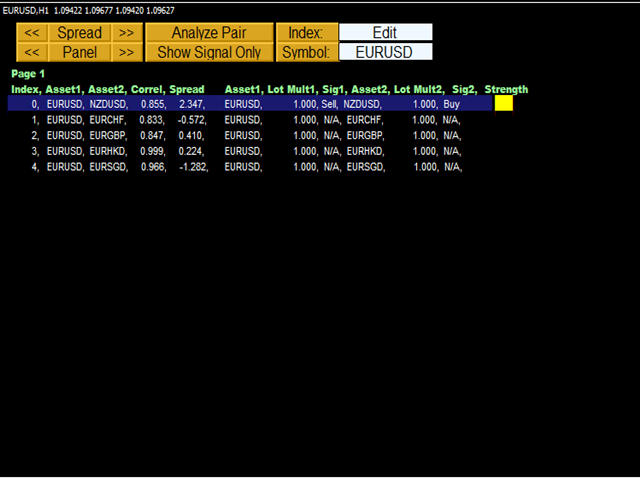
- Für die Berechnung zu scannende Bars: Um Paarhandelsstatistiken zu berechnen, müssen Sie angeben, wie viele historische Daten Sie für die Berechnung verwenden möchten. Überprüfen Sie die Währungspaare mit den kleinsten und größten historischen Daten, um eine Vorstellung davon zu bekommen, wie viele historische Daten in Ihrem MetaTrader-Terminal verfügbar sind. Wählen Sie dann eine gute Datenmenge für die Berechnung der Paarhandelsstatistiken.
- Mindestanzahl der Bars, die für die Berechnung berücksichtigt werden müssen: Die Pair Trading Station überspringt die Berechnung, wenn das Währungspaar weniger als die Mindestanzahl an Balken aufweist
- . Mindestfaktor für die Signalqualifikation: Normalerweise wird das Signal durch Faktor 2 qualifiziert, wie z.B. durch die Standardabweichung
- Korrelationsgrenze, um die Paare abzugleichen: Wenn die Korrelation zu niedrig ist, überspringt die Pair Trading Station die Berechnung.
- Zeilen pro Spalte, wenn das Signal angezeigt wird: Diese Variable gibt an, wie viele Zeilen des Signals pro Spalte in Ihrem Diagramm angezeigt werden sollen
- Farbe für Signal mittlerer Stärke: Kontrollfarbe für Signale mittlerer Stärke
- Farbe für Signale hoher Stärke: Kontrollfarbe für ein Signal mit hoher Stärke
- Farbe für ein Signal mit extremer Stärke: Kontrollfarbe für extrem starkes Signal
Wichtiger Hinweis
Bei diesem Produkt handelt es sich um ein handelsübliches Produkt im Geschäft. Daher nehmen wir keine persönlichen Änderungen oder Anpassungswünsche entgegen. Für unsere Produkte bieten wir keine Code-Bibliothek oder Unterstützung für Ihre Codierung.


This indicator is very satisfactory and works perfectly. When I encountered difficulties, I contacted the developer and was impressed by the prompt and kind feedback. It is very powerful when used together with the developer's other indicators.