Impulse Detector
- Indikatoren
-
Flavio Javier Jarabeck
 We are a closed brotherhood of traders whose ultimate goal is to profit through well-studied, structured, and automated trades. As a result, we publish dozens of MT5 indicators (FREE and paid) to the global MQL5 community. 80% of our published products are high-quality free indicators so beginner
 - Version: 1.5
- Aktualisiert: 14 Juli 2023
- Aktivierungen: 20
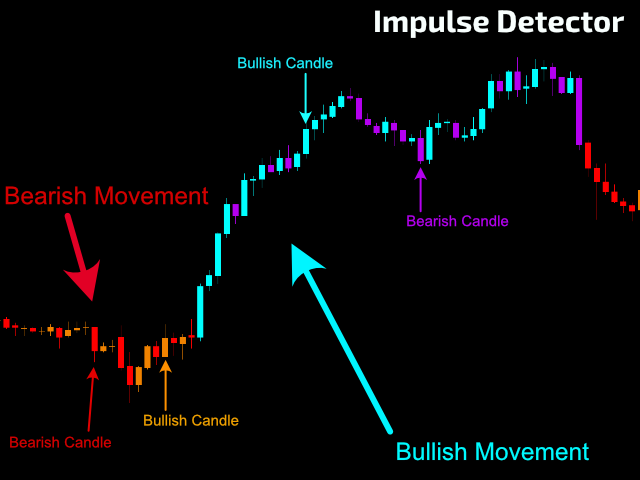
Stellen Sie sich ein Support-Tool vor, das die Candlesticks auf Ihrem Chart entsprechend dem Marktverhalten einfärbt, basierend auf Trend, Momentum, Preisverhalten und/oder Volumen. Sie wählen, was Sie verwenden möchten!
Willkommen bei der Kreation von Minions Labs, dem Impulse Detector!
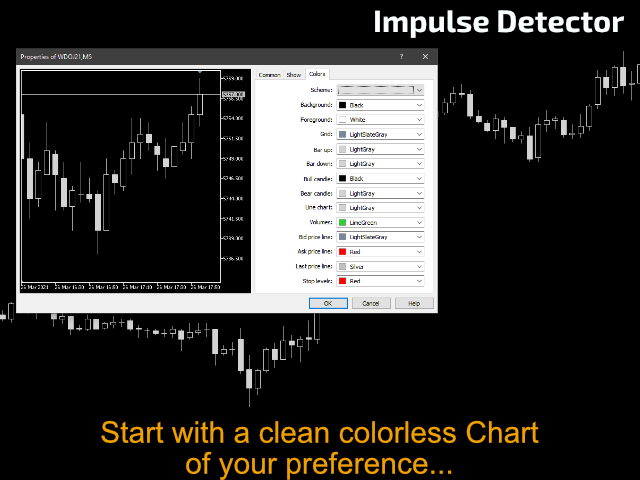
Dieser flexible Indikator wurde entwickelt, um Ihnen visuelle Unterstützung auf Ihrem Chart zu geben, indem er nur farbige Candlesticks verwendet, so dass Sie weiterhin Ihre Studien zeichnen und andere Indikatoren in zusätzlichen Unterfenstern verwenden können, ohne Ihren realen Bildschirmzustand zu beeinträchtigen.
Es spielt keine Rolle, ob Sie ein Anfänger oder ein fortgeschrittener Trader sind, die visuellen Hilfen des Impuls-Detektors werden Ihnen helfen, den richtigen Zustand und die Stimmung des Marktes auf der Grundlage Ihrer persönlichen Kalibrierungen und Bedürfnisse zu bestimmen. Dieser Indikator ist in jeder Hinsicht vollständig anpassbar, so dass Sie genau die Werte erhalten können, die Sie von dem Markt, dem Zeitrahmen und der Strategie, mit der Sie handeln, erwarten.
WELCHE INFORMATIONEN ERHALTEN SIE VON DIESEM INDIKATOR?
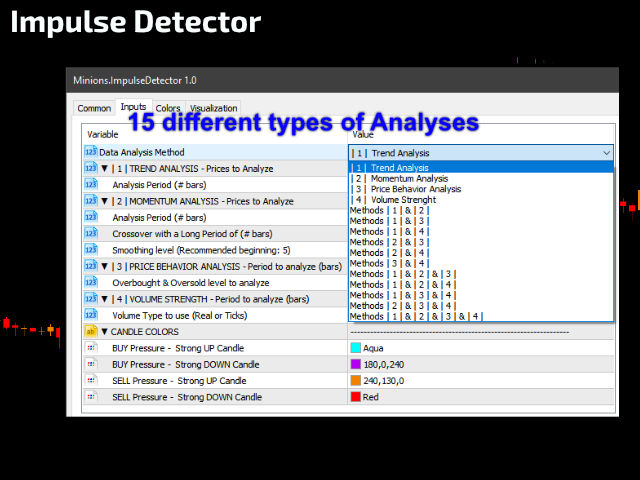
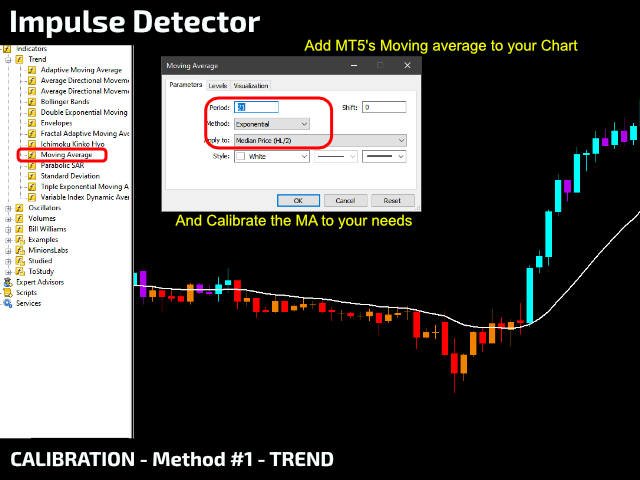
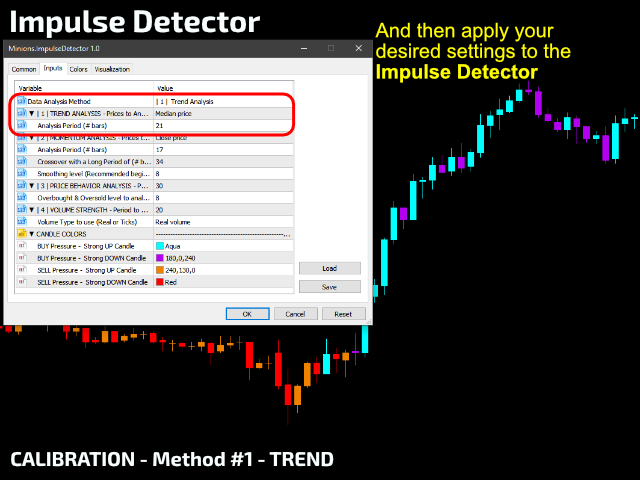
- Analyse #1 - TREND - Exponentieller gleitender Durchschnitt über dem Preis. Überwacht, wann der EMA nach oben oder unten zeigt, und malt Ihre Kerzen entsprechend.
- Analyse #2 - MOMENTUM - Für diese Analyse haben wir den sehr bekannten OSMA-Indikator verwendet. Die Kerzen leuchten auf, wenn der OSMA nach oben/unten zeigt und sich über/unter seiner Nulllinie befindet.
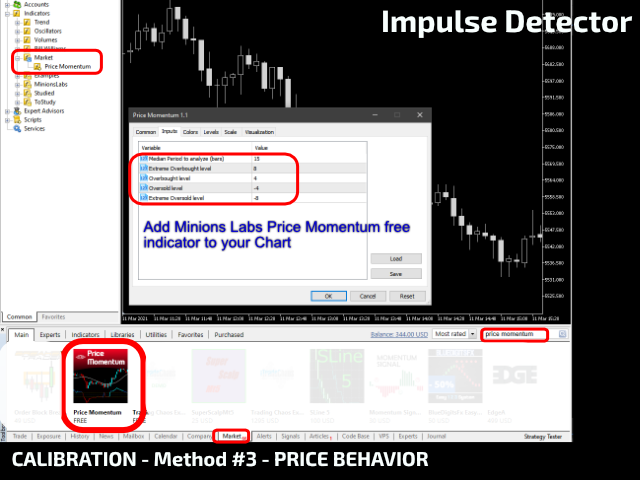
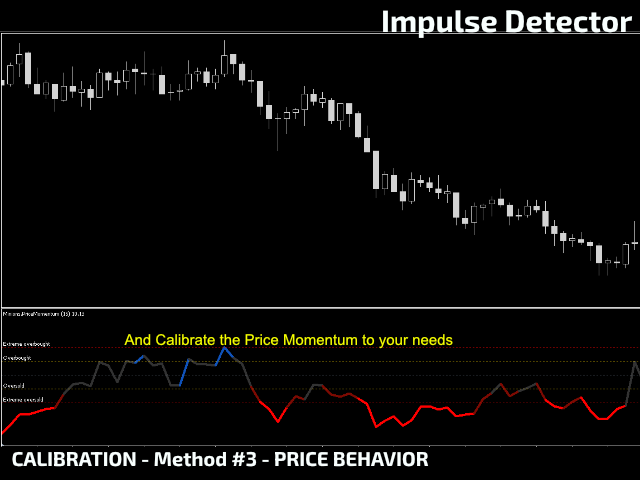
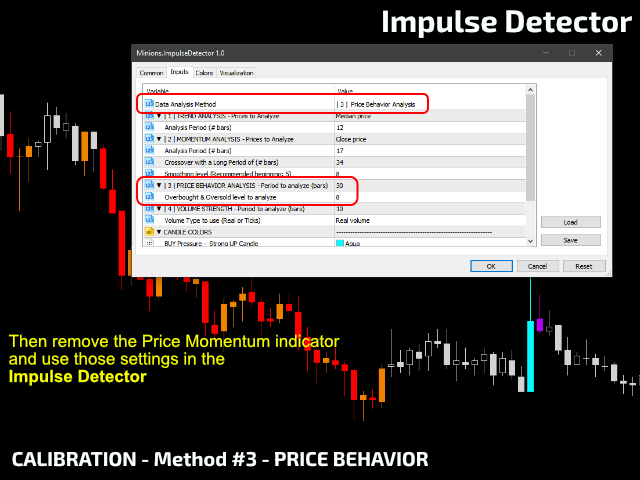
- Analyse #3 - PREISVERHÄLTNIS - Für diese Analyse haben wir einen anderen (kostenlosen) Indikator von Minions Labs verwendet, das Preismomentum. Wenn also das Preismomentum über/unter den konfigurierten Schwellenwerten liegt, leuchten die Kerzen auf.
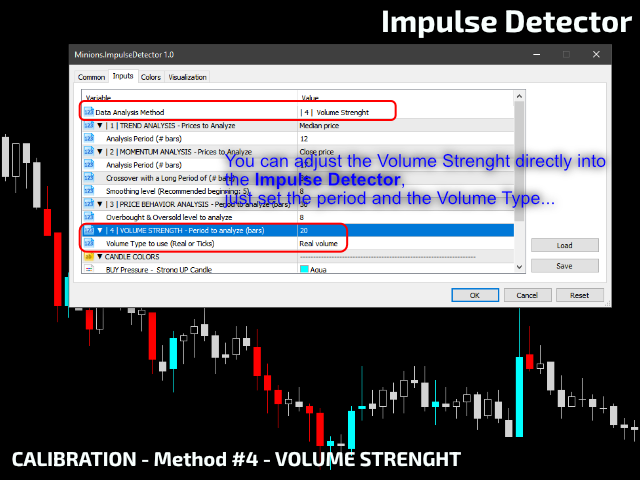
- Analyse #4 - VOLUME STRENGHT - Und schließlich haben Sie die Möglichkeit, die Volumenanalyse zu Ihrem Vorteil zu nutzen. Wenn das Volumen für jede Kerze den festgelegten Schwellenwert übersteigt, wird diese Kerze aufgehellt.
Sie können jede der oben genannten Analysen wählen UND sie auch nach Belieben kombinieren, denn Sie haben die Möglichkeit, bis zu 15 Analysetypen zu kombinieren. Mit diesem Arsenal an Analysewerkzeugen können Sie eine sehr leistungsfähige visuelle Referenz für Ihre Handelsstrategien aufbauen, ohne Ihr Interface mit Tonnen von Linien und Bildschirmindikatoren aufzublähen.
Bitte sehen Sie sich die beigefügten Videos und Screenshots für den Kalibrierungsprozess und alle Details an.
EINSTELLUNGEN
- Zu verwendendeDatenanalysemethode - Trend, Momentum, Preisverhalten, Volumen, ODER eine beliebige Kombination dieser Techniken (insgesamt 15).
- Trendanalyse - Preistyp für die Berechnungen + Analysezeitraum.
- Momentum-Analyse - Zu verwendender Preistyp + Analysezeitraum + Langfristiger MA + Glättungsgrad
- Analyse des Preisverhaltens - Zeitraum der Analyse + Überkaufte und überverkaufte Niveaus
- Volume Strenght - Zeitraum der Analyse + Volume Type zu verwenden: Reales Volumen oder Tick-Volumen (Forex)
- Candles Coloring System - Während eines Aufwärts-/Abwärtstrends, welche Farben werden verwendet, um Bullish und Bearish Candles zu signalisieren.
- *** NEUES FEATURE v1.1 /v1.2/v1.3 ***
- Schalten Sie Alarme ein/aus: Auf dem Bildschirm, per Mail, per Handy (MT5-App)
- Präfix-Nachricht, die in den Alarmen verwendet werden soll.
- Wartezeit zwischen wiederholten Alerts.
- Legt fest , ob Sie Alarme in Echtzeit oder nur bei Kerzenschluss sehen möchten.
Möchten Sie es selbst ausprobieren, live in Ihren Assets? Laden Sie die DEMO-Version hier herunter: Impuls-Detektor DEMO
* Aufgrund der neuen MQL5-Politik können die Entwickler hier auf dieser Website keine DEMO-Versionen mehr für die Allgemeinheit zur Verfügung stellen.
- #0 - Puffer BUY Signal - ASK Preis, sonst Null (0).
- #1 - Puffer SELL Signal - BID Preis, sonst Null (0).
Haben Sie eine benötigte Funktion nicht gefunden?
Kein Produkt ist perfekt für jeden. Wenn Sie glauben, dass Sie eine Funktion in unserem Produkt vermissen, schicken Sie uns einfach eine Nachricht. Wir lieben Feedback!


Incredible indicator with so many features and inputs for different strategies at same time. Then Flavio Jarabek has an huge technical experience and always ready in fast way to support and help you in everything you wish to complete and fulfill your needs.