适用于MetaTrader 5的技术指标 - 14

Setup 9.1 strategy created by the North American trader Larry Williams . SIMPLE setup, effective, with a good level of accuracy and excellent return. Attention : The Demo version only works on the tester, if you are interested in running it in real time, please contact me and I will provide another version. Buy Signal:
Exponential moving average of 9 (MME9) is falling, wait it to TURN UP (in closed candle). Place a buy stop order 1 tick above the HIGH of the candle that caused the turn to occur.
Category: Oscillator Indicator
Platform: MetaTrader 5
Type: Entry Indicator
Timeframes: All
Trader Styles: Scalping, Day Trading, Swing Trading, Binary Options
Markets: All Description The Two-Pole Oscillator is an analytical tool based on deviation calculations and a two-pole smoothing filter. It is designed to highlight momentum conditions and potential trading signals while filtering out short-term noise. Main features: Two-Pole Filtering – Reduces chart noise for smoother oscillator curves.

Multi Timeframe Chart in Seconds 是一款指标,允许交易者在单个图表上直接可视化从自定义时间周期计算的价格数据。该指标支持 基于秒、分钟和小时的计算 ,并将计算结果以 彩色蜡烛线 显示在当前图表上。 该指标汇总来自 非标准或高/低时间周期 的价格数据,并在当前图表环境中准确呈现,无需打开多个图表进行时间周期比较。
适用人群 此指标适用于需要在单个图表中观察不同时间周期价格行为的用户。它适合分析 秒、分钟或小时 市场结构的交易者,并需要紧凑的多时间周期视图,而无需切换图表周期。
附加资源 如果您想在 非标准图表 上添加指标,请考虑相关产品: Multi Timeframe Indicators in Seconds
https://www.mql5.com/en/market/product/158101 该产品是大多数默认自定义指标的合集,位于 MQL5/Indicators/Examples/ 文件夹中,经过调整以支持 多时间周期计算 ,包括 基于秒和自定义时间周期 。 内置的 loader 指标 可让您选择所需的指标和计算时间周期。指标可应用于 标
FREE

ZPOWER BUY & SELL INDICATOR
Trade Smarter. Trade Confidently. Trade Profitably.
Are you tired of second-guessing your trades? Do you enter late and exit too early — leaving money on the table? It’s time to upgrade your strategy with the ZPOWER BUY & SELL INDICATOR, built with institutional-grade logic that helps you catch high-probability trade setups with precision.
Why ZPOWER is Different
Unlike ordinary indicators that flood your charts with noise, ZPOWER is engineered with advanced
FREE

KT CCI Divergence shows the regular and hidden divergence created between the price and CCI oscillator. Divergence is one of the vital signals that depicts the upcoming price reversal in the market. Manually spotting the divergence between price and CCI can be a hectic and ambiguous task.
Limitations of KT CCI Divergence
Using the CCI divergence as a standalone entry signal can be risky. Every divergence can't be interpreted as a strong reversal signal. For better results, try to combine it w

Auto Order Block with break of structure based on ICT and Smart Money Concepts (SMC)
Futures Break of Structure ( BoS )
Order block ( OB )
Higher time frame Order block / Point of Interest ( POI ) shown on current chart
Fair value Gap ( FVG ) / Imbalance - MTF ( Multi Time Frame )
HH/LL/HL/LH - MTF ( Multi Time Frame )
Choch MTF ( Multi Time Frame )
Volume Imbalance , MTF vIMB
Gap’s Power of 3
Equal High / Low’s

A personal implementation of the famous Bollinger bands indicator as a trend following mechanism, which uses a moving average and the standard deviation to define what a trend is and when it changes. Bollinger bands are usually used as an oversold/overbought indicator only, but in my opinion, the trading approach is more complete using the trend variant as an exit strategy. [ Installation Guide | Update Guide | Troubleshooting | FAQ | All Products ] Easy to trade Customizable colors and sizes I
FREE

Trading Session Indicator The Trading Session Indicator visualizes the high and low points as well as the start and end times of the Asian, London, and New York trading sessions directly on your chart. Features: Visualization of major trading sessions Highlighting of high and low points Display of start and end times for each session Customizable session times User-friendly and efficient Customizability: Each trading session (Asian, London, New York) can be individually customized to match speci
FREE

MACD Leader – Zero-Lag Trend & Momentum Indicator for MT5 MACD Leader is an advanced momentum and trend-following indicator for MetaTrader 5, designed to reduce the inherent lag of traditional MACD by applying a zero-lag smoothing technique. It provides earlier signals while preserving the smoothness and structure traders expect from MACD-based tools. Smoothing methods introduce delay, and since MACD relies on moving averages, it naturally lags behind price. While lag cannot be completely elimin

ICT Turtle Soup Complete System - MT5 Indicator Overview The ICT Turtle Soup Complete System is an advanced MT5 indicator that combines Inner Circle Trader (ICT) concepts with the classic Turtle Soup trading pattern. This sophisticated tool identifies liquidity sweep reversals at key levels, providing high-probability trade setups with complete risk management calculations. Key Features 1. Multi-Timeframe Liquidity Detection Tracks Daily, 4H, 1H, and Yesterday's High/Low levels Identifies
FREE

Este indicador traça uma reta baseada em regressão linear, esta reta é dinâmica e é atualizada a cada tick. O cálculo de regressão linear é feito considerando o número de candles definido pelo tamanho da janela fornecida pelo usuário. São traçadas duas linhas, uma superior e uma inferior, para guiar a estratégia do usuário, a distância dessas linhas para a linha central deve ser configurada. É possível definir os estilos, cores e espessuras de cada uma das linhas.
Esse indicador foi inicialmen
FREE
What is the Chart Sync Indicator? This custom MQL5 tool enables multi-timeframe chart synchronization, addressing a common pain point in technical analysis: the inconsistencies when switching between chart windows or timeframes. Instead of managing each chart separately, this indicator links them so actions such as panning, zooming, drawing objects, or changing symbols are mirrored across all synced charts of the same symbol. The result is a smoother, unified analysis experience. Key Advantages:
FREE

Indicator determines the direction of price movement, calculates the possibility of entering the market using an internal formula and displays a breakout entry signal. Indicator signals appear both at the beginning of trend movements and in the opposite direction, which allows you to open and close orders as efficiently as possible in any of the market conditions. Version for МТ4: https://www.mql5.com/en/market/product/58349
Benefits: a unique signal calculation formula; high signal accuracy; d
FREE

HiLo Activator is a technical analysis indicator developed by Robert Krausz, a renowned hungarian trader with a career in the USA.
It is a trend indicator that helps you to predict the cange of the current trend. In an uptrend it is displayed at the bottom of the candles; in a downtrend it is displayed at the top.
Its only setting is the calculation period.
It is possible to have alerts when a new trend begin. Enjoy! This is a free indicator, but it took hours to develop. If you want to pay me a
FREE
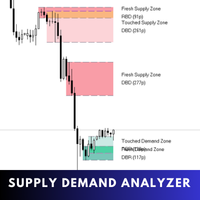
Supply Demand Analyzer is an advanced trading indicator meticulously designed for the precise identification, analysis, and management of supply and demand zones. By integrating real-time data and advanced algorithms, this tool enables traders to recognize market phases, price movements, and structural patterns with unparalleled accuracy. It simplifies complex market dynamics into actionable insights, empowering traders to anticipate market behavior, identify trading opportunities, and make in
VWMA Signal Pro – 多周期成交量加权趋势面板 VWMA Signal Pro 是一款分析型指标,将成交量加权移动平均线 (VWMA) 与趋势确认过滤器及多周期面板结合使用。
它帮助交易者通过成交量加权价格走势与波动率确认,识别趋势方向和动能强度。 该指标在多个周期上计算 VWMA,并显示经过 ADX、ATR、VWAP 过滤确认的买入/卖出信号。每个信号都有强度评级(弱、正常、强),用于评估市场动能。 主要特征 多周期信号面板(M1 至 D1)。 基于成交量、RSI 和波动率的信号强度分析。 ADX、ATR、VWAP 过滤器。 可调灵敏度模式(N、X、Y、Z)。 十种专业主题。 可自定义位置、颜色、字体和透明度。 优化性能,低资源占用。 VWMA Signal Pro 提供清晰高效的成交量趋势分析,适用于短线、日内和波段交易。

MT4版本 | FAQ Owl Smart Levels Indicator 是一個完整的交易系統,包含 Bill Williams 的高級分形、構建正確的市場波浪結構的 Valable ZigZag 以及標記準確入場水平的斐波那契水平等流行的市場分析工具 進入市場和地方獲利。 策略的详细说明 指示灯使用说明 顾问-贸易猫头鹰助手助理 私人用户聊天 ->购买后写信给我,我会将您添加到私人聊天中,您可以在那里下载所有奖金 力量在於簡單!
Owl Smart Levels 交易系統非常易於使用,因此適合專業人士和剛開始研究市場並為自己選擇交易策略的人。 策略和指標中沒有隱藏的秘密公式和計算方法,所有策略指標都是公開的。 Owl Smart Levels 允許您快速查看進入交易的信號,突出顯示下訂單的水平並向您發送有關已出現信號的通知。 優點很明顯: 清楚地顯示主要和更高時間框架的趨勢方向。 指示儀器信號的出現。 標記開單、止損設置和固定利潤的水平。 沒有多餘的,只有必要的結構! ZigZag 表示全球趨勢的方向,因此也表示貿易方向。 市場反轉點的短線清楚地表明在什麼水平上構建斐波那

FREE Bookmap Volume Heatmap Indicator Overview The Bookmap Volume Heatmap is a custom MetaTrader 5 (MQL5) indicator that creates a visual heatmap of trading volume distribution across price levels, similar to professional trading platforms like Bookmap. It provides traders with a clear visualization of where significant trading activity has occurred within a specified price range. Key Features 1. Volume Distribution Visualization Creates color-coded rectangles on the chart representing vol
FREE

ADR 警报仪表板一目了然地向您显示当前价格相对于其正常平均每日范围的交易位置。当价格超过您选择的平均范围和高于它的水平时,您将通过弹出窗口、电子邮件或推送获得即时警报,以便您可以快速跳入回调和反转。破折号旨在放置在空白图表上,只需坐在背景中并在达到水平时提醒您,因此您无需坐下来观看甚至看!
此处提供 MT4 版本: https://www.mql5.com/en/market/product/62756
新:现在还向您显示平均每周和每月范围,并提醒他们!
获取在您的图表上绘制水平的 ADR 反转指标: https://www.mql5.com/en/market/product/64477
大约 60% 的时间价格在其正常的平均每日范围 (ADR) 内交易并推高这些水平通常是价格急剧波动的指标,通常会出现回调(获利了结)走势。您可以通过交易从每日范围的顶部或底部回落到最近的支撑位或阻力位来利用这些急剧波动。
收集了超过 20 年的历史数据,以找出主要外汇对和一系列交叉盘的价格超出特定 ADR 水平的平均百分比。该数据表明价格仅在 3% 的时间内超过其 ADR 的 200%

Session Break Out 指标 – 交易时段分析的终极工具 Session Break Out 指标 是一款先进的工具,旨在帮助交易者监测市场交易时段,并有效利用基于时间的交易策略。专业交易者深知,在外汇市场中,不同交易时段的货币强度和波动性各不相同,时间因素至关重要。 使用此强大指标,您可以:
追踪市场交易时段 – 立即识别当前活跃的交易时段及开放的市场。 监测时段高点和低点 – 关注关键价位,寻找突破或反转机会。 捕捉全新突破 – 当交易时段的高点或低点被突破时,实时收到提醒。 适配任何时区 – 轻松调整指标以匹配您的本地 GMT 设置。 可视化交易时段重叠 – 通过精美的图形界面清晰展示交易时段的转换。 历史交易时段框架 – 轻松开启历史时段显示,回顾市场结构。 即时买入 & 卖出信号 – 突破发生时,屏幕上显示实时提醒和箭头。 为什么选择 Session Break Out 指标? 简单安装 – 只需几秒钟即可轻松设置,无需复杂配置。
用户友好界面 – 直观设计,轻松读取交易时段数据。
强大的交易信号 – 适合希望利用交易时段趋势的交易者。 立即使用 Session
FREE
High-precision Buy/Sell flip signal indicator designed for FlipX Markets on Weltrade and Volatility pairs on Deriv. FlipToxin was coded specifically for the 5-minute (M5) chart, but also works on higher timeframes with caution. On Boom, Crash, PainX, and GainX, the 15-minute chart is suggested, especially in trending markets. Scalping Mindset Reminder
This indicator is designed for quick, precise entries and exits — perfect for traders who aim for fast, smaller profits that add up over time t

"Wouldn't we all love to reliably know when a stock is starting to trend, and when it is in flat territory? An indicator that would somehow tell you to ignore the head fakes and shakeouts, and focus only on the move that counts?" The Choppiness Index is a non-directional indicator designed to determine if the market is choppy (trading sideways) or not choppy (trading within a trend in either direction). It is an oscillating indicator between -50 (very trendy) and +50 (very choppy). There are man

Swing BOS Structure is a market structure indicator for MetaTrader 5.
The indicator automatically detects: • Swing High (SH) • Swing Low (SL) • Break of Structure (BOS) • Change of Character (CHoCH)
Swings are confirmed only after a defined number of candles, ensuring no repainting. BOS signals indicate trend continuation. CHoCH signals indicate a potential change in market structure and may appear less frequently depending on market conditions and timeframe.
The indicator is lightweight, fa
FREE

https://www.mql5.com/en/users/gedeegi/seller The GEN indicator is a multifunctional technical analysis tool for the MetaTrader 5 (MT5) platform. It is designed to automatically identify and display key Support and Resistance (S&R) levels and detect False Breakout signals, providing clear and visual trading cues directly on your chart. Its primary goal is to help traders identify potential price reversal points and avoid market traps when the price fails to decisively break through key levels
FREE

ATR Progress Control
Trading is all about probability, and if you don't know how much range the price has left today, you're trading blind.
This indicator is your dashboard that answers the most important question before a trade: does it make mathematical sense to enter the market right now? It's a tool for professional volatility analysis that helps filter out false entries and avoid trades when the move is already exhausted.
What's the problem?
Imagine that the average daily movement (ATR

Trend Regularity Adaptive Moving Average Indicator for MT5
TRAMA Indicator for MT5 Overview
The Trend Regularity Adaptive Moving Average (TRAMA) is an intelligent adaptive moving average that dynamically adjusts its sensitivity based on market structure and trend consistency. Unlike standard moving averages, TRAMA reacts to how frequently new highs or lows are formed within a defined period, providing an adaptive balance between trend-following precision and range stability. How It Works
TRAM

特点
用于检查价格量的指标。 主要适用于EURUSD,其他货币对可能无法工作或计算时间较长。 为了平稳使用,请打开“将图表边界从右边界向右移”的选项,如屏幕截图所示。 出现新的柱状数据时重置数据。
变量 COlOR:指标颜色设置 WIDTH:指标宽度设置 PERIOD:确定计算数据的时间周期
------------------------‐-----------------------------------------------------------------------------------------------------------------------------------------------
FREE

前一版本指标的发展 ZigZag WaveSize MT4 ZigZag WaveSize - 修改后的标准锯齿指标,增加了波浪长度、水平和不同警报逻辑的信息
一般改进: 为MetaTrader 5适配代码 优化了图形对象的操作 新特性: 极值处的水平线 选择水平类型:水平线/射线/线段 液性水平滤波器(未被价格突破) 突破缓冲区:设置对错误突破的敏感度 标签设置和功能:数量、外观、删除旧标签 结构突破警报(BoS) 移动性质变化警报(ChoCH) 优化: 修正更新极值的逻辑 动态更新新对象 减少新柱出现时的负载 集中的标签系统 修复: 修复了数组越界问题 正确的标签定位 删除了重复的参数
将ZigZag WaveSize指标作为您交易系统的补充使用 也可以尝试我在市场上的其他产品 https://www.mql5.com/ru/users/capitalplus/seller
如果您喜欢该指标,请对其进行评分并留下评论,这对我来说非常重要!
祝您交易获利丰厚!
FREE

这是基于双均线交叉和箭头标识下单的自定义指标。 当出现蓝色箭头向上时做多单。 当出现红色箭头向下时做空单。 当粉红色线向上穿过绿色线交叉时,粉红色线在上方,绿色线在下方,出现金叉,会出现蓝色箭头。 当粉红色线向下穿过绿色线交叉时,粉红色线在下方,绿色线在上方,出现死叉,会出现红箭头。
这是经典的双线交叉金叉死叉很好的实现,并且用箭头标识出下单点,准确率较高,然后编写出来根据线颜色和箭头很好标识下单方向的指标,无时间,货币对限制。 当前指标最好在30分钟,1小时,4小时上工作,效果较好。 当前指标不建议用在1分钟或5分钟或15分钟或1day以上时间周期,虽然然指标是无限制的,但是效果不太好。 本指标工作平台最好选择点差比较小的交易商。
FREE

Multi Currency Strength Dashboard Mini(免费版)— MetaTrader 5 货币强弱指标 Multi Currency Strength Dashboard Mini 是一款面向 MetaTrader 5 的免费指标,可在同一面板中实时显示 8 大主要货币 (USD、EUR、GBP、JPY、CHF、CAD、AUD、NZD)的相对强弱(0–100 归一化)。 目标:让你用几秒钟快速识别 强势货币 与 弱势货币 ,更高效地建立观察列表,并按“强对弱”的逻辑筛选交易货币对。 核心功能(Mini 免费版) 一次性分析 8 大主要货币 的强弱。 可视化 Dashboard: 强弱柱状条 + 百分比读数。 自动实时更新(轻量刷新)。 支持 所有图表周期 (计算基于你选择的周期)。 兼容大多数经纪商(支持常见交易品种后缀)。 工作原理 指标会从 Market Watch 中可用的主要外汇货币对提取价格变化,计算每种货币在指定周期与指定回溯长度下的强弱值,并将结果归一化到 0–100 区间后展示为排名式面板。 快速使用步骤 在 Market Watch 中显示主
FREE
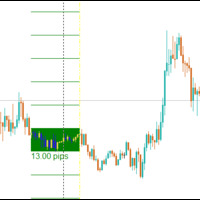
The Central Bank Dealers Range (CBDR) is a key ICT concept, used to project potential highs and lows for the day based on market conditions during a specific time window. The CBDR is utilized to forecast price movements in both bullish and bearish market conditions. By identifying this range, traders can better anticipate the price levels that may form as the day progresses.
CBDR and Standard Deviation A key feature of the CBDR is its application of standard deviation , a statistical measure u
FREE

MOVING AVERAGE RIBBON Ritz MA Ribbon Dynamics – The Next-Gen Trend Visualizer Ritz MA Ribbon Dynamics is a futuristic multi-layer Moving Average system engineered to visualize trend momentum, volatility balance, and market rhythm in one adaptive ribbon.
Designed for modern traders who demand clarity, flexibility, and automation — this tool transforms the classic MA visualization into a dynamic analytical framework. Core Concept The indicator creates a multi-tier MA Ribbon that adapts to the cho
FREE
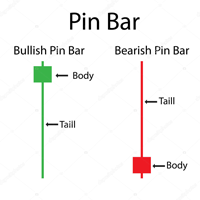
Pin bar pattern is characterized by a long upper or lower wick with a small body relative to the size of the wick with little to no lower or upper shadows. Pin bars are not to be traded in isolation , but need to be considered within the larger context of the chart analysis. A pin bar entry signal, in a trending market, can offer a very high-probability entry and a good risk to reward scenario.
Inputs Multiplier ; AlertOn - enable alerts; EmailAlert - enable email alerts; PushAlert - en
FREE

This indicator is very useful for day traders or short term traders. (MT5 version) No need to calculate the number of pips manually, just look at the chart and you will see the Virtual Take Profit / Virtual Stop Loss target line and evaluate whether the entry point is feasible to reach the intended target or not.
Enter the intended Take Profit / Stop Loss pips for your trade. The indicator will display Virtual Take Profit / Virtual Stop Loss lines for you to easily see if the target is
FREE

This MQL5 indicator draws four Exponential Moving Averages (EMAs) — 21, 50, 100, and 200 — directly on the chart window.
The EMA 21 is displayed as a color-changing line , while EMA 50, 100, and 200 are standard single-color lines.
The color of EMA 21 changes dynamically based on price position.
When the closing price is above EMA 21 , the line turns blue , indicating bullish pressure.
When the closing price is below EMA 21 , the line turns yellow , indicating bearish pressure.
If the price equa
FREE

Hydra Trend Rider is a non-repainting, multi-timeframe trend indicator that delivers precise buy/sell signals and real-time alerts for high-probability trade setups. With its color-coded trend line, customizable dashboard, and mobile notifications, it's perfect for traders seeking clarity, confidence, and consistency in trend trading. Setup & Guide: Download MT4 Version here. To learn how to use the Indicator: Indicator Manual & Guide - Read Here
Exclusively for you: It's your chance to st

MACD 2 Line MTF (Multi-Timeframe) Indicator for MetaTrader 5 This custom MetaTrader 5 indicator implements a classic MACD with two lines (MACD Line and Signal Line) and a color-coded histogram , enhanced with multi-timeframe capability . It allows traders to monitor MACD trends from higher or lower timeframes directly on the current chart. Key Features: MACD Line (Fast EMA minus Slow EMA) Signal Line (SMA of MACD Line) Histogram Up/Down : Displays positive values in green and negative values in
FREE
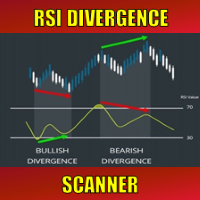
Special offer : ALL TOOLS , just $35 each! New tools will be $30 for the first week or the first 3 purchases ! Trading Tools Channel on MQL5 : Join my MQL5 channel to update the latest news from me 在动态的金融市场中,识别趋势反转信号对于有效交易至关重要。RSI Divergence Scanner 旨在帮助您准确高效地检测各种货币对和时间框架下的 RSI 背离信号。 查看更多 MT4 版本请访问: RSI Divergence MT4 Scanner 查看更多产品请访问: 所有 产品 1. 理解 RSI 背离 RSI(相对强弱指数) 是一种衡量价格动量的技术指标,广泛被交易者使用。RSI 背离发生在价格走势和 RSI 方向相反时,表明潜在的趋势反转。 背离类型: 看涨背离: 价格形成更低的低点,但 RSI 形成更高的低点。 表明下跌趋势可能在减弱,可能
FREE
If you love this indicator, please leave a positive rating and comment, it will be a source of motivation to help me create more products <3 Key Takeaways VWAP is a trading benchmark that typically is most useful to short-term traders. VWAP is used in different ways by traders . Traders may use it as a trend confirmation tool and build trading rules around it. Also, If prices below VWAP and move above it, c an be used by traders as a sell signal. If prices above VWAP and move below it, ca
FREE

Time your Entry and Exits with Average True Range (ATR) Trailing Stops ATR Trailing Stops are primarily used to protect capital and lock in profits on individual trades but they can also be used, in conjunction with a trend filter, to signal entries. The indicator will help make your calculation of stop loss easier as it will be visually aiding you in choosing where to put your stoploss level on the chart by calculating the current value of ATR indicator. For those who are unfamiliar with ATR, i
FREE

50% off. Original price: $60 Support and Resistance zones indicator for MT5 is a multi-timeframe panel and alert that finds support and resistance zones and pivot points for all timeframes of MetaTrader 5 and gives alert when price has interaction with them. Download demo version (works on GBPUSD, EURJPY and NZDUSD symbols) Read the full description of scanner parameters in the blog page . Many unique features in one indicator: Integrating support and resistance zones and pivot points in one in

If you have the opportunity to read the book " Trend Trading - A Seven-Step Approach to success " by Daryl Guppy, you will have a great deal of information about how to "read" the market. In his book Daryl show, among other things, how can we use a visual tool to measure the volatility and trend between Long and Short-term periods: The GMMA - Guppy Multiple Moving Averages .
Instead of using his original idea of having 12 Exponential Moving Averages in your chart - which could be very CPU-deman
FREE
CandleStick Patterns Indicator for MT5 — Professional Pattern Scanner Bring proven candlestick analysis into your workflow. This indicator automatically scans your chart and highlights high-quality reversal and continuation patterns, so you can react faster and with more confidence. Check the “More from author” section on the Market page to see our full suite of indicators. What it does Scans historical and live candles from a user-defined lookback range.
Detects and labels major single- and m
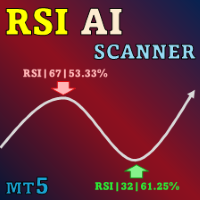
Special offer : ALL TOOLS , just $35 each! New tools will be $30 for the first week or the first 3 purchases ! Trading Tools Channel on MQL5 : Join my MQL5 channel to update the latest news from me 推出革命性的 RSI Kernel Optimized with Scanner for MT5,一款重新定义传统 RSI 分析的尖端工具,集成了强大的核密度估计(KDE)算法。这款先进的指标不仅提供实时市场趋势的见解,还包括一个仪表板,可同时扫描多个货币对和时间框架。让我们深入了解为什么这款工具是您交易工具箱中的重要补充。 See more MT4 version at: RSI Kernel Optimized MT4 with Scanner See more products at: https://www.mql5.com/en/users/ndhsfy

This indicator draws trading zones based on fractals from higher periods, which simplifies trading by levels.
This indicator draws two types of trading zones on one chart.
For example, if the current period is H1, then trading zones will be searched for by fractals from H4 and D1.
In the standard settings, fractal zones from H4 will be drawn in yellow, and from D1 - in green.
When zones are superimposed, colors are mixed at the intersection of zones. I don’t know how to fix this at the mome
FREE

Triangle Pattern Gann v3.1 - Complete Feature Documentation Core Functionality OverviewTriangle Pattern Gann v3.1 is a sophisticated MetaTrader 5 indicator that combines W.D. Gann's geometric trading principles with advanced triangle pattern recognition to deliver actionable trading signals. Primary Features1. Triangle Pattern Detection SystemAscending Triangle Recognition
Function: Automatically identifies bullish continuation patterns Detection Criteria:
Flat horizontal resistance line
FREE

The Top and Bottom Identifier Pro is the essential tool for traders who use technical analysis and price action as the basis for their decisions. In MetaTrader 5, understanding market structure—whether the price is making higher or lower highs and lower lows—is the first step to success. This indicator automates this process, eliminating subjectivity and allowing you to visualize price inflection points with immediate clarity.
FREE

Product Name: Harmonic Confluence Indicator (Basic Edition) !!!—-Leave a 5-star review and receive a free indicator version with trade levels (limited to the first 20 people only)——!!! Headline: Automated Harmonic Pattern Scanner with Supply & Demand Confluence. Description: Unlock the power of geometric market structure with the Harmonic Confluence Indicator (Basic Edition) . This powerful tool is designed to automatically scan your charts for high-probability reversal zones based on validated
FREE

Time Range Separator is a useful tool to display a separator period on your platform.
You could go in the properties of the indicator, select the desired range and that's ALL. We believe it is a useful and necessary that we wish to share with you for free all our followers. Input Values: TimeFrame = Period Separator Separator_Color = Vertical Color Line Separator_Style = Vertical Color Style Separator_Width = Vertical Line Width Good trading to all and see you soon. Same indicator for MT4 here
FREE

A combined indicator of two famous indicators: RSI , Bollinger Bands Can be used in all currency pairs Can be used in all time frames with many signals Very simple and fast to use
Description:
This indicator is made from the combination of RSI and Bollinger Bands indicators
As you can see, it shows good signals and is worth using and testing
We hope you are satisfied with this indicator
Settings: show past show candle: Displays the number of candles that the indicator calculates.
For example
FREE

VTrende Pro - MTF indicator for trend trading with a display panel for MT5 *** Videos can be translated into any language using subtitles (video language - Russian)
Although the signals of the VTrende Pro indicator can be used as signals of a full-fledged trading system,
it is recommended to use them in conjunction with the Bill Williams TS.
VTrende Pro is an extended version of the VTrende indicator. Difference between Pro version and VTrende:
- Time zones
- Signal V - signal 1-2 waves
- S
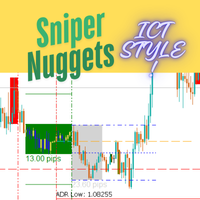
!!!!!!!! Sniper Nuggets !!!!!!!!
Sniper Nuggets is an all-in-one indicator for many things ICT style. It includes the following functionalities: Custom periods : which allow you to set custom daily period start and end times according to your taste. ADR Markers: which plots the average daily range. Worktime: which plots the various boxes on the chart for Asia range (including its high, low and midpoints, standard deviation predictions ), London open, New York open, CME open and London close.
FREE

当趋势爆发时获得警报。 该指标在价格向主导趋势方向大幅移动时发出信号。 这些信号可以作为入口点,或添加到趋势中现有位置的点。
注意:趋势跟踪的赢率很低(低于50%),但平均赢的交易回报通常比平均输的交易大3到5倍。
简单的设置 拖放到任何图表,在任何时间框架. 启用警报(可选) 你就完了! 视觉和音频警报 警报直接发送到您的手机 弹出警报发送到您的终端 多用途 股票、外汇、期权、期货 灵活 适用于任何时间范围 注意:趋势跟踪的赢率很低(低于50%),但平均赢的交易回报通常比平均输的交易大3到5倍。 注意:趋势跟踪的赢率很低(低于50%),但平均赢的交易回报通常比平均输的交易大3到5倍。 注意:趋势跟踪的赢率很低(低于50%),但平均赢的交易回报通常比平均输的交易大3到5倍。
FREE

PUMPING STATION – 您的专属“全包式”交易策略
我们为您推出PUMPING STATION —— 一款革命性的外汇指标,它将使您的交易变得更加有趣且高效。这不仅仅是一个辅助工具,而是一套完整的交易系统,具备强大的算法,帮助您开始更加稳定的交易。 购买本产品,您将免费获得: 专属设置文件:用于自动配置,实现最大化性能。 逐步视频教程:学习如何使用PUMPING STATION策略进行交易。 Pumping Utility:专为PUMPING STATION打造的半自动交易机器人,让交易变得更加方便和简单。 购买后请立即联系我,我将为您提供所有额外资源的访问权限。 PUMPING STATION如何工作: 趋势监控:能够即时识别市场趋势方向。趋势是您最好的朋友。 进场信号:图表上的箭头会提示您何时进场以及交易方向。 明确的交易目标:指标会自动识别最佳的平仓时机。 回调交易:内置的基于布林带的价格通道可检测修正结束并发出新趋势开始的信号。 效率分析:如果当前设置效果较差,系统会自动提示。只需调整PUMPING STATION,即可获得最佳性能。 交易資產:我推薦我親自測試過的
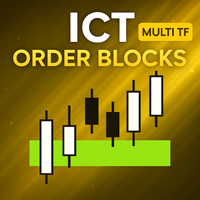
[ MT4 Version ] [ Kill Zones ] [ SMT Divergences ] How to trade using Order Blocks: Click here User Interface Performance: During testing in the strategy tester, the UI may experience lag. Rest assured, this issue is specific to the testing environment and does not affect the indicator's performance in live trading. Elevate your trading strategy with the Order Blocks ICT Multi TF indicator, a cutting-edge tool designed to enhance your trading decisions through advanced order block analysis
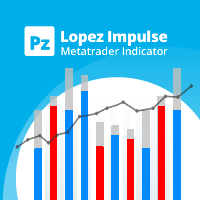
该指标同时评估波动率和价格方向性,从而发现以下事件。 [ 安装指南 | 更新指南 | 故障排除 | 常见问题 | 所有产品 ] 决定性和突然的价格变动 大锤子/流星图案 大多数市场参与者都支持强劲的突破 犹豫不决但动荡的市场形势 这是一个非常易于使用的指标... 蓝色直方图代表看涨的冲动 红色直方图代表看跌冲动 灰色直方图表示当前的波动率 移动平均线是平均波动率 该指标实施各种警报 指示器不重涂或重涂 ...具有直接的交易含义。 当看涨冲动超过平均波动率时,您可以购买 当看跌冲动超过平均波动率时,您可以卖出 该指标跟踪市场波动以及每个单个柱的看涨和看跌冲动。如果看涨的冲动超过平均波动率,那可能是做多空头的好机会。这些强劲的价格走势是可靠的,因为其他市场参与者可能会补仓。如果使用得当,此指示器功能非常强大。
作者 ArturoLópezPérez,私人投资者和投机者,软件工程师和Point Zero Trading Solutions的创始人。
FREE

This Indicator creates a heatmap based on depth of market of the current symbol or another symbol. Other symbol is useful when you trade futures market and a contract has 'mini' and 'full' split. For example, in Brazil (B3 - BMF&Bovespa), WDO and DOL are future Forex contract of BRL/USD (where 1 DOL = 5 WDO) and big banks work mostly with DOL (where liquidity is important). Please use with M1 timeframe , objects are too small to be displayed at higher timeframes (MT5 limit). The number of level

This indicator draw a line on high and low levels of X number of days. It is possible to have an alert (in the software and mobile app) for when the price breaks the high or low of the current day. Configurações: Days - past days to calculate (1 = actual day only).
Alert when reach levels - activate the alert for specific levels or both.
Push notification - enable the alert to the mobile MT5 app.
Appearance
High - high level color.
Low - low level color.
Size actual day - thickness
FREE

FVG智能区域 - 免费版
MetaTrader 5 (MT5) 公允价值缺口检测指标 您是否在寻找真正的交易工具,而不仅仅是另一个随机指标?
FVG智能区域 - 免费版通过自动检测公允价值缺口(FVG)并在图表上直接高亮显示高概率交易区域,为您提供专业的市场洞察。 专为以下交易者打造:
聪明资金概念(SMC)
ICT交易概念
价格行为
供需分析
机构交易策略 该指标帮助您专注于真正重要的事情:价格可能做出反应的区域。 主要特点: 智能区域检测:
自动检测看涨和看跌缺口
清晰、专业的视觉区域
智能过滤以消除弱相关或不相关的缺口 高级确认:
更高时间框架(HTF)汇合验证
当价格填补时智能移除无效区域
活动区域与已填补区域之间的清晰视觉区分 优化性能:
轻量快速 - 不会拖慢您的图表
兼容所有货币对和时间框架
真实交易条件下的平稳运行 完全自定义:
完全可调整的颜色和视觉风格
完美适用于外汇、黄金(XAUUSD)、指数和加密货币
适合日内交易、波段交易和剥头皮交易
FREE

凤凰财经倒计时日历(MT5)
专为MetaTrader 5设计的实时经济新闻倒计时面板。精准显示即将发生的高影响力事件倒计时,帮助交易者在波动性激增时有效管理风险。
功能定位
经济数据发布常引发意外波动、滑点及回撤。盲目参与高影响力事件可能瞬间瓦解技术布局与风险控制。
凤凰新闻倒计时日历实时抓取经济事件日程,并同步经纪商服务器时间。面板通过实时更新的倒计时显示即将发生的新闻事件,让交易者能在波动来临前做好准备、暂停或平仓。
安装
从MQL5市场下载后附加至任意图表,日历面板即刻显示且无需配置。
系统要求
MetaTrader 5 3280版或更高版本。本工具为专家顾问,需运行于图表中。采用经纪商服务器时间显示预定新闻事件,时间精度取决于经纪商数据源。
反馈与评价
若您认为本工具实用,敬请在MQL5平台给予五星好评。您的反馈将直接影响凤凰团队的后续更新、优化及新工具开发——我们致力于打造交易者真正重视的功能。
技术支持
通过MQL5私信提供终身支持,24小时内响应。
开发方:凤凰环球投资有限公司 2025 凤凰环球投资有限公司 版权所有。
FREE

这种多时间框架和多品种背离仪表板指示器会在在多个时间框架上而不是在单个背离上识别出一个或两个不同的背离时发送警报。它可以用于从 M1 到 MN 的所有时间范围。仪表板中最多可以同时显示 9 个时间范围。可以启用移动平均线、RSI 或布林带趋势过滤器以仅过滤掉最强的设置。结合您自己的规则和技术,该指标将允许您创建(或增强)您自己的强大系统。 特征 可以检测以下振荡器/指标的背离:MACD、随机指标、OsMA、RSI、CCI、Awesome、OBV、ADX、ATR、MFI、动量和加速器。 最多可以选择 9 个要使用的时间范围。 在仪表板内持续执行发散等级排序。 通过在矩形内单击,将打开一个带有相关交易品种和时间范围的新图表。 指标可以将信号写入全局变量,智能交易系统可以使用这些变量进行自动交易。比如 这个产品 。 将指标放在一张图表上就足够了,您将收到来自您选择的任何交易品种的警报。 常规/经典(趋势逆转)和隐藏(趋势延续)背离都将被考虑在内。因此,可能会出现常规背离,同时在另一个时间范围内出现隐藏背离。请参阅下面的屏幕截图 #3。该示例显示了与 2 个指标的背离,但也可能来自同一个指标。
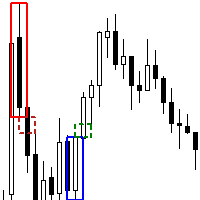
The Order Block FVG Box indicator for MetaTrader 5 is a powerful tool designed for discerning traders looking to identify and capitalize on high-probability trading opportunities. This indicator excels at pinpointing valid Order Blocks that are immediately followed by Fair Value Gaps (FVG), enhancing your trading strategy with precise visual cues. Key Features: Order Block Identification : Detects valid Order Blocks, which are significant areas where institutional buying or selling has occurred,
FREE

The " YK Find Support And Resistance " indicator is a technical analysis tool used to identify key support and resistance levels on a price chart. Its features and functions are as follows:
1. Displays support and resistance levels using arrow lines and colored bands, with resistance in red and support in green.
2. Can be adjusted to calculate and display results from a specified timeframe using the forced_tf variable. If set to 0, it will use the current timeframe of the chart.
3. Uses th
FREE
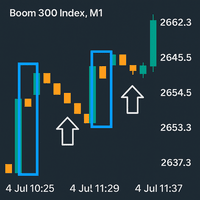
boom Spike Mitigation Zone Pro
A professional spike pattern indicator built for synthetic traders who scalp and swing Boom 500/300/1000/600/900with precision.
This indicator: Detects powerful 3-candle spike formations (Spike → Pullback → Spike) Automatically draws a clean box around the pattern Marks the entry price from the middle candle Extends a horizontal mitigation line to guide perfect sniper entries Automatically deletes & redraws the line once price touches it (mitiga
FREE

Highly configurable Macd indicator.
Features: Highly customizable alert functions (at levels, crosses, direction changes via email, push, sound, popup) Multi timeframe ability Color customization (at levels, crosses, direction changes) Linear interpolation and histogram mode options Works on strategy tester in multi timeframe mode (at weekend without ticks also) Adjustable Levels Parameters:
Stochastic RSI Timeframe: You can set the lower/higher timeframes for Stochastic RSI. Stochastic RSI
FREE
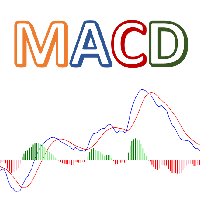
Colorful MACD is MT5 version of TradingView default MACD. This indicator has 4 different colors for MACD histogram, so it's so easy to detect fluctuations in histogram. Features: Colorful Histogram Bars Show/Hide Signal Line Show/Hide MACD Line Flexible price control Please call me if you need more input parameters or modified version of this indicator.
FREE
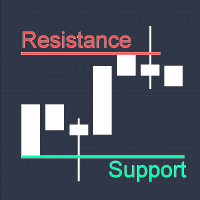
True Support Resistance Indicator: Your Ultimate Tool for Precise Trading Decisions Quick Overview It's a simple indicator that elevates your trading strategy. True Support Resistance Indicator is a powerful tool designed to identify key support/resistance levels in real-time. Experience clean visuals, instant alerts on breakouts, and dynamic updates that keep you ahead of market movements. Why Choose True Support Resistance Indicator? 1. Simplicity Meets Precision - Two clearly colored
FREE

Easily get all relevant economic events of the current day right into your chart, as markers. Filter what kind of markers do you want: by country (selected individually) and by Importance (High relevance, Medium, Low or any combination of these). Configure the visual cues to your liking. If there is more than one event set to the very same time, their Names will be stacked and you will see the messages merged with the plus (+) sign on the marker. Obviously that long or too much events on the sam
FREE

RubdFx Perfect Reversal , The reversal indicator is used to determine areas of support and resistance by Drawing an arrow with a level of supply and demand ( ReversalZones ). - You will catch more swings by reducing the period, and less swings if you increase period - Mobile, computer and email alerts available . it is not pushed by price which means the arrow will stay in one place,suitable for scalping and long term trading Also Compatible with all forex paris , BUY RULES; open a buy positio

CandleTimeAndSpreadLine – Tempo de vela e Spread em tempo real O CandleTimeAndSpreadLine é um indicador que mostra duas informações essenciais diretamente no gráfico:
(1) o tempo restante da vela atual e
(2) o spread em pontos, ambos ancorados ao preço de referência escolhido (Ask, Bid ou Mid). Ele utiliza atualização via OnTimer , garantindo que o tempo continue fluindo mesmo em momentos de baixa atividade do mercado.
Os valores são exibidos em rótulos sobrepostos ao gráfico, sem interferir na
FREE
MetaTrader市场是独有的自动交易和技术指标商店。
阅读MQL5.community用户备忘更多地了解我们提供给交易者的独特的服务:复制交易信号,自由职业者开发的自定义应用程序,通过支付系统完成的自动付款和MQL5云网络。
您错过了交易机会:
- 免费交易应用程序
- 8,000+信号可供复制
- 探索金融市场的经济新闻
注册
登录