VWAP Cloud
- Indikatoren
-
Flavio Javier Jarabeck
 We are a closed brotherhood of traders whose ultimate goal is to profit through well-studied, structured, and automated trades. As a result, we publish dozens of MT5 indicators (FREE and paid) to the global MQL5 community. 80% of our published products are high-quality free indicators so beginner
 - Version: 1.4
- Aktualisiert: 6 Juni 2020
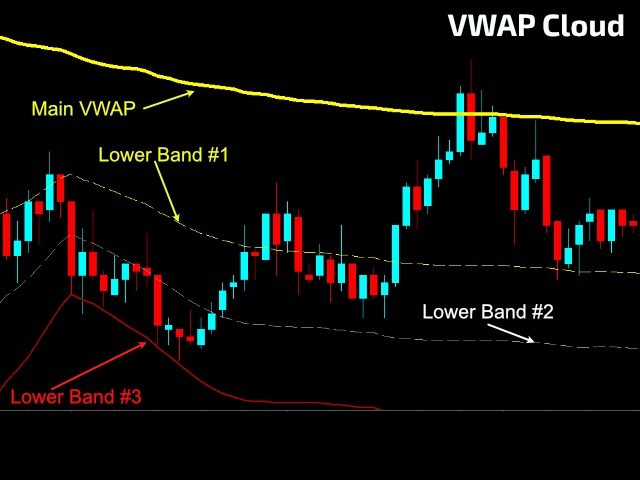
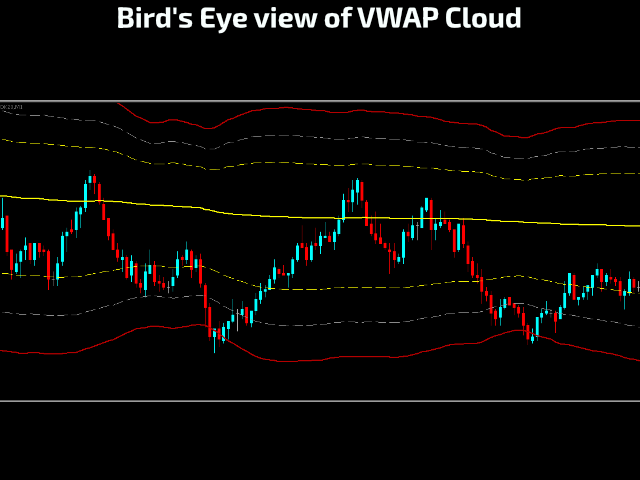
Lieben Sie VWAP? Dann werden Sie die VWAP Cloud lieben. Was ist das? Es handelt sich um den sehr bekannten VWAP-Indikator plus 3 Stufen der Standardabweichung, die auf Ihrem Chart angezeigt werden und von Ihnen vollständig konfiguriert werden können. Auf diese Weise können Sie echte Preisunterstützung und Widerstandsniveaus haben. Um mehr darüber zu erfahren, suchen Sie einfach im Internet nach "VWAP Bands" "VWAP und Standardabweichung".
EINSTELLUNGEN
- VWAP-Zeitrahmen: Stündlich, Täglich, Wöchentlich oder Monatlich.
- VWAP Berechnungsart. Die klassische Berechnung ist typisch: (H+L+C)/3
- Für die Berechnung der VWAP-Bänder zu verwendende Mittelungsperiode.
- Band #1, #2 und #3 Standardabweichung koeffizient.
- Volumenart, die für die VWAP-Berechnung verwendet wird: Echtes Volumen oder Ticks.
** Bitte beachten Sie, dass dieser Indikator, um nützlich zu sein, kalibriert werden muss. Sie müssen ihn unter Berücksichtigung des von Ihnen verwendeten Chart-Zeitrahmens, der Art des gehandelten Symbols und seines Volatilitätsbereichs kalibrieren, damit Sie die Parameter der Standardabweichung entsprechend ändern können.
Looking for more FREE VWAP-related indicators, here you go:
Wenn Ihnen dieser Indikator gefällt, bitte ich Sie nur um ein kleines Review (kein Kommentar, sondern ein REVIEW!)...
Das wird mir sehr viel bedeuten... Und auf diese Weise kann ich weiterhin Cool Stuff for Free verschenken...
Ohne Bedingungen! Niemals!
Lebe lang und in Frieden!
;)


muy bueno, pasar a tick si solo le aparece 1 linea