
Entwicklung eines Toolkits für die Price-Action-Analyse (Teil 29): Boom and Crash Interceptor EA

Inhalt
Einführung
In modernen Luftabwehrsystemen wertet ein mehrschichtiges Sensornetzwerk jedes Radarecho und jede Infrarotsignatur mit äußerster Präzision aus. Jeder Kontakt wird hinsichtlich Geschwindigkeit, Flugbahn und Signatur gemessen und anschließend mit einer umfangreichen Bedrohungsdatenbank abgeglichen. Erst wenn mehrere unabhängige Filter übereinstimmen, genehmigt das System den Start einer Abfangrakete. So werden Ressourcen geschont und gleichzeitig wird sichergestellt, dass echte Bedrohungen unverzüglich neutralisiert werden.
Der EA „Boom & Crash Interceptor“ verfolgt denselben disziplinierten Ansatz bei der Auswertung von Marktdaten. Ein gleitendes Fenster zur Messung der Kursgeschwindigkeit ermittelt, ob der aktuelle Kursimpuls das jüngste Kursverhalten übertrifft. Ein auf dem ATR basierender Multiplikator für Volatilitätssprünge bestätigt, dass die Volatilität deutlich zugenommen hat, und Trendfilter auf Basis gleitender Durchschnitte bestätigen die Marktrichtung. Optionale Pivot-Zonen- und Filter nach Handelszeiten unterdrücken Signale zusätzlich, die andernfalls in Phasen geringer Liquidität auftreten würden.
Sobald alle Ebenen bestätigt sind, zeichnet der EA einen eindeutigen „BOOM“- oder „CRASH“-Pfeil in das Chart ein, komplett mit benutzerdefinierten Farben, Abständen und CSV-Protokollierung. Dadurch wird sichergestellt, dass die Aufmerksamkeit den Chancen mit hoher Wahrscheinlichkeit vorbehalten bleibt. Auf den folgenden Seiten wird erläutert, wie die einzelnen Erkennungsschichten kalibriert werden können und wie dieses MQL5-Tool als robuste, signalgesteuerte Komponente eines umfassenderen Handelsframeworks eingesetzt werden kann.
Die Strategie verstehen
In Anlehnung an die Raketenabwehr behandelt der „Boom & Crash Interceptor EA“ Kursspitzen so, als handele es sich um ankommende Bedrohungen. Ein Flugkörper ist im militärischen Sinne jedes Projektil – gelenkt oder ungelenkt –, das mit der Absicht abgefeuert wird, ein Ziel zu treffen. Moderne Varianten sind selbstangetriebene Raketen, die mit Sprengköpfen ausgestattet sind und über Trägheits-, Radar-, Satelliten- oder optische Systeme gesteuert werden; Beispiele reichen von Interkontinentalraketen (ICBM) bis zu Marschflugkörpern und Boden-Luft-Verteidigungsraketen. Historisch betrachtet gilt selbst ein geworfener Speer oder Pfeil als Geschoss bzw. im weiteren Sinne als „missile“, da seine Flugbahn gezielt auf ein Ziel ausgerichtet ist.
Im Handel kann ein plötzlicher, starker Kursanstieg ebenso gefährlich sein: Er tritt schnell und oft unerwartet auf und kann einem unvorbereiteten Konto schweren Schaden zufügen. Hier erweist sich der Vergleich mit dem Raketenabwehrsystem als nützlich. Ein Abfangsystem ist ein Verteidigungssystem, das einen anfliegenden Sprengkopf vor dem Aufprall erkennt, verfolgt und unschädlich macht. Der Ablauf gliedert sich in vier eng miteinander verzahnte Phasen:
Erkennen und Verfolgen
- Boden-, schiffs- oder weltraumgestützte Sensoren registrieren den Abschuss eines feindlichen Geschosses.
- Die Feuerleitsoftware berechnet Flugbahn, Geschwindigkeit und den voraussichtlichen Aufschlagpunkt.
Start und Zielsteuerung
- Nach der Verifizierung startet eine Abfangrakete von einem Silo, einem Fahrzeug, einem Schiff oder einem Flugzeug.
- Kurskorrekturen erfolgen über Trägheitsnavigation, Datenverbindungen während des Fluges sowie Radar- oder Infrarot-Zielsuchsysteme in der Endphase.
Abfangmethoden
- Hit-to-Kill: Die Abfangrakete kollidiert bei Annäherungsgeschwindigkeiten von über Mach 10 direkt mit dem Sprengkopf und nutzt dabei kinetische Energie zur Zerstörung.
- Annäherungsdetonation: Eine kontrollierte Sprengung in der Nähe des Ziels zerschmettert oder lenkt dieses mit Splittern oder einer gebündelten Schockwelle ab.
- Kurzstreckensysteme (z. B. Patriot PAC-3) bekämpfen Bedrohungen in der Endphase.
- Systeme zur Abwehr in der mittleren Flugphase (z. B. SM-3, Ground-based Midcourse Defense) greifen im Weltraum an.
- Die noch im Versuchsstadium befindlichen „Boost-Phase“-Konzepte zielen auf Raketen kurz nach dem Start ab.
Diese Ebenen dienen dazu, den Schutz zu maximieren und gleichzeitig Fehlalarme zu minimieren – ein Gleichgewicht, das durch schnelle Datenfusion und strenge Bestätigungslogik erreicht wird.
Der „Boom & Crash Interceptor EA“ spiegelt diese Architektur wider. Die kontinuierliche Marktüberwachung fungiert als Radarnetz; Geschwindigkeitsschwellenwerte, ATR-Sprungfilter und die Ausrichtung anhand gleitender Durchschnitte dienen als unabhängige Bestätigungsebenen; optionale Pivot-Zonen- und Filter nach Handelszeiten bilden die Erkennung bzw. Aussonderung von Täuschkörpern nach; und erst wenn alle Kriterien übereinstimmen, „feuert“ der EA, indem er einen BOOM- oder CRASH-Pfeil anzeigt und das Ereignis protokolliert. Auf diese Weise lenkt sie die Aufmerksamkeit der Händler und das Handelskapital auf Bedrohungen, die tatsächlich eine Reaktion rechtfertigen – genauso wie eine Raketenabwehrbatterie ihre Abfangraketen für Sprengköpfe reserviert, die eine echte Gefahr darstellen.
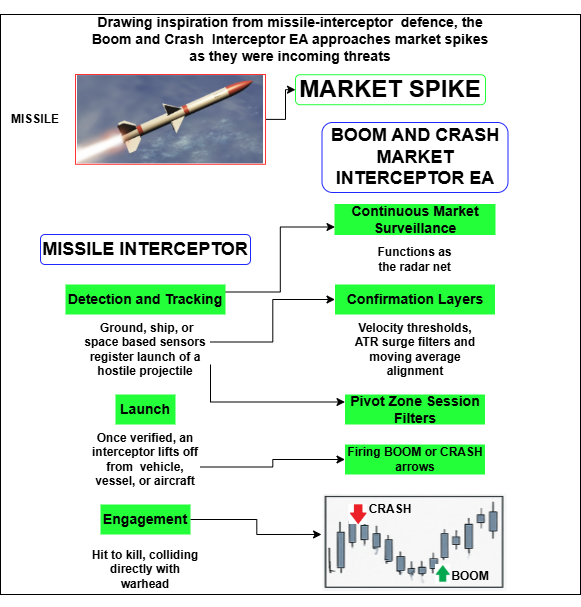
Abb. 1. Strategie
Geschwindigkeitsradar
Misst die Kursänderung über die VelocityHistoryBars und vergleicht sie mit einem historischen Perzentil-Schwellenwert – nur „ungewöhnlich starke“ Schwankungen werden berücksichtigt.
// Record current vs. old price
double priceNow = SymbolInfoDouble(_Symbol, SYMBOL_ASK);
double priceOld = velHistory[VelocityHistoryBars - 1];
double delta    = priceNow - priceOld;

// Build and sort past deltas
double d[];
ArrayResize(d, VelocityHistoryBars - 1);
for(int i = 1; i < VelocityHistoryBars; i++)
    d[i - 1] = velHistory[0] - velHistory[i];
ArraySort(d);

// Pick the (100–VelocityPctile)% threshold
int idx      = (int)MathRound((VelocityPctile / 100.0) * (ArraySize(d) - 1));
double velTh = d[ArraySize(d) - 1 - idx];

// Pass if current move exceeds threshold
bool okVel = (delta > velTh || delta < -velTh);
ATR-Sprungdetektor
Überprüft, ob ein plötzlicher Anstieg der Volatilität vorliegt, indem die aktuelle ATR mit der ATR der vorherigen Bar, multipliziert mit ATRMultiplier, verglichen wird.
// Fetch two most recent ATR values
double atrArr[2];
CopyBuffer(atrHandle, 0, 0, 2, atrArr);

// Pass if ATR_now > ATR_prev × ATRMultiplier
bool okATR = (atrArr[0] > atrArr[1] * ATRMultiplier);
Prüfung der Trendübereinstimmung
Stellt sicher, dass sich die Kursbewegung im Einklang mit dem Trend befindet, indem überprüft wird, ob der SMA bei Aufwärtsbewegungen ebenfalls steigt (bzw. bei Abwärtsbewegungen fällt).// Fetch two most recent SMA values double maArr[2]; CopyBuffer(maHandle, 0, 0, 2, maArr); // If delta>0 require SMA_now>SMA_prev; if delta<0 require SMA_now<SMA_prev bool okTrend = (delta > 0 ? maArr[0] > maArr[1] : maArr[0] < maArr[1]);
Pivot-Zone-Filter (optional)
Blockiert Signale, die zu nahe am Pivot-Punkt der vorherigen Bars liegen, und sorgt so für einen Puffer von ZoneBufferPoints.
// Compute prior bar’s pivot
double h1    = iHigh(_Symbol, MainTF, 1),
       l1    = iLow (_Symbol, MainTF, 1),
       c1    = iClose(_Symbol, MainTF, 1);
double pivot = (h1 + l1 + c1) / 3.0;

// Pass if priceNow is beyond pivot ± buffer
bool okZone = (delta > 0
               ? priceNow < pivot - ZoneBufferPoints * _Point
               : priceNow > pivot + ZoneBufferPoints * _Point);
Abschließende Logik zum „Raketenstart“
Löst nur dann einen „Boom“ (Pfeil nach oben) oder einen „Crash“ (Pfeil nach unten) aus, wenn alle Filter die Bedingung erfüllen.
// Determine direction
bool isBoom  = (delta  >  velTh);
bool isCrash = (delta  < -velTh);

// Fire only if velocity, ATR, trend, and zone all passed
bool fire    = ((isBoom || isCrash) && okVel && okATR && okTrend && okZone);

if(fire)
    GenerateSignal(isBoom, priceNow, delta, atrArr[0], MainTF);
Code-Aufschlüsselung
Im Folgenden finden Sie eine systematische Anleitung zu allen wichtigen Bereichen des Expert Advisors „Boom & Crash Interceptor“.
Kopfzeilen und Kompilierungsanweisungen
Der einleitende Kommentarblock und die darauf folgenden #property-Zeilen dienen als Visitenkarte des EAs. Sie geben den Urheberrechtsinhaber, einen Support-Link, die aktuelle Version und das Flag für die strikte Kompilierung an. Das Kompilieren im strengen Modus zwingt MetaTrader 5 dazu, die strengsten Typ- und Bereichsprüfungen durchzuführen, wodurch wir latente Fehler bereits früh im Build-Prozess erkennen können. Diese Angaben ermöglichen es dem MetaQuotes Market zudem, die Produktentwicklung nachzuverfolgen und reibungslose, versionsbasierte Updates für Endnutzer bereitzustellen.
//+------------------------------------------------------------------+
//|                                     Boom and Crash Interceptor EA|
//|                                   Copyright 2025, MetaQuotes Ltd.|
//+------------------------------------------------------------------+
#property copyright "Copyright 2025, MetaQuotes Ltd."
#property link      "https://www.mql5.com/en/users/lynnchris"
#property version   "1.0"
#property strict
Bibliotheks-Include und Handelsobjekt
Durch das Einbinden von <Trade\Trade.mqh> und durch Instanziieren eines globalen CTrade-Objekts erhält der Code Zugriff auf eine objektorientierte Kapselung für die Handels-API von MetaTrader. Auch wenn die aktuelle Version lediglich Warnmeldungen und Grafiken ausgibt, schafft das Vorhandensein dieses Objekts die Voraussetzungen für eine nahtlose Umstellung auf die Live-Auftragsabwicklung, sobald dies erforderlich ist.
#include <Trade\Trade.mqh>
CTrade trade;            // object-oriented trading wrapper
Externe Eingabeparameter – das Panel des EA
Alle Laufzeitparameter werden mit dem Schlüsselwort „input“ deklariert, was eine Optimierung im Strategy Tester oder schnelle Bearbeitungen auf der Registerkarte „Inputs“ des Charts ermöglicht. Sie lassen sich in vier logische Gruppen einteilen:
• Einstellungen zur Signalerzeugung: Zeitrahmen, Rückblickperioden für die Velocity, Parameter für ATR und den gleitenden Durchschnitt.
• Optionale Filter: Pivot-Zone-Logik und Sitzungszeiten.
• Darstellungseinstellungen: Position des Panels, Farben, Linienstärken, Pfeilversätze.
• Datenerfassung: CSV-Dateiname.
input ENUM_TIMEFRAMES MainTF            = PERIOD_CURRENT; // Signal TF
input int            VelocityHistoryBars = 96;
input double         VelocityPctile      = 120.0;          // >100 ⇒ extreme
input int            ATRPeriod           = 14;
input double         ATRMultiplier       = 1.5;
input bool           UseZoneFilter       = true;
input int            SessionStartHour    = 7;
input int            SessionEndHour      = 17;
input string         LogFilename         = "BoCrashLog.csv";
Eine interessante Nuance ist der Standardwert von 120 % für VelocityPctile. Da der Perzentil-Algorithmus am äußersten Ende der Verteilung eine Obergrenze setzt, erfordert die Festlegung eines Werts über 100 % effektiv, dass der Kurs die stärkste Bewegung übertrifft, die innerhalb des Betrachtungszeitraums beobachtet wurde, wodurch der Auslöser bewusst selektiv gestaltet wird.
Globale Variablen und Namenskonventionen
Das Array velHistory[] speichert das für die Geschwindigkeitsanalyse benötigte rollierende Fenster, während mehrere Zeichenfolgenkonstanten die Namen der GUI-Objekte zentralisieren. Die Zusammenfassung von Namen in Arrays (dashNames, hVelUp usw.) gewährleistet eine deterministische Erstellung und Löschung, verhindert verwaiste Objekte und vereinfacht spätere Refactorings.
double  velHistory[];
string  dashBG      = "DashBG";
string  dashNames[] = {"Delta","VelThr","ATR","ATRm","Trend",
                       "Pivot","Zone","Signal"};
string  hVelUp      = "VelUp";
string  hVelDown    = "VelDown";
OnInit(): Ressourcenbeschaffung und Aufbau der Benutzeroberfläche
Bei der Initialisierung passen wir die Größe des Geschwindigkeits-Arrays an, rufen Handles für den ATR-Indikator und den gleitenden Durchschnitt ab und beenden den Vorgang mit INIT_FAILED, falls ein Handle nicht verfügbar ist – ein frühzeitiger Abbruch ist einer Instabilität zur Laufzeit vorzuziehen. Der EA öffnet oder erstellt dann die CSV-Protokolldatei, schreibt einen Header, wenn die Datei neu ist, und positioniert den Dateizeiger am Ende, um weitere Datensätze anzuhängen. Abschließend erstellt die Routine ein halbtransparentes Dashboard-Rechteck, füllt es mit Textbeschriftungen und legt vorab horizontale und vertikale Hilfslinien an. Alle grafischen Elemente werden im Chart angezeigt, noch bevor der erste Markt-Tick eintrifft.
int OnInit()
  {
   ArrayResize(velHistory,VelocityHistoryBars);

   atrHandle = iATR(_Symbol, ATRTF, ATRPeriod);
   maHandle  = iMA (_Symbol, TrendTF, TrendMAPeriod, 0, MODE_SMA, PRICE_CLOSE);
   if(atrHandle==INVALID_HANDLE || maHandle==INVALID_HANDLE)
      return INIT_FAILED;

   logHandle = FileOpen(LogFilename, FILE_READ|FILE_WRITE|FILE_CSV|FILE_ANSI);
   if(logHandle>=0 && FileSize(logHandle)==0)
         FileWrite(logHandle,"DateTime,Type,Velocity,ATR,Price");

   // dashboard background
   ObjectCreate(0,dashBG,OBJ_RECTANGLE_LABEL,0,0,0);
   ObjectSetInteger(0,dashBG,OBJPROP_XSIZE,200);
   ObjectSetInteger(0,dashBG,OBJPROP_YSIZE,140);

   // dashboard labels
   for(int i=0;i<ArraySize(dashNames);i++)
     {
      string name="Dash_"+dashNames[i];
      ObjectCreate(0,name,OBJ_LABEL,0,0,0);
      ObjectSetString(0,name,OBJPROP_TEXT,dashNames[i]+": ?");
     }

   // reference lines
   ObjectCreate(0,hVelUp ,OBJ_HLINE,0,0,0);
   ObjectCreate(0,hVelDown,OBJ_HLINE,0,0,0);
   return INIT_SUCCEEDED;
  }
OnDeinit(): ordnungsgemäßes Herunterfahren
Beim Entfernen gibt die EA die Indikator-Handles frei, schließt das Datei-Handle und löscht alle grafischen Objekte, auf die in den Namens-Arrays verwiesen wird. Diese Symmetrie zwischen Erstellung und Löschung ist entscheidend, um die Objektliste des Terminals übersichtlich zu halten und Betriebssystemressourcen zu schonen.
void OnDeinit(const int reason)
  {
   if(atrHandle!=INVALID_HANDLE) IndicatorRelease(atrHandle);
   if(maHandle !=INVALID_HANDLE) IndicatorRelease(maHandle);
   if(logHandle>=0)              FileClose(logHandle);

   string objs[]={dashBG,hVelUp,hVelDown};
   for(int i=0;i<ArraySize(objs);i++) ObjectDelete(0,objs[i]);
   for(int i=0;i<ArraySize(dashNames);i++)
      ObjectDelete(0,"Dash_"+dashNames[i]);
  }
OnTick(): Echtzeit-Entscheidungsengine
Die Routine überprüft zunächst, ob eine neue Bar in MainTF geschlossen wurde. Andernfalls kehrt die Funktion sofort zurück, wodurch unnötige Rechenaufwände vermieden werden. Wird ein Barübergang erkannt, berücksichtigt der Code den optionalen Filter nach Handelszeiten und stellt so sicher, dass Operationen nur innerhalb des vom Händler definierten Zeitfensters stattfinden.
void OnTick()
  {
   // process only on completed bar
   int cur=iBars(_Symbol,MainTF)-1;
   if(cur==lastBar) return;
   lastBar=cur;

   // optional session filter
   MqlDateTime now; TimeToStruct(TimeCurrent(),now);
   if(UseSessionFilter && (now.hour<SessionStartHour || now.hour>SessionEndHour))
      return;

   // velocity calculation
   double priceNow = SymbolInfoDouble(_Symbol,SYMBOL_ASK);
   ArrayMove(velHistory,1,0,VelocityHistoryBars-1); // shift right
   velHistory[0]=priceNow;
   double delta  = priceNow-velHistory[VelocityHistoryBars-1];
   double velTh  = ComputeVelocityPercentile(velHistory,VelocityPctile);
   bool   okVel  = (delta>velTh || delta<-velTh);

   // ATR, MA, pivot-zone checks ...
   /* …remaining signal logic… */

   if(fire) GenerateSignal(isBoom,priceNow,delta,atrArr[0],MainTF);
  }
Der aktuelle Briefkurs (Ask) wird dann an den Anfang von velHistory eingefügt, wodurch ältere Einträge um einen Index nach unten verschoben werden. Wir berechnen Delta, also die Differenz zwischen dem neuesten und dem ältesten Kurs im Zeitfenster, und ermitteln mithilfe von ComputeVelocityPercentile() einen Perzentil-Schwellenwert. Eine Geschwindigkeitsbedingung ist erfüllt, wenn Delta den oberen oder unteren Schwellenwert überschreitet.
ATR- und gleitende Durchschnittsfilter werden auf potenziell unterschiedlichen, kürzeren Zeitrahmen bewertet, um kurzfristige Volatilitätsanstiege zu erfassen und die Marktrichtung zu bestätigen. Ist der Pivot-Zone-Filter aktiviert, berechnet er einen klassischen H+L+C-Pivot auf Basis der vorherigen Bar und beschränkt die Signale auf Kursbewegungen, die sich noch auf der „falschen“ Seite dieses Pivots plus eines konfigurierbaren Puffers befinden, und zielt damit auf eine Rückkehr zum Mittelwert ab.
Das Dashboard wird mit den Rohdaten der Diagnosewerte aktualisiert; anhand der Farben lässt sich sofort erkennen, ob die einzelnen Kriterien erfüllt sind. Gleichzeitig werden die horizontalen Geschwindigkeits- und Pivot-Linien sowie die vertikale Zeitachse neu positioniert, damit der visuelle Kontext des Charts mit der neuesten Bar synchron bleibt. Ein Signal gilt nur dann als gültig, wenn alle vier Kriterien – Geschwindigkeitsspitze, ATR-Sprung, Trendübereinstimmung und Zonenfreigabe – den Wert „wahr“ zurückgeben.
Hilfsfunktion: UpdateLabel()
Diese kleine Routine bündelt die Aktualisierungen von Text und Farben im Dashboard. Indem wir die Formatierung an einer Stelle bündeln, sorgen wir für ein einheitliches Erscheinungsbild und erleichtern globale ästhetische Anpassungen.
void UpdateLabel(int idx,string txt,bool pass)
  {
   string name="Dash_"+dashNames[idx];
   ObjectSetString (0,name,OBJPROP_TEXT ,txt);
   ObjectSetInteger(0,name,OBJPROP_COLOR, pass ? clrLime : clrRed);
  }
Hilfsfunktion: ComputeVelocityPercentile()
Der Algorithmus wandelt die gespeicherte Kursreihe in eine Liste vorzeichenbehafteter Delta-Werte um, sortiert diese Liste und ordnet sie entsprechend dem vom Benutzer angegebenen Perzentil. Durch die Auswahl am äußersten Ende des sortierten Arrays kann die Methode das Vorzeichen der Bewegung (Aufschwung oder Einbruch) ohne zusätzliche Logik berücksichtigen. Perzentilwerte über 100 % werden auf den Maximalwert gesetzt, wodurch ein Schwellenwert für das „Extremwert innerhalb des Fensters“ festgelegt wird.
double ComputeVelocityPercentile(double &hist[],double pct)
  {
   int n=ArraySize(hist);
   if(n<2) return 0;
   double d[]; ArrayResize(d,n-1);
   for(int i=1;i<n;i++) d[i-1]=hist[0]-hist[i];
   ArraySort(d);                        // ascending
   int idx=(int)MathRound((pct/100.0)*(ArraySize(d)-1));
   return d[ArraySize(d)-1-idx];        // mirror to get extreme with sign
  }
Hilfsfunktion: SetHLine()
Indem diese Methode die Eigenschaften bestehender Objekte anpasst, anstatt Linien neu zu zeichnen, vermeidet sie Bildflackern und grafische Verzögerungen und sorgt so auch auf weniger leistungsfähiger Hardware für ein flüssiges Benutzererlebnis.
void SetHLine(string name,double price,color clr)
  {
   ObjectSetDouble (0,name,OBJPROP_PRICE, price);
   ObjectSetInteger(0,name,OBJPROP_COLOR, clr);
   ObjectSetInteger(0,name,OBJPROP_WIDTH, 1);
  }
Hilfsfunktion: GenerateSignal()
Wenn alle Filter die Bedingungen erfüllen, zeichnet diese Routine einen farbcodierten Wingdings-Pfeil in einem bestimmten Abstand vom Tiefst- (Boom) oder Höchststand (Crash) der Bar, schreibt einen umfassenden Eintrag in das CSV-Protokoll (Zeitstempel, Typ, Delta, ATR, Kurs) und löst einen akustischen Alarm aus. Wenn CTrade weiterhin im Anwendungsbereich bleibt, bedeutet dies, dass die Umwandlung dieser visuellen Markierungen in Live-Aufträge lediglich den Aufruf von trade.Buy() oder trade.Sell() an dieser Stelle erfordert.
void GenerateSignal(bool isBoom,double price,double delta,
                    double atr,ENUM_TIMEFRAMES tf)
  {
   int    code = isBoom ? 233 : 234;
   double y    = isBoom ? iLow(_Symbol,tf,0)-ArrowOffsetPips*_Point
                        : iHigh(_Symbol,tf,0)+ArrowOffsetPips*_Point;
   color  clr  = isBoom ? BoomArrowColor : CrashArrowColor;
   string tag  = (isBoom?"BOOM":"CRASH")+"_"+
                 TimeToString(TimeCurrent(),TIME_SECONDS);

   datetime t0 = iTime(_Symbol,tf,0);
   ObjectCreate(0,tag,OBJ_ARROW,0,t0,y);
   ObjectSetInteger(0,tag,OBJPROP_ARROWCODE,code);
   ObjectSetInteger(0,tag,OBJPROP_COLOR,clr);

   if(logHandle>=0)
      FileWrite(logHandle,TimeToString(TimeCurrent(),TIME_DATE|TIME_SECONDS),
                isBoom?"BOOM":"CRASH",DoubleToString(delta,2),
                DoubleToString(atr,_Digits),DoubleToString(price,_Digits));

   Alert((isBoom?"BOOM":"CRASH")+" signal @"+
         DoubleToString(price,_Digits));
  }
Strategische Ausrichtung und Erweiterungsmöglichkeiten.
// Inside GenerateSignal(), after drawing the arrow:
double lot   = 0.02;                        // example risk sizing
double sl    = isBoom ? price - atr*2 : price + atr*2;
double tp    = pivot;                       // mean-reversion target

if(AutoTrade)                               // user-controlled switch
  {
   if(isBoom) trade.Buy(lot,_Symbol,price,sl,tp,"Boom-auto");
   else       trade.Sell(lot,_Symbol,price,sl,tp,"Crash-auto");
  }
Konzeptionell sucht der EA nach explosiven Beschleunigungen innerhalb einer einzelnen Bar, die inmitten einer neuen Volatilitätsausweitung auftreten, aber dennoch auf eine Mean-Reversion zum vorherigen Pivot-Punkt hindeuten. Ein solches Verhalten ist typisch für Boom-and-Crash-Indizes, bei denen es häufig zu einem Rückgang nach plötzlichen Kurssprüngen kommt. Derzeit generiert der Code informative Warnmeldungen; die Integration einer automatisierten Ausführung würde erfordern, dass Logik für die Positionsgröße, Stop-Loss (zum Beispiel die entgegengesetzte Velocity-Linie) und Take-Profit (vielleicht der Pivot oder die Hälfte des Puffers) hinzugefügt wird. Schließlich ist die lineare Array-Verschiebung innerhalb von velHistory für das standardmäßige 96-Bar-Fenster akzeptabel, könnte jedoch durch einen Ringpuffer ersetzt werden, sollte der Benutzer deutlich längere Verlaufsdaten wählen.
Backtests und Ergebnisse
Bevor wir unseren Interceptor live schalten, sollten wir zunächst einen umfassenden Backtest auf einem Demokonto durchführen, um die Einstellungen zu optimieren:
1. Kompilieren und Laden
Nachdem Ihr EA im MetaEditor fehlerfrei kompiliert wurde, wechseln Sie zu MetaTrader.
2. Öffnen Sie den Strategy Tester
Klicken Sie in der Symbolleiste von MetaTrader auf das Symbol „Strategy Tester“. Wählen Sie Ihren „Boom & Crash Interceptor“-EA aus der Expertenliste aus.
3. Konfigurieren Sie Ihren Test
- Symbol & Zeitraum: Wählen Sie genau das Finanzinstrument und den MainTF aus, mit denen Sie im Live-Handel handeln werden.
- Period: Wählen Sie einen Zeitraum, der unterschiedliche Marktbedingungen abdeckt (ruhig, im Trend, volatil).
- Eingabeparameter: Passen Sie VelocityHistoryBars, VelocityPctile, ATRMultiplier, TrendMAPeriod, ZoneBufferPoints usw. an, um zu sehen, wie sich diese Parameter auf die Signalhäufigkeit und -genauigkeit auswirken.
- Ausführung: Verwenden Sie den Modus „Every Tick“, um die genauesten Ergebnisse zu erhalten.
4. Ausführen und überprüfen
Klicken Sie auf „Start“. Sobald der Backtest abgeschlossen ist, überprüfen Sie die Equity-Kurve, die Liste der Signale sowie etwaige fehlgeschlagene oder verspätete Erkennungen. Beachten Sie, wo sich Signale gehäuft haben oder echte Spitzen übersehen wurden.
5. Verfeinern & Wiederholen
Passen Sie jeweils nur einen oder zwei Parameter an, beispielsweise indem Sie den Velocity-Perzentilwert verringern oder den Pivot-Puffer vergrößern, und führen Sie anschließend einen erneuten Test durch. Wiederholen Sie den Vorgang, bis Ihre Demo-Ergebnisse klare, wiederholbare Boom-/Crash-Signale mit akzeptablem Drawdown zeigen.
Sobald Sie sich nach mehreren Demoläufen von der Leistungsfähigkeit des EAs überzeugt haben, können Sie ihn unter kontrollierten Risikobedingungen in einem Live-Konto einsetzen.
Im Folgenden stelle ich die Backtest-Ergebnisse für den Boom & Crash Interceptor EA vor; ich fand die Ergebnisse besonders aufschlussreich.
Abb. 2. Boom 900 – Backtesting
Im Boom-900-Backtest hat unser EA, wie erwartet, jedes Boom- und Crash-Signal im Protokoll erfasst. Die Pivot-Linie wird blau und die Geschwindigkeitsschwelle orange dargestellt, was eine klare visuelle Orientierung bietet. Außerdem sehen Sie grüne Aufwärtspfeile, die jeden BOOM markieren, und rote Abwärtspfeile, die jeden CRASH markieren. Im Folgenden habe ich ein Standbild eingefügt, damit Sie genau sehen können, was im GIF zu sehen war.
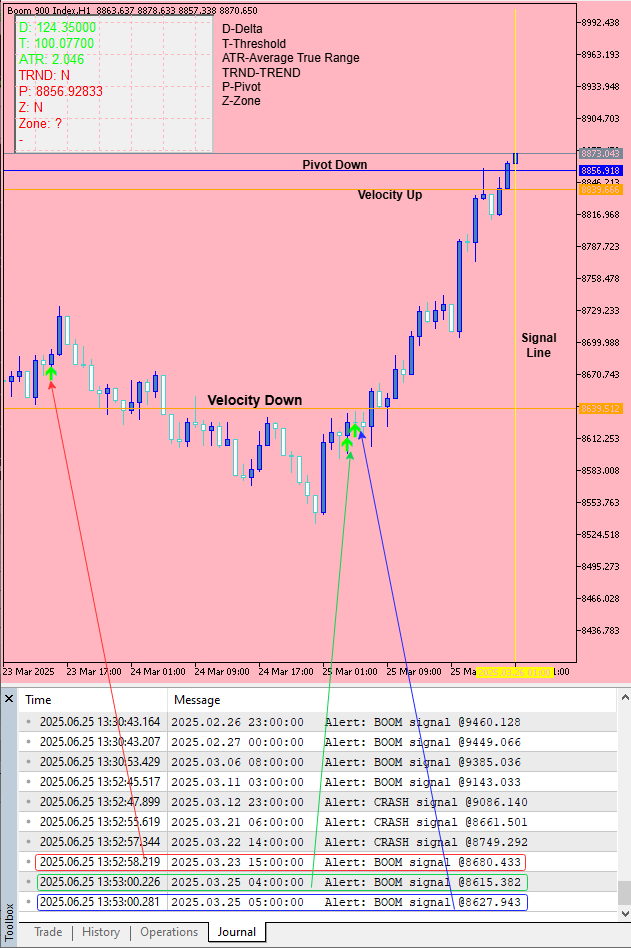
Abb. 3. Backtesting-Ergebnisse
Schlussfolgerung
Wir haben den „Boom & Crash Interceptor“-EA entwickelt und einem strengen Backtest unterzogen – und die Ergebnisse sprechen für sich. Das System erfasst extreme Kursbewegungen, indem es die Preisgeschwindigkeit, den ATR-Sprung, die Trendausrichtung und Durchbrüche von Pivot-Zonen verfolgt, und zeichnet anschließend nur die deutlichsten „Boom“- (grün) oder „Crash“-Pfeile (rot) ein. Unser Testlauf mit dem Boom 900 hat jedes Signal aufgezeichnet, Drehpunkt- und Geschwindigkeitslinien in Blau und Orange dargestellt und entsprach dem im GIF gezeigten Verlauf perfekt.
Dennoch könnten einige Signale von einer zusätzlichen Filterung profitieren. Betrachten Sie diesen EA als Ihr taktisches Radar und nicht als eigenständiges Ausführungssystem. Ergänzen Sie stets eigene zusätzliche Filter nach Tageszeit, Musterbildung oder fundamentalen Faktoren, bevor Sie den Auslöser betätigen. Und wenn Sie noch weniger Fehlalarme haben möchten, wechseln Sie zu größeren Zeitrahmen (H1, H4 oder Tageschart), um die Schwankungen auszugleichen.
Dank diszipliniertem Backtesting, intelligenter Filterung und einer kontrollierten Live-Einführung wird der „Boom & Crash Interceptor“ EA zu einem echten Abfanginstrument plötzlicher Kursspitzen, das Ihnen einen Vorsprung verschafft, anstatt dass Sie jeder Bewegung hinterherhinken.
Übersetzt aus dem Englischen von MetaQuotes Ltd.
Originalartikel: https://www.mql5.com/en/articles/18616
Warnung: Alle Rechte sind von MetaQuotes Ltd. vorbehalten. Kopieren oder Vervielfältigen untersagt.
Dieser Artikel wurde von einem Nutzer der Website verfasst und gibt dessen persönliche Meinung wieder. MetaQuotes Ltd übernimmt keine Verantwortung für die Richtigkeit der dargestellten Informationen oder für Folgen, die sich aus der Anwendung der beschriebenen Lösungen, Strategien oder Empfehlungen ergeben.

- Freie Handelsapplikationen
- Über 8.000 Signale zum Kopieren
- Wirtschaftsnachrichten für die Lage an den Finanzmärkte
Sie stimmen der Website-Richtlinie und den Nutzungsbedingungen zu.
Hallo,
Kann ich das bitte herunterladen? Ich finde keine Links.
Viele Grüße
Harry
Es gibt ein Problem mit dem Geschwindigkeitssensor.
ArraySort(d);In Kaufrichtung funktioniert er gut,
bei negativen Kursbewegungen ist die Sortierung jedoch fehlerhaft.
Du musst dies separat vornehmen oder die Indexformel ändern (bei Verkäufen die Sortierung negativer Werte!!!)
if(delta>0)
{
for(int i = 1; i < VelocityHistoryBars; i++)
    d[i - 1] = velHistory[0] - velHistory[i];

ArraySort(d);
}

if(delta<0)
{
for(int i = 1; i < VelocityHistoryBars; i++)
    d[i - 1] = velHistory[i] - velHistory[0];

ArraySort(d);
}

int idx= (int)MathRound((VelocityPctile / 100.0) * (ArraySize(d) - 1));
double velTh = d[ArraySize(d) - 1 - idx];

bool okVel = MathAbs(delta) > velTh;
Ich habe einige Varianten zur Pivot-Ausrichtung.
Ich weiß nicht, ob das besser ist.
(Ausgehend von dem Kurs, bei dem der Pivot nach oben zeigt, erwarten wir eine Aufwärtsbewegung ...)
bool okZone = false;
if((delta > 0 ) && (priceNow > pivot)) okZone = true;
if((delta < 0 ) && (priceNow < pivot)) okZone = true;
bool okZone = false; if((delta > 0 ) && (priceNow > pivot) && (priceNow < ( pivot + ZONE_Points * _Point))) okZone = true; if((delta < 0 ) && (priceNow < pivot) && (priceNow > ( pivot - ZONE_Points * _Point))) okZone = true;Gute Bewertung der Balken in Richtung des Geschwindigkeitsdetektors:
Wir können die grünen/roten Balken prozentual filtern.
(Die negative Richtung wurde in positive Werte umgewandelt)
0,8 = 80 % der Balken waren in der richtigen Richtung.
   double goodBars = 1;

   for(int i=ArraySize(d) - 1; i>=0; i--)
         if(d[i] < 0) goodBars=1 - (i+1.0)/ArraySize(d);