MPA Trend Dashboard
- 指标
- 版本: 1.1
- 激活: 10

MPA Trend Dashboard — Multi-Symbol Signal Indicator for MetaTrader 5
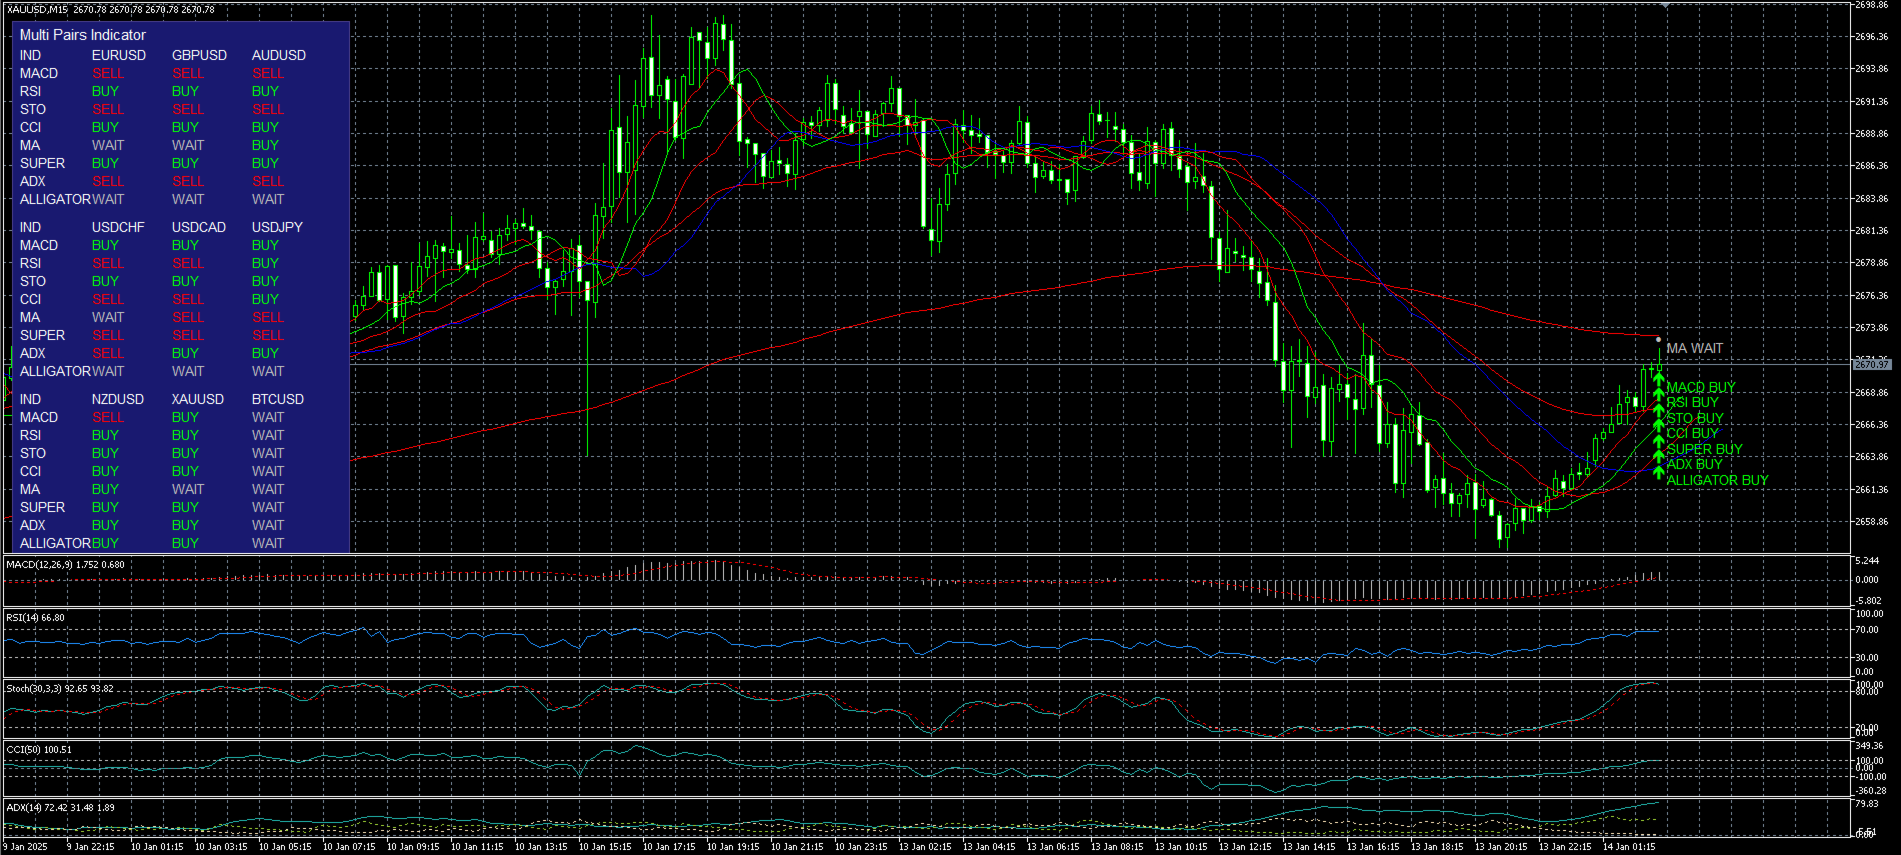
MPA Trend Dashboard is a multi-symbol analytical indicator for MetaTrader 5 designed to provide a fast overview of market direction across several trading instruments at once. The indicator displays BUY, SELL, or WAIT signals in a compact dashboard directly on the chart and uses a set of popular technical indicators to evaluate the current market condition.
It is suitable for traders who need to monitor several currency pairs, metals, crypto symbols, indices, or CFDs without constantly switching between charts.
User Guide
Main Concept
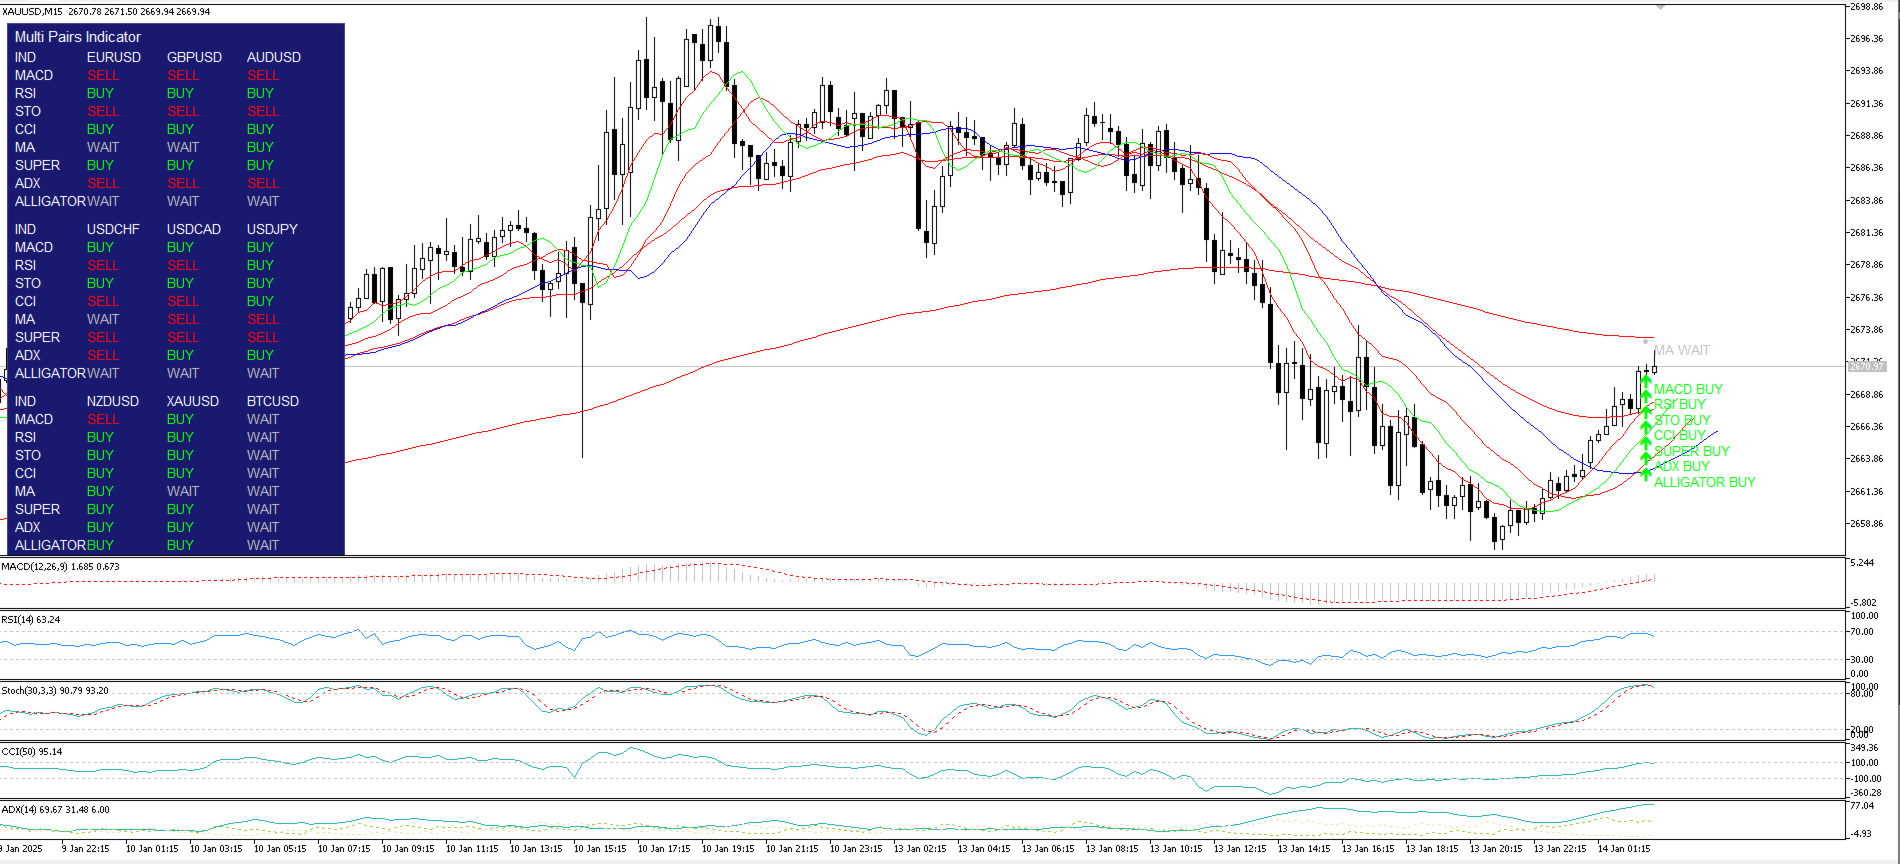
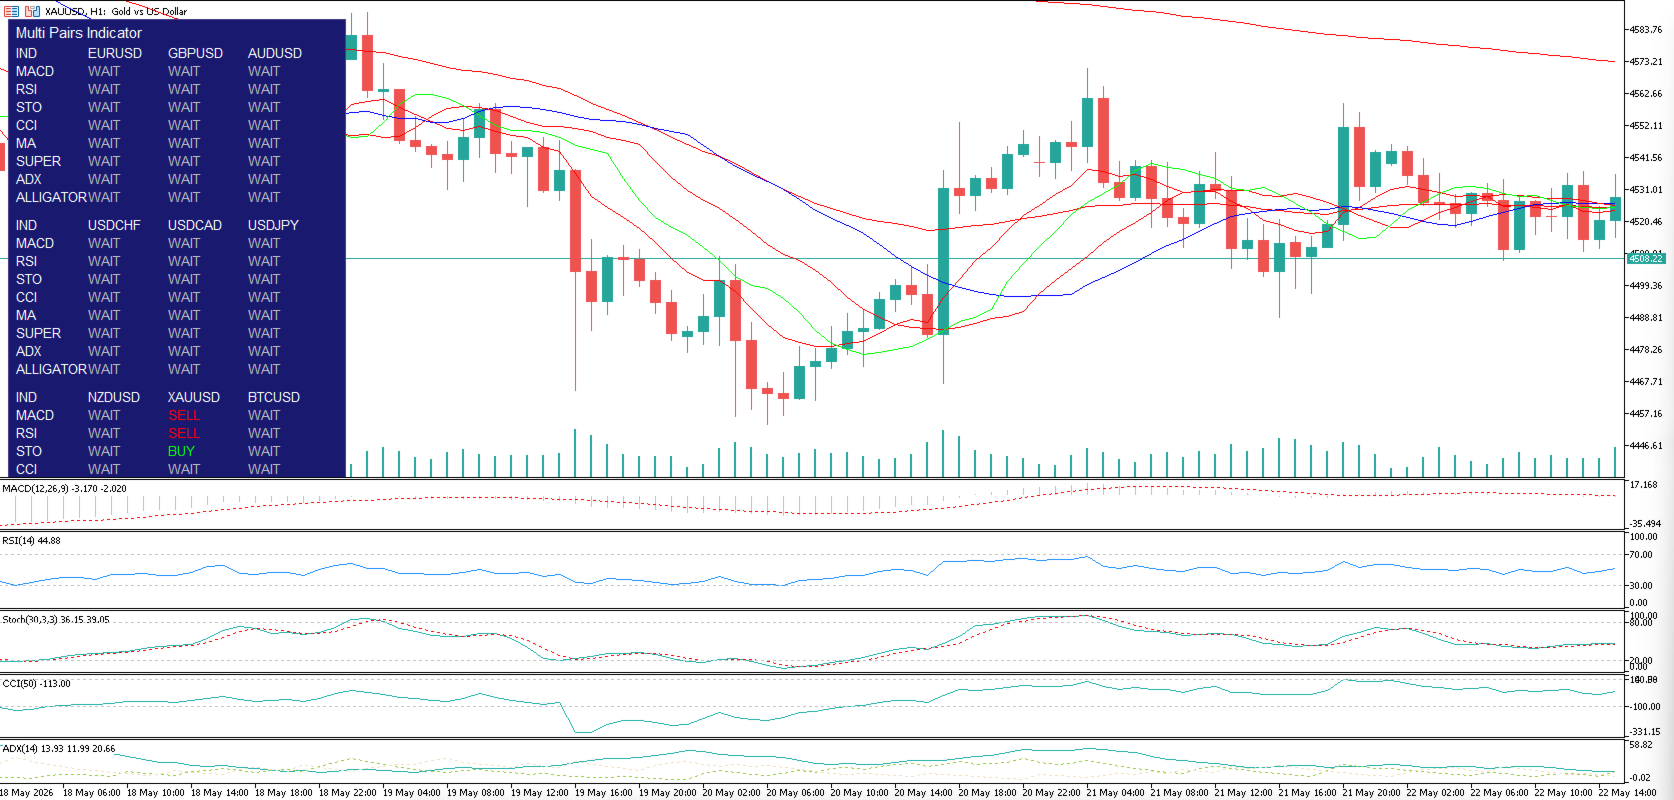
MPA Trend Dashboard analyzes selected symbols and shows the signal direction for each instrument. For every symbol, the indicator calculates signals using several technical tools:
MACD
RSI
Stochastic
CCI
EMA Trend
SuperTrend
ADX
Bill Williams Alligator
Each signal is shown as:
BUY — bullish signal
SELL — bearish signal
WAIT — neutral condition or no clear confirmation
This allows traders to quickly identify instruments where several indicators point in the same direction and avoid markets with mixed or uncertain conditions.
Key Features
Multi-symbol signal dashboard
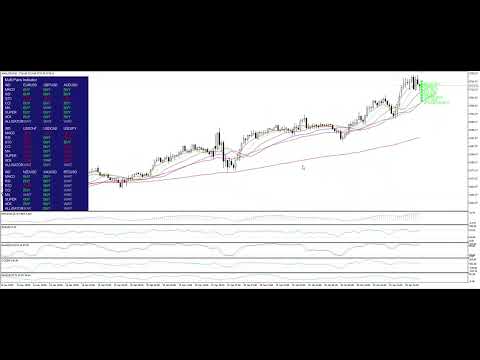
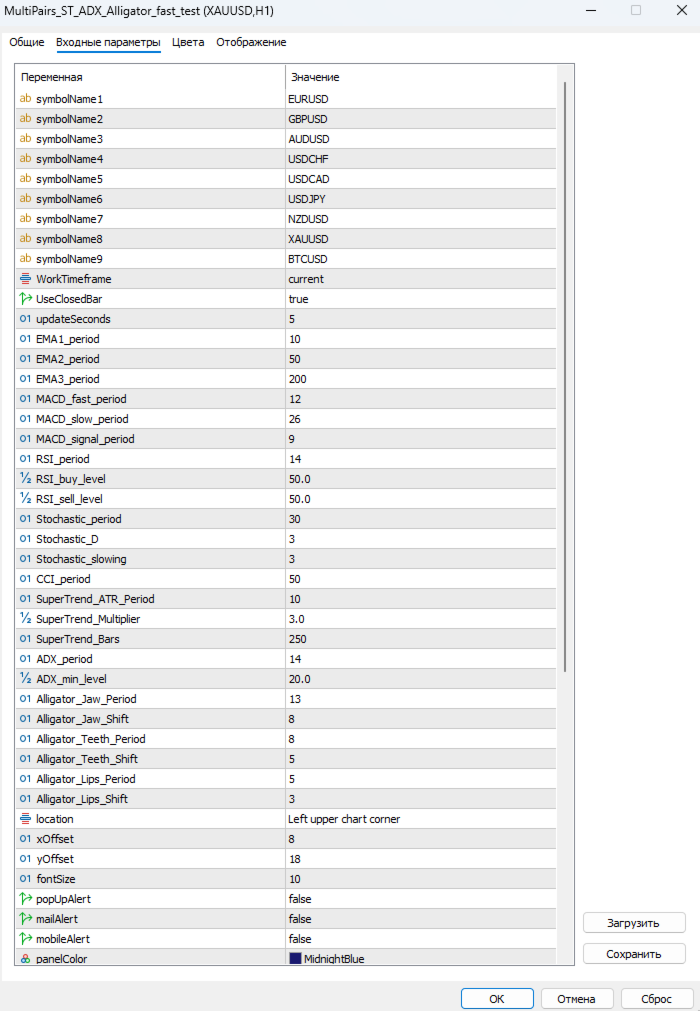
The indicator can display up to 9 trading instruments at the same time. By default, it includes EURUSD, GBPUSD, AUDUSD, USDCHF, USDCAD, USDJPY, NZDUSD, XAUUSD, and BTCUSD. The symbol list can be changed in the input settings.
Multiple indicator analysis
Each symbol is analyzed using eight technical indicators. This helps evaluate the market based on a combination of trend, momentum, and oscillator conditions.
Any timeframe support
The indicator can calculate signals on the current chart timeframe or on a selected working timeframe.
Chart visualization
The indicator can display visual elements on the current chart, including EMA lines, SuperTrend, Alligator, and BUY / SELL / WAIT signal markers.
Separate indicator windows
When visualization is enabled, MACD, RSI, Stochastic, CCI, and ADX can be displayed in separate chart subwindows.
Flexible settings
Users can adjust indicator periods, RSI levels, ADX minimum level, SuperTrend settings, Alligator settings, dashboard colors, and font size.
Alerts
The indicator supports pop-up, email, and mobile notifications when signals change.
Strategy Tester optimization
FastTestingMode is included to disable unnecessary graphical objects and visual calculations in the Strategy Tester, helping improve testing speed.
Included Indicators
MACD
Used to identify momentum direction. If the MACD main line is above the signal line, the indicator shows BUY. If the main line is below the signal line, it shows SELL.
RSI
Used to measure market strength. A value above the selected buy level is considered bullish, while a value below the selected sell level is considered bearish.
Stochastic
Used to compare the %K and %D lines. If %K is above %D, the signal is BUY. If %K is below %D, the signal is SELL.
CCI
Used to measure price deviation from its average. Values above zero generate BUY, while values below zero generate SELL.
EMA Trend
Uses three exponential moving averages to define trend structure. If the fast EMA is above the middle EMA and the middle EMA is above the slow EMA, the signal is BUY. If the fast EMA is below the middle EMA and the middle EMA is below the slow EMA, the signal is SELL.
SuperTrend
Uses ATR and a multiplier to define trend direction. BUY appears during an upward SuperTrend direction, while SELL appears during a downward SuperTrend direction.
ADX
Used to measure trend strength. The signal is considered only when ADX is above the minimum level. If +DI is above -DI, the signal is BUY. If -DI is above +DI, the signal is SELL.
Bill Williams Alligator
Uses the classic Jaw, Teeth, and Lips lines. If the lines are in bullish order and price is above the Lips line, the signal is BUY. If the lines are in bearish order and price is below the Lips line, the signal is SELL.
What It Can Be Used For
Quick market overview across multiple instruments
Finding symbols with aligned signals
Filtering trade ideas before entry
Confirming trend direction
Visual market monitoring from one chart
Forex, metals, indices, crypto, and CFD analysis, depending on broker symbol availability
Main Inputs
symbolName1–symbolName9
Trading symbols to analyze.
WorkTimeframe
The timeframe used for signal calculations. It can be set to the current chart timeframe.
UseClosedBar
If enabled, signals are calculated using the last closed candle. This helps reduce false signal changes during the currently forming candle.
updateSeconds
Dashboard update interval.
EMA1_period, EMA2_period, EMA3_period
Periods of the three EMAs used for trend analysis.
MACD_fast_period, MACD_slow_period, MACD_signal_period
MACD parameters.
RSI_period, RSI_buy_level, RSI_sell_level
RSI period and signal levels.
Stochastic_period, Stochastic_D, Stochastic_slowing
Stochastic parameters.
CCI_period
CCI period.
SuperTrend_ATR_Period, SuperTrend_Multiplier, SuperTrend_Bars
SuperTrend parameters.
ADX_period, ADX_min_level
ADX period and minimum trend strength level.
Alligator_Jaw_Period, Alligator_Jaw_Shift, Alligator_Teeth_Period, Alligator_Teeth_Shift, Alligator_Lips_Period, Alligator_Lips_Shift
Bill Williams Alligator parameters.
ShowDashboard
Turns the signal dashboard on or off.
VisualizeAllIndicators
Turns chart visualization on or off.
ShowSignalMarkersOnChart
Displays BUY / SELL / WAIT signal markers on the chart.
FastTestingMode
Improves performance in the Strategy Tester by disabling graphical objects and extra visual calculations.
Usage Recommendations
For more stable signals, it is recommended to keep UseClosedBar enabled. In this mode, the indicator analyzes the last closed candle instead of the currently forming one.
MPA Trend Dashboard is best used as a market direction filter and confirmation tool, not as a standalone trading system. The combination of several indicators helps evaluate market conditions faster, but the final trading decision should always remain with the trader.
For scalping, lower timeframes such as M5 or M15 may be used. For intraday trading, M15, M30, and H1 are suitable. For slower analysis, H4 and D1 can be used.
Advantages
One chart for monitoring multiple instruments
Combination of trend, momentum, and oscillator signals
Simple BUY / SELL / WAIT display
Flexible input settings
Optional visualization on the chart
Performance mode for faster testing
Alert support
Suitable for manual trading and market monitoring
Important Notice
MPA Trend Dashboard is not an Expert Advisor and does not open or manage trades automatically. It is an analytical indicator designed to display market signals and support decision-making. It does not guarantee profit and cannot eliminate trading risk. Testing on a demo account is recommended before using it on a live account.