
市场轮廓指标 (第二部分):基于画布的优化与渲染

内容
引言
在上一篇文章中,我们深入探讨了市场轮廓指标。事实证明,使用普通的图形对象来构建市场轮廓图会消耗相当多的资源。对于从K线低点到高点的每个价格点,都会用矩形图形对象来填充,其数量等于当天内达到该价格水平的K线数量。每个轮廓图都是如此——它们都包含大量的图形对象,并且所有这些对象都会在绘制轮廓图的每一天被创建和绘制。当一个指标创建了成千上万个图形对象时,这可能会导致在处理其他图形对象和重绘图表时出现严重的性能下降。
在 M30 图表上启动该指标,并仅构建三天的市场轮廓:
结果创建了 4697 个矩形图形对象:
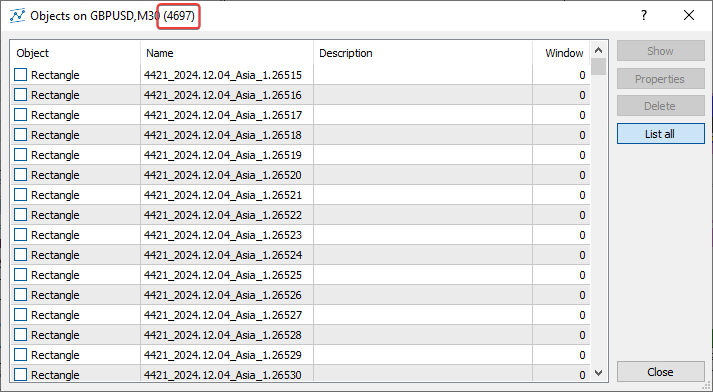
这是一种非常不理想的资源使用方式。如果我们在设置中增加显示的天数,那么为每个显示日在图表上绘制市场轮廓图所创建的对象数量将急剧增加。
但在这里,我们只是使用图形对象(即矩形)来绘制图表。轮廓直方图的一个短线段就是一个图形对象。这意味着我们可以不直接在图表上绘制,而是只在一个图形对象——即画布上进行绘制,而这个画布本身又根据所需的坐标位于图表之上。这样一来,我们一天就只需要一个(!)图形对象。而三天就只需要三个对象,而不是 4697 个!这是一个巨大的差异!这可以借助CCanvas类来实现,该类用于简化自定义图像的渲染,它是客户端终端标准库的一部分。
这个在画布上渲染轮廓直方图的市场轮廓指标版本,可以在终端的 \MQL5\Indicators\Free Indicators\ 目录下找到,文件名为 MarketProfile Canvas.mq5。在研究代码时,我们可以看到,与第一个版本(MarketProfile.mq5)不同,这里的图形输出是在 CCanvas 类的对象上进行的。指标的逻辑保持不变,我们已经在第一篇文章的“结构与原理”部分讨论过它。渲染是通过 CMarketProfile 类在 CCanvas 上绘图来完成的。
其操作逻辑极其简单:
- 按指定的天数进行循环,
- 在循环中为当前天创建或获取一个 CMarketProfile 类的对象,
- 在与循环中当前天相对应的画布上绘制或重绘当天的轮廓。
绘制轮廓图的主要工作是在 CMarketProfile 类内部完成的。让我们来看看这个类的结构和运作方式。
CMarketProfile类
打开 \MQL5\Indicators\Free Indicators\MarketProfile Canvas.mq5 文件,并在其中找到 CMarketProfile 类的代码。让我们看看里面有什么,并讨论其各自的用途:
//+------------------------------------------------------------------+
//| Class to store and draw Market Profile for the daily bar         |
//+------------------------------------------------------------------+
class CMarketProfile
  {
public:
                     CMarketProfile() {};
                     CMarketProfile(string prefix, datetime time1, datetime time2, double high, double low, MqlRates &bars[]);
                    ~CMarketProfile(void);

   //--- checks if the object was created for the specified date
   bool              Check(string prefix, datetime time);
   //--- set high/low and array of intraday bars
   void              SetHiLoBars(double high, double low, MqlRates &bars[]);
   //--- set canvas dimensions and drawing options
   void              UpdateSizes(void);
   //--- is the profile in the visible part of the chart?
   bool              isVisibleOnChart(void);
   //--- has the graph scale changed?
   bool              isChartScaleChanged(void);
   //--- calculates profile by sessions
   bool              CalculateSessions(void);
   //--- draws a profile
   void              Draw(double multiplier=1.0);
   //---
protected:
   CCanvas           m_canvas;      // CCanvas class object for drawing profile
   uchar             m_alpha;       // alpha channel value that sets transparency
   string            m_prefix;      // unique prefix of the OBJ_BITMAP object
   string            m_name;        // name of the OBJ_BITMAP object used in m_canvas
   double            m_high;        // day's High
   double            m_low;         // day's Low
   datetime          m_time1;       // start time of the day
   datetime          m_time2;       // end time of the day
   int               m_day_size_pt; // daily bar height in points
   int               m_height;      // daily bar height in pixels on the chart
   int               m_width;       // daily bar width in pixels on the chart
   MqlRates          m_bars[];      // array of bars of the current timeframe between m_time1 and m_time2
   vector            m_asia;        // array of bar counters for the Asian session
   vector            m_europe;      // array of bar counters for the European session
   vector            m_america;     // array of bar counters for the American session
   double            m_vert_scale;  // vertical scaling factor
   double            m_hor_scale;   // horizontal scaling factor
  };
类中声明的公共方法:
- Check()用于检查为特定日期创建的市场轮廓对象是否存在;
- SetHiLoBars()用于将当日的最高价和最低价设置到市场轮廓对象中,并将日内K线数组传递给该对象;
- UpdateSizes() 用于设置画布的尺寸以及市场轮廓对象中绘制矩形的缩放系数;
- isVisibleOnChart()返回一个标志,用以表明市场轮廓是否在图表的可见范围内;
- isChartScaleChanged()在类中声明了但并未实现;
- CalculateSessions()用于计算参数并填充交易时段数组;
- Draw()基于所有交易时段的数据,在画布上绘制市场轮廓直方图。
在类的 protected(受保护)部分声明的变量,其用途是相当明确的。我想重点谈谈交易时段K线计数器的数组。
它们都被声明为 vector 变量,这使得我们可以将它们作为数据数组来处理,尽管方式上更简单一些:
使用向量和矩阵,更确切地说是使用这些相关类型的特殊方法,能够创建出更简洁、更清晰且接近数学符号表示的代码。使用这些方法,您可以避免创建嵌套循环或在计算中注意正确索引数组。因此,使用矩阵和向量方法可以提高复杂程序开发的可靠性和速度。
下面我们来探讨已声明类方法的实现。
构造函数:
//+------------------------------------------------------------------+
//| Constructor                                                      |
//+------------------------------------------------------------------+
void CMarketProfile::CMarketProfile(string prefix, datetime time1, datetime time2, double high, double low, MqlRates &bars[]):
   m_prefix(prefix),
   m_time1(time1),
   m_time2(time2),
   m_high(high),
   m_low(low),
   m_vert_scale(NULL),
   m_hor_scale(NULL)
  {
//--- copy the array of intraday bars to the array of MqlRates structures,
//--- create a name for the graphical object and define the size of the daily candle
   ArrayCopy(m_bars, bars);
   m_name=ExtPrefixUniq+"_MP_"+TimeToString(time1, TIME_DATE);
   m_day_size_pt=(int)((m_high-m_low)/SymbolInfoDouble(Symbol(), SYMBOL_POINT));
//--- set vector sizes for trading sessions
   m_asia=vector::Zeros(m_day_size_pt);
   m_europe=vector::Zeros(m_day_size_pt);
   m_america=vector::Zeros(m_day_size_pt);
//--- set the width and height of the canvas
   UpdateSizes();
//--- if this is the first tick at the beginning of the day, then the canvas dimensions will be zero - set the dimensions to 1 pixel in height and width
   m_height=m_height?m_height:1;
   m_width=m_width?m_width:1;
//--- create a graphical object
   if(m_canvas.CreateBitmap(m_name, m_time1, m_high, m_width, m_height, COLOR_FORMAT_ARGB_NORMALIZE))
      ObjectSetInteger(0, m_name, OBJPROP_BACK, true);
   else
     {
      Print("Error creating canvas: ", GetLastError());
      Print("time1=", m_time1, "  high=", m_high, "  width=", m_width, "  height=", m_height);
     }
  }
参数化构造函数接收待创建画布对象(用于渲染当日轮廓)的名称前缀、当日的开始和结束时间、当日的最高价和最低价,以及一个日内K线数组。这些变量的值在初始化列表中被赋给相应的类成员变量。接下来:
- 通过引用传入的数组被复制到类的数组中;然后,根据传入的 前缀、“MP”缩写和每日开盘时间 创建一个唯一的图形对象名称,并计算出以点数为单位的日K线尺寸;
- 每个交易时段数组的大小都被设置为等于日线以点数为单位的尺寸,并同时用零进行填充——即完成初始化;
- 设置用于绘制轮廓的画布尺寸。如果这是当日的第一笔报价(Tick),尺寸将为零,此时宽度和高度会被设置为两个维度上均允许的最小尺寸——一个像素;
- 根据指定的尺寸创建一个绘图画布。
用于检查为指定日期创建的市场轮廓对象是否存在的方法:
//+------------------------------------------------------------------+
//| Checks if CMarketProfile object is for the specified 'time' date |
//+------------------------------------------------------------------+
bool CMarketProfile::Check(string prefix, datetime time)
  {
   string calculated= prefix+"_MP_"+TimeToString(time, TIME_DATE);
   return (m_name==(calculated));
  };
由于每个轮廓画布对象的名称都在类的构造函数中设定,并且该名称使用了当日开始时间的字符串表示形式,因此,为了检查对象是否为特定时间所创建,该方法会接收当日的开始时间,生成一个与对象名称完全相同的字符串,然后将此生成的字符串与对象的实际名称进行比较。该方法会返回检查的结果。
用于将当日的最高价和最低价设置给市场轮廓对象,并向该对象传入日内K线数组的方法:
//+------------------------------------------------------------------+
//| Sets High/Low and a set of current-timeframe bars                |
//+------------------------------------------------------------------+
void CMarketProfile::SetHiLoBars(double high, double low, MqlRates &bars[])
  {
//--- if the maximum of the day has changed, move the OBJ_BITMAP object to the new Y coordinate
   if(high>m_high)
     {
      m_high=high;
      if(!ObjectSetDouble(0, m_name, OBJPROP_PRICE, m_high))
         PrintFormat("Failed to update canvas for %s, error %d", TimeToString(m_time1, TIME_DATE), GetLastError());
     }
   ArrayCopy(m_bars, bars);
   m_high=high;
   m_low=low;
//--- daily range in points
   m_day_size_pt=(int)((m_high-m_low)/SymbolInfoDouble(Symbol(), SYMBOL_POINT));
//--- reset vector sizes for trading sessions
   m_asia=vector::Zeros(m_day_size_pt);
   m_europe=vector::Zeros(m_day_size_pt);
   m_america=vector::Zeros(m_day_size_pt);
  }
该方法接收日K线的最高价和最低价,以及一个通过引用传入的、格式为MqlRates结构的日内K线数组。
- 最高价被写入对象变量,并且画布被移动到新的坐标;
- 日内K线从传入的K线数组复制到内部数组中;
- 当日的最低价被设置给类变量;
- 计算日线K线以点为单位的新尺寸;
- 交易时段数组根据计算出的日线K线尺寸(以点为单位)进行扩容,并用零进行填充——即完成初始化。
需要注意的是,这里使用了Zeros()矩阵和向量方法来初始化向量。该方法既能设置向量的大小,又能用零填充整个数组。
对于一个普通数组,我们将必须执行两个操作:ArrayResize()和ArrayInitialize()。
用于设置画布尺寸以及市场轮廓对象中绘制矩形的缩放比例的方法:
//+------------------------------------------------------------------+
//|  Sets drawing parameters                                         |
//+------------------------------------------------------------------+
void CMarketProfile::UpdateSizes(void)
  {
//--- convert time/price to x/y coordinates
   int x1, y1, x2, y2;
   ChartTimePriceToXY(0, 0, m_time1, m_high, x1, y1);
   ChartTimePriceToXY(0, 0, m_time2, m_low,  x2, y2);
//--- calculate canvas dimensions
   m_height=y2-y1;
   m_width =x2-x1;
//--- calculate ratios for transforming vertical price levels
//--- and horizontal bar counters to chart pixels
   m_vert_scale=double(m_height)/(m_day_size_pt);
   m_hor_scale =double(m_width*PeriodSeconds(PERIOD_CURRENT))/PeriodSeconds(PERIOD_D1);

//--- change the canvas size
   m_canvas.Resize(m_width, m_height);
  }
该方法的逻辑在代码中已有注释。缩放比例用于根据画布尺寸与图表窗口尺寸的比率,来设置在画布上绘制的矩形的大小。
计算出的比率会被加入到渲染矩形的高度和宽度的计算中。
返回市场轮廓是否在图表可见区域内的标志的方法:
//+------------------------------------------------------------------+
//|  Checks that the profile is in the visible part of the chart     |
//+------------------------------------------------------------------+
bool CMarketProfile::isVisibleOnChart(void)
  {
   long last_bar=ChartGetInteger(0, CHART_FIRST_VISIBLE_BAR);        // last visible bar on the chart on the left
   long first_bar=last_bar+-ChartGetInteger(0, CHART_VISIBLE_BARS);  // first visible bar on the chart on the right
   first_bar=first_bar>0?first_bar:0;
   datetime left =iTime(Symbol(), Period(), (int)last_bar);          // time of the left visible bar on the chart
   datetime right=iTime(Symbol(), Period(), (int)first_bar);         // time of the right visible bar on the chart

//--- return a flag that the canvas is located inside the left and right visible bars of the chart
   return((m_time1>= left && m_time1 <=right) || (m_time2>= left && m_time2 <=right));
  }
在这里,我们找到图表上左右可见K线的编号,获取它们的时间,并返回一个标志,该标志表明画布左右边缘的时间是否在图表可见K线的区域内。
用于计算参数并填充交易时段数组的方法:
//+------------------------------------------------------------------+
//| Prepares profile arrays by sessions                              |
//+------------------------------------------------------------------+
bool CMarketProfile::CalculateSessions(void)
  {
   double point=SymbolInfoDouble(Symbol(), SYMBOL_POINT);   // one point value
//--- if the array of intraday bars is not filled, leave
   if(ArraySize(m_bars)==0)
      return(false);
//---- iterate over all the bars of the current day and mark the cells of the arrays (vectors) that contain the bars being iterated over in the loop
   int size=ArraySize(m_bars);
   for(int i=0; i<size; i++)
     {
      //--- get the bar hour
      MqlDateTime bar_time;
      TimeToStruct(m_bars[i].time, bar_time);
      uint        hour     =bar_time.hour;
      //--- calculate price levels in points from the Low of the day reached by the price on each bar of the loop
      int         start_box=(int)((m_bars[i].low-m_low)/point);   // index of the beginning of price levels reached by the price on the bar
      int         stop_box =(int)((m_bars[i].high-m_low)/point);  // index of the end of price levels reached by the price on the bar

      //--- American session
      if(hour>=InpAmericaStartHour)
        {
         //--- in the loop from the beginning to the end of price levels, fill the counters of bars where the price was at this level
         for(int ind=start_box; ind<stop_box; ind++)
            m_america[ind]++;
        }
      else
        {
         //--- European session
         if(hour>=InpEuropeStartHour && hour<InpAmericaStartHour)
            //--- in the loop from the beginning to the end of price levels, fill the counters of bars where the price was at this level
            for(int ind=start_box; ind<stop_box; ind++)
               m_europe[ind]++;
         //--- Asian session
         else
            //--- in the loop from the beginning to the end of price levels, fill the counters of bars where the price was at this level
            for(int ind=start_box; ind<stop_box; ind++)
               m_asia[ind]++;
        }
     }
//--- vectors of all sessions are ready
   return(true);
  }
在上一篇文章中,我们详细地分析了定义交易时段中K线数量的逻辑,这些K线的价格达到了从当日最低价到最高价之间的(以点为单位的)位置。如果在指标的先前版本中,所有这些操作都是在指标的主循环中完成的,那么在这里,整个计算被提取到日轮廓对象的一个单独方法中。其要点在于,计算并将在每个价格水平(从当日最低价到最高价,以点为单位计算)上重叠的K线数量,写入数组(向量)的单元格中。在该方法完成其工作后,所有向量将根据价格在各个价格水平上的移动情况被填充。在各价位上重叠的K线数量将被设置在数组(向量)的相应单元格中。
根据所有交易时段的数据在画布上绘制市场轮廓直方图的方法:
//+------------------------------------------------------------------+
//|  Draw Market Profile on the canvas                               |
//+------------------------------------------------------------------+
void CMarketProfile::Draw(double multiplier=1.0)
  {
//--- sum up all sessions for rendering
   vector total_profile=m_asia+m_europe+m_america;   // profile that combines all sessions
   vector europe_asia=m_asia+m_europe;               // profile that combines only the European and Asian sessions

//--- set a completely transparent background for the canvas
   m_canvas.Erase(ColorToARGB(clrBlack, 0));

//--- variables for drawing rectangles
   int x1=0;                           // X coordinate of the left corner of the rectangle always starts at zero
   int y1, x2, y2;                     // rectangle coordinates
   int size=(int)total_profile.Size(); // size of all sessions

//--- render the American session with filled rectangles
   for(int i=0; i<size; i++)
     {
      //--- skip zero vector values
      if(total_profile[i]==0)
         continue;
      //--- calculate two points to draw a rectangle, x1 is always 0 (X of the lower left corner of the rectangle)
      y1=m_height-int(i*m_vert_scale);                    // Y coordinate of the lower left corner of the rectangle
      y2=(int)(y1+m_vert_scale);                          // Y coordinate of the upper right corner of the rectangle
      x2=(int)(total_profile[i]*m_hor_scale*multiplier);  // X coordinate of the upper right corner of the rectangle
      //--- draw a rectangle at the calculated coordinates with the color and transparency set for the American session
      m_canvas.FillRectangle(x1, y1, x2, y2, ColorToARGB(InpAmericaSession, InpTransparency));
     }

//--- render the European session with filled rectangles
   for(int i=0; i<size; i++)
     {
      //--- skip zero vector values
      if(total_profile[i]==0)
         continue;
      //--- calculate two points to draw a rectangle
      y1=m_height-int(i*m_vert_scale);
      y2=(int)(y1+m_vert_scale);
      x2=(int)(europe_asia[i]*m_hor_scale*multiplier);
      //--- draw a rectangle over the rendered American session using the calculated coordinates
      //--- with color and transparency set for the European session
      m_canvas.FillRectangle(x1, y1, x2, y2, ColorToARGB(InpEuropeSession, InpTransparency));
     }

//--- draw the Asian session with filled rectangles
   for(int i=0; i<size; i++)
     {
      //--- skip zero vector values
      if(total_profile[i]==0)
         continue;
      //--- calculate two points to draw a rectangle
      y1=m_height-int(i*m_vert_scale);
      y2=(int)(y1+m_vert_scale);
      x2=(int)(m_asia[i]*m_hor_scale*multiplier);
      //--- draw a rectangle over the rendered European session using the calculated coordinates
      //--- with color and transparency set for the Asian session
      m_canvas.FillRectangle(x1, y1, x2, y2, ColorToARGB(InpAsiaSession, InpTransparency));
     }
//--- update the OBJ_BITMAP object without redrawing the chart
   m_canvas.Update(false);
  }
代码注释中详细讲述了方法逻辑。简而言之,我们已经计算并填充了三个交易时段——亚洲、欧洲和美洲的数组(向量)。现在需要为每个时段渲染轮廓直方图。首先渲染美洲时段,然后在其之上渲染欧洲时段,最后在已绘制的两个时段之上再渲染亚洲时段。
为什么我们要按与交易时间相反的顺序来渲染呢?
- 美洲时段,更准确地说是其直方图,既包含了前两个时段已经交易的时间,也包含了美洲时段自身的时间,也就是说,这是整个一天最完整的轮廓直方图。这就是为什么它被最先渲染。
- 然后渲染欧洲时段,它包含了已经交易过的亚洲时段的时间。相应地,由于这里只有两个时段——亚洲和欧洲,其直方图在X轴上会比美洲时段的短,这意味着它需要被渲染在美洲时段的上方。
- 接着,渲染在X轴上最短的亚洲时段直方图。
我想特别指出,在使用向量(vectors)时,合并数组数据是多么的方便:
//--- sum up all sessions for rendering
   vector total_profile=m_asia+m_europe+m_america;   // profile that combines all sessions
   vector europe_asia=m_asia+m_europe;               // profile that combines only the European and Asian sessions
本质上,这是将多个相同大小的数组按元素逐个合并成一个结果数组,这一过程可以用下面的代码来表示:
Result of the merge:
 9.00000 12.00000 15.00000
*/
下面的代码实现了与上述方法中那行代码相同的功能:
vector total_profile=m_asia+m_europe+m_america; // 结合了所有时段的轮廓 我想,无需多言,大家就能看出这种写法有多么方便和简洁了……
创建的画布对象会在类的析构函数中被删除,并重绘图表以显示所做的更改:
//+------------------------------------------------------------------+
//| Destructor                                                       |
//+------------------------------------------------------------------+
void CMarketProfile::~CMarketProfile(void)
  {
//--- delete all graphical objects after use
   ObjectsDeleteAll(0, m_prefix, 0, OBJ_BITMAP);
   ChartRedraw();
  }
现在,我们不再需要在指标循环中使用图形对象进行绘制,只需为每个日线柱创建一个该类的实例,计算所有交易时段的数据,然后在画布上为每一天绘制市场轮廓直方图即可。所创建的图形对象数量,取决于轮廓显示设置中指定的天数。这与指标的前一个版本不同,在旧版本中,直方图的每一行都是用其自己的图形对象来绘制的。
优化指标
现在,让我们来看看这个指标是如何使用市场轮廓类来制作的。让我们从头开始打开指标文件 \MQL5\Indicators\Free Indicators\MarketProfile Canvas.mq5 并对其进行研究。
首先,包含类文件,以简化自定义CCanvas渲染对象的创建,同时也包含了用于创建CArrayList<T>泛型列表的类文件:
//+------------------------------------------------------------------+
//|                                         MarketProfile Canvas.mq5 |
//|                              Copyright 2009-2024, MetaQuotes Ltd |
//|                                             https://www.mql5.com |
//+------------------------------------------------------------------+
#property copyright "Copyright 2022, MetaQuotes Ltd."
#property link      "https://www.mql5.com"
#property version   "1.00"
#property indicator_chart_window
#property indicator_plots 0

#include <Canvas\Canvas.mqh>
#include <Generic\ArrayList.mqh>

//--- input parameters
接下来是指标的输入参数列表、一个唯一的图形对象前缀、已声明的市场轮廓类以及已声明的类对象列表:
//--- input parameters
input uint  InpStartDate       =0;           /* day number to start calculation */  // 0 - current, 1 - previous, etc.
input uint  InpShowDays        =7;           /* number of days to display */        // starting with and including the day in InpStartDate
input int   InpMultiplier      =1;           /* histogram length multiplier */
input color InpAsiaSession     =clrGold;     /* Asian session */
input color InpEuropeSession   =clrBlue;     /* European session */
input color InpAmericaSession  =clrViolet;   /* American session */
input uchar InpTransparency    =150;         /* Transparency, 0 = invisible */      // market profile transparency, 0 = fully transparent
input uint  InpEuropeStartHour =8;           /* European session opening hour */
input uint  InpAmericaStartHour=14;          /* American session opening hour */

//--- unique prefix to identify graphical objects belonging to the indicator
string ExtPrefixUniq;

//--- declare CMarketProfile class
class CMarketProfile;
//--- declare a list of pointers to objects of the CMarketProfile class
CArrayList<CMarketProfile*> mp_list;
由于市场轮廓类的代码写在指标代码的下方,因此需要类的前置声明,以避免在编译过程中出现“未知变量类型”的错误。
‘CMarketProfile’ - 意外的标记
这个泛型列表将包含指向代码下方所定义的 CMarketProfile 类类型对象的指针。
在OnInit()处理函数中,通过取系统启动后所经过的毫秒数的最后4位,来创建图形对象的前缀:
//+------------------------------------------------------------------+
//| Custom indicator initialization function                         |
//+------------------------------------------------------------------+
int OnInit()
  {
//--- create a prefix for object names
   string number=StringFormat("%I64d", GetTickCount64());
   ExtPrefixUniq=StringSubstr(number, StringLen(number)-4);
   Print("Indicator \"Market Profile Canvas\" started, prefix=", ExtPrefixUniq);

   return(INIT_SUCCEEDED);
  }
让我们来看看OnCalculate() 函数的完整代码:
//+------------------------------------------------------------------+
//| Custom indicator iteration function                              |
//+------------------------------------------------------------------+
int OnCalculate(const int rates_total,
                const int prev_calculated,
                const datetime &time[],
                const double &open[],
                const double &high[],
                const double &low[],
                const double &close[],
                const long &tick_volume[],
                const long &volume[],
                const int &spread[])
  {
//--- opening time of the current daily bar
   datetime static open_time=0;

//--- number of the last day for calculations
//--- (if InpStartDate = 0 and InpShowDays = 3, lastday = 3)
//--- (if InpStartDate = 1 and InpShowDays = 3, lastday = 4) etc ...
   uint lastday=InpStartDate+InpShowDays;

//--- if the first calculation has already been made
   if(prev_calculated!=0)
     {
      //--- get the opening time of the current daily bar
      datetime current_open=iTime(Symbol(), PERIOD_D1, 0);

      //--- if we do not calculate the current day
      if(InpStartDate!=0)
        {
         //--- if the opening time was not received, leave
         if(open_time==current_open)
            return(rates_total);
        }
      //--- update opening time
      open_time=current_open;
      //--- we will only calculate one day from now on, since all other days have already been calculated during the first run
      lastday=InpStartDate+1;
     }

//--- in a loop for the specified number of days (either InpStartDate+InpShowDays on first run, or InpStartDate+1 on each tick)
   for(uint day=InpStartDate; day<lastday; day++)
     {
      //--- get the data of the day with index day into the structure
      MqlRates day_rate[];
      //--- if the indicator is launched on weekends or holidays when there are no ticks, you should first open the daily chart of the symbol
      //--- if we have not received bar data for the day index of the daily period, we leave until the next call to OnCalculate()
      if(CopyRates(Symbol(), PERIOD_D1, day, 1, day_rate)==-1)
         return(prev_calculated);

      //---  get day start and end time
      datetime start_time=day_rate[0].time;
      datetime stop_time=start_time+PeriodSeconds(PERIOD_D1)-1;

      //--- get all intraday bars of the current day
      MqlRates bars_in_day[];
      if(CopyRates(Symbol(), PERIOD_CURRENT, start_time, stop_time, bars_in_day)==-1)
         return(prev_calculated);

      CMarketProfile *market_profile;
      //--- if the Market Profile has already been created and its drawing has been performed earlier
      if(prev_calculated>0)
        {
         //--- find the Market Profile object (CMarketProfile class) in the list by the opening time of the day with the 'day' index
         market_profile=GetMarketProfileByDate(ExtPrefixUniq, start_time);
         //--- if the object is not found, return zero to completely recalculate the indicator
         if(market_profile==NULL)
           {
            PrintFormat("Market Profile not found for %s. Indicator will be recalculated for all specified days",
                        TimeToString(start_time, TIME_DATE));
            return(0);
           }
         //--- CMarketProfile object is found in the list; set it to High and Low values of the day and pass the array of intraday bars
         //--- in this case, the object is shifted to a new coordinate corresponding to the High of the daily candle, and all arrays (vectors) are reinitialized
         market_profile.SetHiLoBars(day_rate[0].high, day_rate[0].low, bars_in_day);
        }
      //--- if this is the first calculation
      else
        {
         //--- create a new object of the CMarketProfile class to store the Market Profile of the day with 'day' index
         market_profile = new CMarketProfile(ExtPrefixUniq, start_time, stop_time, day_rate[0].high, day_rate[0].low, bars_in_day);
         //--- add a pointer to the created CMarketProfile object to the list
         mp_list.Add(market_profile);
        }
      //--- set canvas dimensions and line drawing parameters
      market_profile.UpdateSizes();
      //--- calculate profiles for each trading session
      market_profile.CalculateSessions();
      //--- draw the Market Profile
      market_profile.Draw(InpMultiplier);
     }
//--- redraw the chart after the loop has been completed and all objects have been created and updated
   ChartRedraw(0);

//--- return the number of bars for the next OnCalculate call
   return(rates_total);
  }
处理程序逻辑在代码的注释中进行了完整讲述。简而言之,如下所述:
- 按照要显示的市场轮廓天数进行循环;
- 将循环索引对应的那一天的数据获取到结构中;
- 获取在循环中选定的那一天内,所包含的当前图表时间周期的K线数量;
- 为选定的那一天获取一个先前已创建的市场轮廓对象,如果该对象尚不在列表中,则创建一个新的;
- 以图表像素为单位,获取从最低价到最高价的日线柱尺寸,并重新初始化交易时段的数组(向量);
- 根据选定之日的新K线尺寸,我们调整画布的大小;
- 为每个交易时段重新计算当日的市场轮廓;
- 在画布上重新绘制每个交易时段的轮廓。
- 在循环结束时,重绘图表。
在指标的OnDeinit()处理函数中,删除所有已创建的图形对象:
//+------------------------------------------------------------------+
//| Custom indicator deinitialization function                       |
//+------------------------------------------------------------------+
void OnDeinit(const int reason)
  {
//--- delete all Market Profile graphical objects after use
   Print("Indicator \"Market Profile Canvas\" stopped, delete all objects CMarketProfile with prefix=", ExtPrefixUniq);

//--- in a loop by the number of CMarketProfile objects in the list
   int size=mp_list.Count();
   for(int i=0; i<size; i++)
     {
      //--- get the pointer to the CMarketProfile object from the list by the loop index
      CMarketProfile *market_profile;
      mp_list.TryGetValue(i, market_profile);
      //--- if the pointer is valid and the object exists, delete it
      if(market_profile!=NULL)
         if(CheckPointer(market_profile)!=POINTER_INVALID)
            delete market_profile;
     }
//--- redraw the chart to display the result immediately
   ChartRedraw(0);
  }
在 OnChartEvent() 事件处理函数中,更改市场轮廓每一天的画布尺寸:
//+------------------------------------------------------------------+
//| Custom indicator chart's event handler                           |
//+------------------------------------------------------------------+
void OnChartEvent(const int id, const long& lparam, const double& dparam, const string& sparam)
  {
//--- if this is a user event, leave
   if(id>=CHARTEVENT_CUSTOM)
      return;

//--- if there is a chart change, update the sizes of all objects of the CMarketProfile class with redrawing the chart
   if(CHARTEVENT_CHART_CHANGE==id)
     {
      //--- in a loop by the number of CMarketProfile objects in the list
      int size=mp_list.Count();
      for(int i=0; i<size; i++)
        {
         //--- get the pointer to the CMarketProfile object by the loop index
         CMarketProfile *market_profile;
         mp_list.TryGetValue(i, market_profile);
         //--- if the object is received and if it is in the visible area of the chart
         if(market_profile)
            if(market_profile.isVisibleOnChart())
              {
               //--- update canvas dimensions and redraw market profile histograms
               market_profile.UpdateSizes();
               market_profile.Draw(InpMultiplier);
              }
        }
      //--- update the chart after recalculating all Profiles
      ChartRedraw();
     }
  }
由于图表显示的刻度可以在垂直和水平方向上更改,因此带有交易时段直方图的图形对象也应相对于新的图表尺寸进行缩放。因此,在事件处理函数中,当图表发生变化时,所有 CMarketProfile 类的对象都应根据尺寸进行更新,并在已根据图表新刻度获得新尺寸的画布上重新绘制。
返回为指定某天开始时间而创建的市场轮廓对象的函数:
//+------------------------------------------------------------------+
//| Returns CMarketProfile or NULL by the date                       |
//+------------------------------------------------------------------+
CMarketProfile* GetMarketProfileByDate(string prefix, datetime time)
  {
//--- in a loop by the number of CMarketProfile objects in the list
   int size=mp_list.Count();
   for(int i=0; i<size; i++)
     {
      //--- get the pointer to the CMarketProfile object by the loop index
      CMarketProfile *market_profile;
      mp_list.TryGetValue(i, market_profile);
      //--- if the pointer is valid and the object exists,
      if(market_profile!=NULL)
         if(CheckPointer(market_profile)!=POINTER_INVALID)
           {
            //--- if the Market Profile object obtained by the pointer was created for the required time, return the pointer
            if(market_profile.Check(prefix, time))
               return(market_profile);
           }
     }
//--- nothing found - return NULL
   return(NULL);
  }
该函数在指标中按交易日循环使用,它会从列表中返回一个指向 CMarketProfile 类对象的指针,该对象是为具有特定开盘时间的日线柱创建的。该函数允许我们通过时间获取所需的对象,以便对其进行后续更新。
结论
我们研究了优化指标代码以减少资源消耗的可能性。我们摒弃了数千个图形对象,将它们替换为单个图形对象,用于渲染单日的市场轮廓。
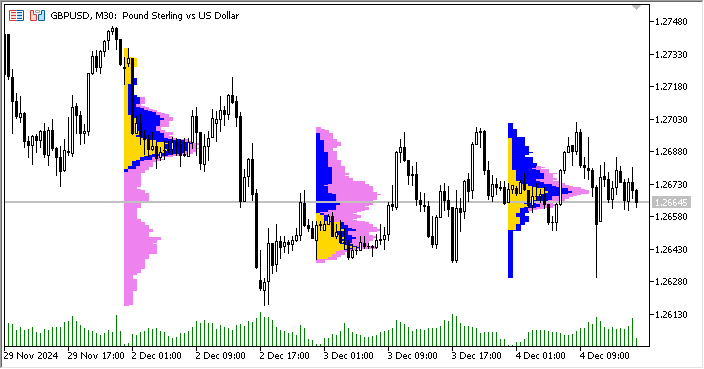
作为优化的结果,每个交易日(数量由设置指定,默认为7个)都显示在其自己的画布(OBJ_BITMAP对象)上,其中三个交易时段(亚洲、欧洲和美国)以直方图的形式渲染,每个时段都使用设置中指定的颜色。对于三个交易日,市场轮廓最终将如下所示:
在这里,我们只有三个图形对象,交易时段的直方图是使用 CCanvas 类在其上绘制的。我们可以清楚地看到,即使是三个位图图形对象的即时重渲染,也会导致图像出现明显的闪烁和抖动。这表明代码仍有进一步优化的空间。无论如何,现在我们只有三个图形对象,而不是原来的数千个。这在资源消耗上带来了显著的增益。视觉上的瑕疵可以通过进一步分析代码来修正(例如,还记得 CMarketProfile 类中未实现的 isChartScaleChanged() 方法吗,它允许我们仅在图表刻度真正发生变化的时刻才进行重绘)。
总而言之,我们可以肯定地说,任何代码总是可以优化的。尽管这可能需要采用不同的视觉组件构建概念,正如本指标中所做的那样。
本文附带了带有完整注释的指标文件,您可以下载并自行研究,如果愿意,也可以继续对其进行优化。
本文由MetaQuotes Ltd译自俄文
原文地址: https://www.mql5.com/ru/articles/16579
注意: MetaQuotes Ltd.将保留所有关于这些材料的权利。全部或部分复制或者转载这些材料将被禁止。
本文由网站的一位用户撰写,反映了他们的个人观点。MetaQuotes Ltd 不对所提供信息的准确性负责,也不对因使用所述解决方案、策略或建议而产生的任何后果负责。

为什么不撰写完美的卷面
何谓 "完美"?
为什么不编写完美的音量曲线
这是一个有趣的话题。但这种方法有一些缺点。如果图形数字是 "画了就忘",那么在移动图表、更改 TF 等操作时,mt5 会自行缩放它们,那么在任何 CHARTEVENT_CHART_CHANGE 时,Canvas 都应始终重新绘制,即使 VP 位于历史中的某处,也应在已更改的数据上重新绘制。必须获取这些数据,但这些数据(tick 数据)并不总是在 mt5 缓存中,要么存储在内存中并检查 VP 边界是否发生变化,要么不断向 mt5 请求(现在我已经这样实现了),但这并不能快速奏效,因此数据并不总是完整提供,也不能立即确定。
绘图是问题的一部分。第二部分是,交易者并不总是只需要一张图片来欣赏它,他还需要基于这张图片的信号,如 POC、VHL、VLL、"进入空档 "等。而且我们只能将事件绑定到图形对象上(有条件的情况下,我们可以将它们保存在指标中的某个数组中,但还是希望能直观地看到这个级别在哪里,警报是在哪里触发的)。也就是说,我们仍然需要图形对象来显示 kanvas VP,当然,与通过图形对象显示 VP 的情况相比,图形对象的数量要少一个数量级甚至几个数量级。
总的来说,总结如下--我们无法从 mt5 中获得体积终端(目前还不能)(我们需要簇、三角洲等)。
图中是 VP 在脉冲波上的示例,POC 用线表示,这里是 tick volume,如果有真实的 volume,我会对其进行处理(finam、amp global)。比较高级 TF 上的刻度线交易量和实际交易量的实践表明,它们要么重合,要么非常接近,除了大交易量穿过高位或低位蜡烛图的情况,在这种情况下,刻度线交易量对我们毫无帮助。
这是一个有趣的话题。但这种方法有一些缺点。如果图形数字是 "画了就忘",那么在移动图表、更改 TF 等操作时,mt5 会自行缩放它们,那么在任何 CHARTEVENT_CHART_CHANGE 时,Canvas 都应始终重新绘制,即使 VP 位于历史中的某处,也应在已更改的数据上重新绘制。必须获取这些数据,但这些数据(刻度线数据)并不总是在 mt5 缓存中,要么存储在内存中并检查 VP 边界是否发生变化,要么不断向 mt5 请求(现在我已经这样做了),但这并不能快速奏效,而且数据并不总是完整提供,也不能立即确定。
绘图是问题的一部分。第二部分是,交易者并不总是只需要一张图片来欣赏它,他还需要基于这张图片的信号,如 POC、VHL、VLL、"进入虚空 "等。而且我们只能将事件绑定到图形对象上(有条件的情况下,我们可以将事件保存在指标中的某个数组中,但最好还是能直观地看到这个级别在哪里,警报是在哪里触发的)。也就是说,我们仍然需要图形对象来显示画布上的 VP,当然,与通过图形对象显示 VP 的情况相比,图形对象的数量要少一个数量级甚至几个数量级。
总的来说,总结如下:我们无法从 mt5 中获得体积终端(目前还不能)(我们需要群集、三角洲等)。
这张图是 VP 在脉冲波上的示例,POC 用一条线表示,这里是 tick volume,如果有真实的 volume,我会对其进行处理(finam、amp global)。比较高级 TF 上的刻度线交易量和实际交易量的实践表明,它们要么重合,要么非常接近,除了大交易量穿过高位或低位蜡烛图的情况,在这种情况下,刻度线交易量对我们毫无帮助。
不完全是这样。这些并不是缺点,而是您需要了解的功能,以便以最大的可能性和自由度使用该工具。
一切都可以完成,即使是 3D 群集。
以下是仅使用 Canvas 而未使用 OpenCL 的MQL5 示例。如果使用 OpenCL(即显卡),速度将大幅提升(数十倍)。