Fibonacci Trend Marker
- Göstergeler
- Sürüm: 1.1
- Güncellendi: 19 Ağustos 2025
- Etkinleştirmeler: 10
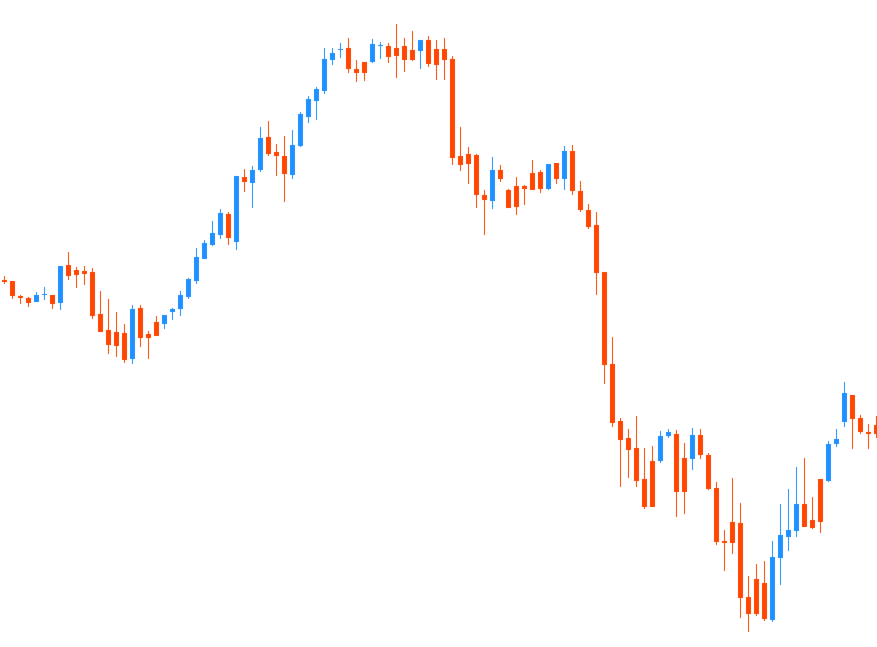
Fibonacci Trend Marker — mevcut mumun önceki mumların Yüksek-Düşük (High-Low, HL) aralığına göre davranışını Fibonacci geri çekilme seviyelerini kullanarak analiz eden bir trend göstergesidir. Trendin gücünü görsel olarak takip eder ve mum renginin değişimiyle olası zayıflama veya tersine dönüş sinyalleri verir.
Özellikler:
- Trend odaklı traderlar için tasarlanmıştır ve Fibonacci seviyelerine dayanarak trend değişikliklerini hızlıca tespit etmeye yardımcı olur.
- Piyasada yeterli volatilite olduğunda ve 3-5 mumun net bir hareket oluşturduğu herhangi bir zaman diliminde etkilidir.
- Mum boyutu, grafik ölçeğine otomatik olarak uyum sağlar ve yakınlaştırma sırasında doğru görüntüleme sunar.
- Mevcut mumun gerçek zamanlı analizi sayesinde trend değişikliklerine yüksek hassasiyet gösterir, bu da M1 ve M5 zaman dilimlerinde scalping için idealdir.
Nasıl işlem yapılır?
- Giriş: Önceki kapanmış mumun rengi değiştikten sonra pozisyon açın. Örneğin, kırmızı bir mumdan sonra mavi kapanan bir mum, yükseliş trendini işaret eder — Al (Buy) işlemi açın.
- Çıkış: Önceki mumun rengi tersine döndüğünde pozisyonu kapatın veya hedefe ulaşıldığında, örneğin trend yönünde 1-2 mum kar alarak, piyasa volatilitesine bağlı olarak.
- Mevcut (kapanmamış) mumun rengi, fiyat tekliflerine göre değişebilir; bu, scalperlar için özellikle faydalıdır ve mum kapanmadan işlemi kapatma imkanı sağlar.
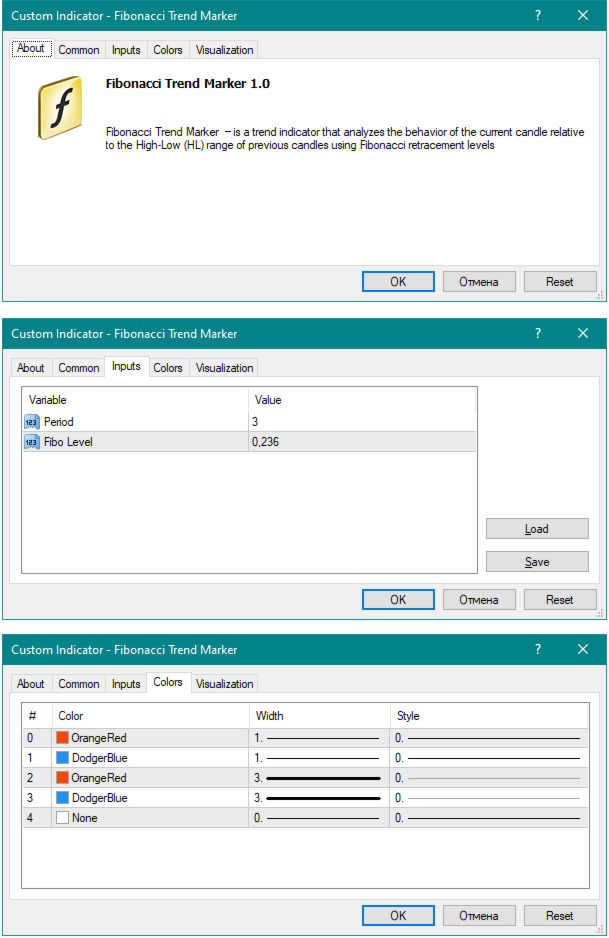
Ayarlar:
- Period — Hesaplama için önceki mum sayısını belirler (örneğin, 3, 5, 10).
- Fibo Level — Mevcut mumun Fibonacci’ye göre izin verilen geri çekilme seviyesini tanımlar (0.236, 0.382 vb.). Daha yüksek değer, trend değişim sinyalini geciktirir.
- Mum Rengi — Yükseliş ve düşüş sinyalleri için renkleri özelleştirmenizi sağlar.