Regardez les tutoriels vidéo de Market sur YouTube
Comment acheter un robot de trading ou un indicateur
Exécutez votre EA sur
hébergement virtuel
hébergement virtuel
Test un indicateur/robot de trading avant d'acheter
Vous voulez gagner de l'argent sur Market ?
Comment présenter un produit pour qu'il se vende bien
Nouveaux indicateurs techniques pour MetaTrader 5 - 18

Crash Scalper Gold It is an indicator, where it marks points of purchase and points of sale As the name says, it is used to scalp in the pairs of (Crash) 1000/500/300 where it sends you signals of sale/Sell and purchase/Buy at level points (90) he sends you the sell signal, (Spike) at the level point (27) it sends you the buy signal, (Trend Candles) It is very simple and easy to use. to make the best tickets possible! For this period it will remain on sale! Without further ado, enjoy! Good profi
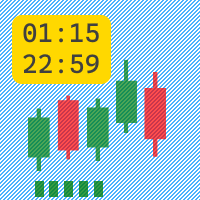
The Active Session indicator displays an active trading session in the form of green candles in a separate window.
Indicator parameters:
Monday = true/false - trade on Monday if the parameter is true.
Tuesday = true/false - trade on Tuesday if the parameter is true.
Wednesday = true/false - trade on Wednesday if the parameter is true.
Thursday = true/false - trade on Thursday if the parameter is true.
Friday = true/false - trade on Friday if the parameter is true.
StartHou
Xau/Usd Scalper It is a unique indicator where it counts the low/high to make buy and sell entries! where you mark the entries with arrows next to the lows and highs used in m15/H1 to make longer and more valuable entries It is very simple and easy to use It also works for forex pairs and synthetic indices! Without further ado, enjoy! good profit World Investor!!

The seven currencies mentioned are: GBP (British Pound): This is the currency of the United Kingdom. AUD (Australian Dollar): This is the currency of Australia. NZD (New Zealand Dollar): This is the currency of New Zealand. USD (United States Dollar): This is the currency of the United States. CAD (Canadian Dollar): This is the currency of Canada. CHF (Swiss Franc): This is the currency of Switzerland. JPY (Japanese Yen): This is the currency of Japan. Currency strength indexes provide a way to
FREE

The ChanLun or Chan theory is one of the most popular trading theories in China. But it seems like that it has little influence in western countries. Actually, the Chan Theory is based on a sophisticated mathematical model. The basic idea ChanLun is to simplify the bar chart by its model. With the help of ChanLun, a trader can analyze and predict the trend of future goods, stocks.
In ChanLun, there are several basic elements called fractals, strokes, line segments and pivots . A trader should p

This is a multi-timeframe indicator that detects and displays support and resistance (S&R) lines using the ZigZag indicator.
Features
The support and resistance lines are not redrawing. The indicator is capable of adding new support and resistance levels as they appear. Each S&R line has a tooltip that displays the price level and start time. Save time for multi-timeframe analysis on trades. All types of alerts (sound, pop-up, email, mobile push notification) are available. Working with al

*This is trading view indicator converted in mql5*
The HA Market Bias Indicator is a popular tool used in trading and technical analysis, designed to help traders identify market bias and potential trend reversals. It is commonly used in conjunction with candlestick charts and provides valuable insights into market sentiment. The indicator is based on the Heiken Ashi (HA) candlestick charting technique, which aims to filter out market noise and provide a smoother representation of price actio
FREE

The "AI Forecast" indicator is the result of a unique experiment in which I asked an AI how to create the best indicator to anticipate the market. The AI suggested measuring the past history of the price and its reactions to different levels, and then calculating the probabilities of the price reaction in the future.
With this idea, I designed with the help of another AI the "AI Forecast" indicator, which adapts to any MetaTrader chart and shows you three lines: one for entry and two for poss

Logarithmic chart in new window You can use both chart as half or full window All features are active in both arithmetic and logarithmic charts Magnet in arithmetic chart is standard metatrader magnet in logarithmic chart magnet have two modes: first mode only select high or low, if this mode is enabled, you can set how many candles will be search before and after to find the highest or lowest points second mode select the closest point of the candle to click, its choose between 4 points (High,
FREE

candlestick time it a useful indicator ,it help to keep you alert with the candlestick time ,how far to be completed at the chosen period , it help to keep you patience which is a biggest thing that holds trades down ,try it to improve you way of trading. it work on any broker any time frame and any symbol. you can customize the color on input. it can work on multiple timeframe. Thank you !
FREE

The Boom And Crash Spike Entry This Indicator is Also Developed To milk the BOOM and CRASH indices . Free EA/Robot Also available based on the indicator DM after purchase of the indicator to get the EA/Robot for free and it's results. You get the EA only if you buy the indicator not rent it. It works On all Boom and Crash pairs (boom 300, 500, 1000 & Crash 300, 500, 1000) I would Highly recommend that you use this indicator to Catch spikes on Boom and Crash for higher win rate and accuracy
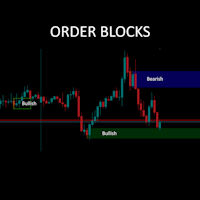
Straight forward keep is simple style Order Block finder. Now with optional higher timeframe overlay, watermark and candle timer all in one! No fancy algorithms but tends to be quite accurate for some symbols to predict bounce, return-to and break-through channels. It is a retrospective indicator (as they all are) and there to help you with better guesses as to where a movement is going towards. For me it works well in 5 and 15 minute periods. Use with out trade manager/visualiser/bracketing uti
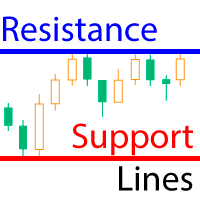
L'indicateur calcule des lignes fractales qui sont des lignes de support/résistance techniquement psychologiques. Il s'agit en fait des plus hauts et des plus bas du prix sur une période donnée. L'indicateur fonctionne sur tous les graphiques et toutes les périodes. Cette version gratuite de l'indicateur Resistance Support Lines Pro est livrée telle quelle ! Paramètres: Ces paramètres ne peuvent pas être modifiés dans cette version Fractal Candels = 5 - le nombre de chandeliers sur la base desqu
FREE

This all-in-one indicator displays real-time market structure (internal & swing BOS / CHoCH), order blocks, premium & discount zones, equal highs & lows, and much more...allowing traders to automatically mark up their charts with widely used price action methodologies. Following the release of our Fair Value Gap script, we received numerous requests from our community to release more features in the same category. "Smart Money Concepts" (SMC) is a fairly new yet widely used term amongst price a
Bienvenue dans l'indicateur Provlepsis.
"Provlepsis" est un indicateur très avancé conçu pour le marché MQL. En analysant les bougies précédentes à la même heure de la journée, il calcule avec précision la plage potentielle de mouvement du marché, fournissant des informations précieuses sur les futures fluctuations de prix. Contrairement à l'indicateur ATR traditionnel, "Provlepsis" prend en compte le facteur temps, ce qui en fait un outil plus puissant qui s'adapte aux différentes conditions d

Probability-Based Indicator This indicator analyses price movements of a given period to obtain crucial information for probability distribution analysis such as their mean and standard deviation, Once it has such piece of information it does all the necessary calculations and finally calculates the probability that the current market value will go above or below the given period bars. Since this indicator effectively leverages the power of probability which doesn't lie, It is a powerful indicat

Jackson Support and Resistance V it a powerful advance support and resistance indicator which provide signal base on price action, it Design to make things easy for everyone to draw support and resistance. we believe most strategies are built with support and resistance as a foundation .Having support and resistance perfect can be a game change to you way of trading. It flexible to all instrument .don't forget to watch our video on how to us this indicator prefect and progressive.
FREE

Pack Volatility 75 1/3 In this indicator stage 1 I am pleased to present you the volatility 75 Buy/Sell Professional indicator. where in each temporary structure it will mark a sale and a safe purchase to operate manually, where the strategy is based on the lines EMA of 7 exponential periods and the EMA of 50 exponential periods. where purchasing a product comes 2 as a gift (it's the pack) purchasing any of the 3 products will be sent the remaining indicators, to be able to apply the strategy we

Pinbar Outside Pattern indicator shows in a table symbol, time frame and direction of the last price candle if it matches outside pinbar input parameters. Outside pinbar means that the candle is extreme in the chosen time frame. By clicking ' Open chart ' button you can view drawn pattern. You can choose to scan through all the symbols in Market Watch or enter your favorite symbols, and also you can enter time frames you need to scan. ---------Main settings-------- Select all symbols from Market

The Your Trend indicator not only signals an immediate buy or sell. It indicates a short-term and long-term trend. operations. The simplest way to use the indicator is to open a trade in the direction of an existing trend. The indicator allows you to study the real and historical market trends in more detail! Shows the opening points of transactions for sale or purchase, and also indicates the direction of the trend on: short-term and long-term periods. The analysis is based on the selected tim

On this occasion I am pleased to present the (Boom 300 Professional Pack) where it consists of 4 indicators for the Boom 300 index of synthetic indices (Deriv Broker) Acquiring this indicator enables you the pack of the 4 boom 300 indicators where the rest of the indicators will be sent, This indicator is 1 of the 4 that includes the Buy/Sell strategy, sending you clear alerts where there buy or sell the pair It is recommended to use in a period of 15 minutes, to have a greater profit since the

Professional Pack Crash 300 Indicators, On this occasion I present the trend indicator that is for the crash index 300 (Deriv Broker) The indicator consists of a strategy where trends are caught in periods of 15 minutes, very clearly the indicator shows the purchase marking the tip of red until the trend develops, and then mark the green point of purchase, it is very simple to use, It is recommended to use in that temporality since it serves to catch longer trends and increase profit, the indica

Channel Stochastic Boom 1000 I am pleased to present the pack (Tendence Boom 1000) where on this occasion I present the Channel Stochastic Boom 1000 indicator for (Deriv Broker) where is 1 of the 4 indicators that the pack brings! The indicator consists of the sthochastic strategy, where it reaches the point of (0 Level) the purchase is made, taking advantage of hunting spike, where it reaches the point of (90 Level) the sale is made taking advantage of the trend candles! It is used in 1 minute

"Advanced Daily VWAP with Standard Deviation and Trading Bands" Description: "The 'Advanced Daily VWAP with Standard Deviation and Trading Bands' indicator offers a comprehensive view for traders who wish to make the Volume Weighted Average Price (VWAP) the crux of their trading strategy. It not only calculates the VWAP on a daily basis but also incorporates standard deviation to give an accurate representation of market volatility. The trading bands are calculated using a 1.5% multiplier for th

If your strategy requires trading during a certain period of market activity - calm or turbulent, this indicator will help you find such periods of time within a week for each currency pair using statistics.
The principle of the indicator is quite simple.
The entire trading week, from Monday 00:00 to Friday 23:59, is divided into timeslots, the duration of which corresponds to the current timeframe.
For each timeslot, activity is calculated - the average value of the difference between the
FREE

The big figure is a crucial aspect of forex trading, serving as a reference point for trade execution, risk management, and technical analysis. By understanding the importance of the big figure and incorporating it into their trading strategies, forex traders can improve their decision-making process and increase the likelihood of successful trades. Why is the Big Figure Important? The big figure is important for several reasons: Simplification: Traders often refer to the big figure when discu
FREE

The Fisher Transform is a technical indicator created by John F. Ehlers that converts prices into a Gaussian normal distribution. The indicator highlights when prices have moved to an extreme, based on recent prices. This may help in spotting turning points in the price of an asset. It also helps show the trend and isolate the price waves within a trend. The Fisher Transform is a technical indicator that normalizes asset prices, thus making turning points in price clearer. Takeaways Turning poi
FREE

It is one of the famous indicator in TradingView platform. Supertrend indicator shows the trend of the market intuitively . You can use it for understanding the trend or get insight about the market.
------- Value & Color -------- You can change the colour (line, filled). Default value is the same as Tradingview Supertrend default value ( period 10, ATR multiplier 3.0)

The Fisher Transform is a technical indicator created by John F. Ehlers that converts prices into a Gaussian normal distribution. The indicator highlights when prices have moved to an extreme, based on recent prices. This may help in spotting turning points in the price of an asset. It also helps show the trend and isolate the price waves within a trend. The Fisher Transform is a technical indicator that normalizes asset prices, thus making turning points in price clearer. Takeaways Turning poi

This MT5 indicator is my newest trading indicator which gives traders an accurate entry to buy or to sell. This can be used to scalp or swing-trade on longer time-frames but you will need to set your own stop loss and profit targets as the markets are unpredictable. This indicator can always provide the trader with at least a few pips of profit from scalping. Buy when you see a green arrow and sell when you see a red arrow. It's as easy as that.

ICT Silver Bullet
If you are searching for a reliable indicator to trade the ICT Silver Bullet concept, or ICT concepts, Smart Money Concepts, or SMC, this indicator will respond to your need! Before version 2.2, this indicator was focused only on ICT Silver Bullet, but moving forward, we will include the different elements for smart money concept trading. This indicator will help you identify the following: FVG - fair value gaps Market structure: BOS and CHOCH. It is based on ZIGZAG as it is
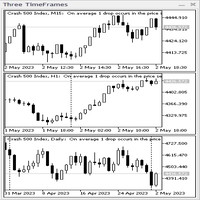
Panneau indicateur de trois TimeFrames. L'indicateur est réalisé sous la forme d'un panneau basé sur la classe CAppDialog. Le panneau peut être réduit ou déplacé dans le graphique actuel à l'aide de la souris. L'indicateur affiche trois périodes du symbole actuel dans le panneau. Dans la version actuelle, l'indicateur a un nombre minimum de paramètres - il s'agit des paramètres de trois délais: "Délai plus jeune", " Délai moyen " et " Délai plus ancien ". Une fois lancé, le panneau i

Attention ! Avant d'utiliser notre produit, veuillez lire attentivement la clause de non-responsabilité en anglais. Notre produit est conçu pour fournir des informations sur les tendances potentielles du marché et les mouvements de prix. Cependant, il n'y a aucune garantie de profits ou de résultats de négociation spécifiques. Les transactions sur les marchés financiers comportent des risques, et nous ne sommes pas responsables des pertes éventuelles. Toutes les informations complémentaires peuv

The Visual Volatility Clustering indicator clusters the market based on volatility. The indicator does not redraw and gives accurate data, does not use closing prices. Uses the opening prices or the highs or lows of the previous completed bar. Therefore, all information will be clear and unambiguous. The essence of the indicator is to divide the price market into certain areas according to a similar type of volatility. This can be done in any way. In this example, the indicator is configure

The Visual Volatility Clustering indicator clusters the market based on volatility. The indicator does not redraw and gives accurate data, does not use closing prices. Uses the opening prices or the highs or lows of the previous completed bar. Therefore, all information will be clear and unambiguous. The essence of the indicator is to divide the price market into certain areas according to a similar type of volatility. This can be done in any way. In this example, the indicator is configure
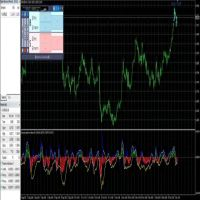
This is a predictive indicator ( leading indicator ) that uses Bayes' formula to calculate the conditional probability of price increases given the angular coefficient. The indicator calculates the angular coefficient and its regression and uses it to predict prices.
Bayes' theorem is a fundamental result of probability theory and is used to calculate the probability of a cause causing the verified event. In other words, for our indicator, Bayes' theorem is used to calculate the conditional pr

This is an Immediate Reversal Indicator, a powerful tool designed to help traders and investors to identify trend reversal points in the financial market quickly and efficiently.
Indicator Description: Our immediate reversal indicator is an arrow based on a combination of technical analysis and advanced algorithms, which aims to identify the moments when a market trend is about to reverse, can be used in all TimeFrames, can configure to send an alert when the signal appears. It is designed to

Jackson Support and Resistance it a powerful advance support and resistance indicator which provide signal base on price action, it Design to make things easy for everyone to draw support and resistance. we believe most strategies are built with support and resistance as a foundation .Having support and resistance perfect can be a game change to you way of trading. It flexible to all instrument .don't forget to watch our video on how to us this indicator prefect and progressive.
FREE

Market Heartbeat is in your hand! Introduction The Market Heartbeat indicator with a special enhanced algorithm (volume, money flow, cycle of market and a secret value) is a very repetitive trend finder with a high success rate . Interestingly, this Winner indicator indicates that the trend has changed its direction or the end of a trend retracement or even appears at the range market. The Market Heartbeat can use in scalping trading or trend trading. It finds immediately with alarm, notificatio

SDivergence Indicator calculates and shows regular divergences and hidden divergences for MACD and Stochastic(for now). The benefit of this indicator is multiple input variables. Using these inputs you can modify to get more adaptive RD and HD's to your strategy. Guide : 1- First put your desired oscillator (MACD or Stochastic or Both) on the chart. 2- Run SDivergence indicator and set corresponding sub-window index of previously put oscillator in SDivergence input window. -Note: the chart sub-w
FREE

Minimalist style BB indicator fully filled with a single color. Indicator type: Technical Indicator You are too confused with the complicated zigzag lines in the BB indicator, especially when your strategy has many indicators combined, it looks like a mess and we will no longer see any candlesticks on the chart for technical analysis s. This indicator was born to solve that. See more: Conversion tradingview indicator collection | Minimalist Price Action Strategy | Subscribe It is design
FREE

This indicator uses candle stick patterns and moving averages to determine trend , the candle sticks patterns it uses are harami Bull harami Bear Bullish Engulf Bearish Engulf this can both be used to catch trends and also for sculping it has 2 take profits and 2 stop losses which can be turned off if they are not ideal for you. the reward parameter is used to scale the take profit lines , if reward is 2 then the take profit will be 2 times the stoploss the are mobile alerts and terminal alerts

The fate of a trade depends on knowing the direction of the price trend. Whatever style you trade, you must know that the direction of the main market trend is in the hands of buyers or sell
YZD Trend indicator helps you to find the main direction by using mathematical parameters and ATR This indicator is a good supplement for your strategy, especially price action, which can reduce your trade losses.
How to use: YZD Trend indicator consists of two ranges in the form of bands, when th

The indicator is based on the concept of price channels, which are formed by plotting the highest high and lowest low prices over a specified period of time. The Donchian Channel Indicator consists of three lines: an upper channel line, a lower channel line, and a middle channel line. The upper channel line represents the highest high over a specified period, while the lower channel line represents the lowest low. The middle channel line is the average of the two and can be used as a reference f
FREE

To get access to MT4 version please click here . This is the exact conversion from TradingView: "Hammer & ShootingStar Candle Detector" by "MoriFX". This is a light-load processing and non-repaint indicator. All input options are available. Buffers are available for processing in EAs. You can message in private chat for further changes you need. Thanks.
FREE

Introducing the POWER TRADE indicator created by a small group of traders with a few years trading trading the financial market profitably . This is a plug and play indicator that provides you with POWERFUL Entry signals with Profit Taking and rebound zones. The indicator Works with all MT5 trading instruments. The indicator uses previous chart data as receipt to speculate on future market moves.
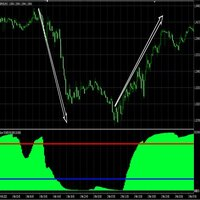
Absolute High Low indicator is a discretionary tool for assessing extremes in the price. It is very self-explanatory, and you can test against other default oscillators to see the difference. Combine with your trend following systems to master entry and exit at extremes. Back test and study the indicator to see the results up against a system or indicator. The indicator calculates a number of max bars so a gap will appear at the end, and it will restart. MT4 Version: https://www.mql5.com/e
To get access to MT4 version please click here . This is the exact conversion from TradingView:"HIGH AND LOW Optimized Trend TrackerHL OTT" by "kivancozbilgic" This is a light-load processing indicator. It is a non-repaint indicator. All input options are available. Buffers are available for processing in EAs. You can message in private chat for further changes you need. Thanks.

Dessine automatiquement les niveaux de support et de résistance PLUS les écarts des bougies de propulsion sur votre graphique, afin que vous puissiez voir où le prix est susceptible de se diriger ensuite et/ou de s'inverser potentiellement.
Cet indicateur est conçu pour être utilisé dans le cadre de la méthodologie de trading de position enseignée sur mon site web (The Market Structure Trader) et affiche des informations clés pour le ciblage et les entrées potentielles. MT4 Version: https://

Boom and Crash Gold miner v2 Trading indicator based on market momentum works on m1 for boom and crash 1000 and M5 time frame for normal trading pairs wait for blue arrow to appear plus change of candle stick color and candlesticks must be above the 2 modified moving averages then you can buy the market. wait for orange arrow to appear plus change of candle stick color and candlesticks must be below the 2 modified moving averages then you can sell the market.

Trend Chief est un algorithme d'indicateur avancé qui filtre le bruit du marché, détermine la tendance, les points d'entrée ainsi que les niveaux de sortie possibles. Utilisez des délais plus courts pour le scalping et des délais plus longs pour le swing trading.
Trend Chief est parfait pour tous les symboles Metatrader : devises, métaux, crypto monnaies, actions et indices * Comment utiliser l'indicateur Trend Chief : - Obtenez la tendance principale en regardant les graphiques quotidiens et

Boom and crash Gold Miner v2 trend histogram which works in conjunction with the indicator above that has arrows as shown in the video. PLEASE Note: That the top indicator and the bottom indicator are two separate indicators. the top indicator is https://www.mql5.com/en/market/product/98066 the bottom one is free. which is the histogram at the bottom. the trend histogram trading tool that helps to easy detect the trend blue color indicates an uptrend. Orange color is a down trend.
FREE
JPYTraderSR est un simple indicateur de support et de résistance spécifiquement pour le JPYTrader Expert Advisor . Il fournit des confirmations supplémentaires au conseiller expert en indiquant les niveaux de support et de résistance qui façonnent la structure du marché à un moment donné. Il n'y a pas de paramètres fournis pour cet indicateur car son seul but est de fournir plusieurs critères de confluence pour JPYTrader .

BUY INDICATOR AND GET A PIVOT POINT EA FOR FREE AS A BONUS + SOME OTHER GIFTS! Attention, the MT5 version of this application does not work on strategy tester, only on live accounts or demo accounts on live market. If you need an MT5 demo version of the Indicator send me a private message here: https://www.mql5.com/en/users/italobr ITALO PIVOTS INDICATOR is the best pivot point indicator for strong price reversals and continuations of price movements ever created, and why is that? You
Detector Fix indicator.
Currency pairs never rise or fall in a straight line. Their ups and downs are interspersed with rollbacks and reversals. Every rise and fall is reflected in your emotional state: hope is replaced by fear, and when it passes, hope appears again. The market uses your fear to prevent you from taking advantage of a strong position. At such moments you are most vulnerable.
Everything will change if you use the Detector Fix indicator.
The Detector indicator was created t
Introducing our groundbreaking Forex indicator, specifically designed to help traders master the art of identifying critical support and resistance zones, as well as double top and double bottom patterns with unprecedented accuracy. Say goodbye to guesswork and hello to a powerful tool that will revolutionize your trading experience. Our proprietary indicator leverages cutting-edge technology to recognize key price levels where buying and selling pressures are poised to shift the market dynamics

The main purpose of this indicator is to determine the moments of entries and exits from transactions, so the Trend Factorial indicator displays only the trend line and entry points, i.e. it displays market entry points.
Despite the apparent simplicity of the indicator, it has complex analytical algorithms inside, with the help of which the system determines the moments of entries.
The indicator gives accurate and timely signals to enter and exit a trade that appear on the current candle.
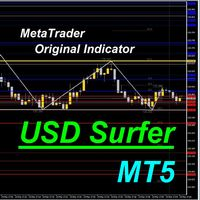
Based on data from the Bank for International Settlements, 78.8% of the world's major 8 currency pairs can be checked instantly. It tells you whether the U.S. dollar is being bought or sold in a matter of seconds. So, even in the fast-moving phase after the release of economic indicators, you can see the flow and pushes of the U.S. dollar,
We are live-streaming the actual operation of the system. Please check for yourself if it is usable. Please check it out for yourself. https://www.youtube.
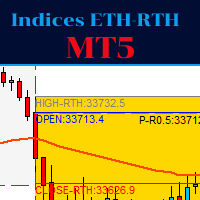
This indicator is for trading indices.
The RTH sessions (regular trading hours) where the underlying cash market is open are distinguished from ETH: for example for the American indices from 9:30 to 16:15 East Coast (New York) time, while for the Dax from 09:00 to 17:35 CET.
For the ETH session (outside RTH) the Fibonacci levels are plotted, as well as sensitive levels such as 25,50,75% retracement from the minimums and maximums.
Also for the RTH session the Fibonacci levels are graphed,

Very simple, yet powerful, indicator that helps you get notified every time a candle touches your trend line, horizontal line, and/or your rectangular. Powerful indicator yet very simple to use! All you need to do is draw your MT5 trend lines, horizontal lines, and/or rectangles and SmartLine takes care of notifying you the moment the current price touches one of your key levels! No brainer If you like the indicator, please leave a review and share the tool with your peers. WARNING: Please use t
FREE

Nadaraya-Watson Envelope Indicator convert to MT5 Nadaraya Watson Envelope Indicator is one of the monst popular indicator in TradingView. TradingView(Chrome, Edge) eats a huge of CPU, so I convert this to MT5 version.
As you can see the screenshot, it's good with Schaff trend RSI Indicator (or others) If you want to get Schaff trend RSI Indicator , Link: https://www.mql5.com/en/market/product/98011
Window Size - determines the window size for calculating smoothed values. A larger window

There are many linear regression indicators out there, most of them draw lines or channels, but this one actually draws a chart. The beauty of the indicator like Heiken Ashi is it removes a lot of market noise. 4 (OHLC) arrays are filled with Linear Regression(LR) values of each price for the LR period (default=14). The period of the Linear Regression is adjustable dependant on the market conditions. The SMA (default=14) also has period adjustment. Candles are generated with Green for 'Up' cand
Schaff trend RSI indicator (It is related with EMA and RSI) It is suited for sub-Indicator to undertand trend(or direction change)
As you can see the screenshot, it's good with Nagaraya-Watson Envelope Indicator (or others) I am using this indicator as Screenshot setting. (Schaff value is default value. 23, 50, 9, close) If you want to get Nagaraya-Watson Envelope, Link: https://www.mql5.com/ko/market/product/97965

The Super Trend is one of the best trend-following indicator for MT5 platforms. It's working fine for real-time trend alerts and accurate signals and it help to identify the best market entry and exit positions. This indicator is the tool you can refers to a trend following overlays. It contains two major parameters: the period and the multiplier. Besides, traders should consider default values that include 10 for every true range aтd 3 for the multiplier. 2 Types TP SL you set in input Point

The Off Trend MT5 Forex Indicator is a trend-following tool. Its signals are presented in the cloud. When the cloud is green, the trend momentum is bullish, and traders should take buy opportunities. Conversely, the trend momentum is bearish when the cloud is pink, and traders should take sell opportunities. The Off Trend mt5 Forex Indicator fits all timeframes and mt4 currency pairs.

--- StudentK RVI --- 1. Advanced strategy based on RVI 2. EA adapted (especially for StudentK's EA)
--- Context --- StudentK is not indicated as a master or K Sir for knowledgeable person who claims for winning all the time. (But lots of traders should know the fact that it is rarely truth, especially in fluctuated period of time)
StudentK is a group of years-experienced traders who want to share amazing tools in Free and Paid versions. Aiming helping people getting out of "The Rat Race" by
--- StudentK CCI --- 1. Advanced strategy based on CCI 2. EA adapted (especially for StudentK's EA)
--- Context --- StudentK is not indicated as a master or K Sir for knowledgeable person who claims for winning all the time. (But lots of traders should know the fact that it is rarely truth, especially in fluctuated period of time)
StudentK is a group of years-experienced traders who want to share amazing tools in Free and Paid versions. Aiming helping people getting out of "The Rat Race" by

--- StudentK MACD --- 1. Advanced strategy based on MACD 2. EA adapted (especially for StudentK's EA)
--- Context --- StudentK is not indicated as a master or K Sir for knowledgeable person who claims for winning all the time. (But lots of traders should know the fact that it is rarely truth, especially in fluctuated period of time)
StudentK is a group of years-experienced traders who want to share amazing tools in Free and Paid versions. Aiming helping people getting out of "The Rat Race"
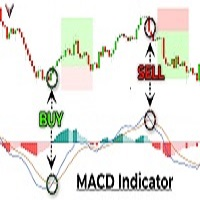
The MACD Gold Scalping Indicator is a powerful tool designed to help traders like you extract profits from the gold market. This indicator is based on the popular Moving Average Convergence Divergence (MACD) indicator, but it's been customized specifically for trading gold. When you use this indicator, you'll be able to quickly identify key entry and exit points in the gold market. It uses a combination of trend analysis, momentum indicators, and support and resistance levels to generate highly

Market Viewer gives a quick glance on correlation and direction. This indicator takes a list of symbols (max 8) Leave a symbol setting empty if you wish not to use that many - like in the defaults… It will check for each timeframe (Monthly, Weekly, Daily, H4, H1, 30min, 15min, 5min and 1min) if the current candle on that timeframe is bullish or bearish. This will give a good indication of the direction for us to trade in. We need to be in sync with the bigger timeframes.
Le MetaTrader Market est un magasin unique de robots de trading et d'indicateurs techniques.
Lisez le mémo de l'utilisateur de MQL5.community pour en savoir plus sur les services uniques que nous offrons aux traders : copie des signaux de trading, applications personnalisées développées par des freelancers, paiements automatiques via le système de paiement et le MQL5 Cloud Network.
Vous manquez des opportunités de trading :
- Applications de trading gratuites
- Plus de 8 000 signaux à copier
- Actualités économiques pour explorer les marchés financiers
Inscription
Se connecter
Si vous n'avez pas de compte, veuillez vous inscrire
Autorisez l'utilisation de cookies pour vous connecter au site Web MQL5.com.
Veuillez activer les paramètres nécessaires dans votre navigateur, sinon vous ne pourrez pas vous connecter.