MetaTrader 5용 새 기술 지표 - 18

Product Overview:
Extreme Confirmation is a sophisticated oscillator designed to filter market noise and provide clear, visual confirmation of trend direction and potential reversal points. By combining dual-period momentum analysis with a dynamic signal cloud, this indicator helps traders identify high-probability entry and exit zones. Key Features: Dual-Line Crossover: Utilizes a Fast (13) and Slow (34) period calculation to identify trend shifts early. Dynamic Momentum Cloud: The colored

The indicator reads MT5’s built-in economic calendar and organizes events into three horizontal lanes : High-impact events (red) Medium-impact events (orange) Low-impact events (gray) (optional) Each lane scrolls horizontally across the chart like a ticker. You can choose whether to show: Today’s events only Or all events for the current week This is a complete fundamental dashboard for MT5. It gives you: Real-time scrolling economic events
Interpreted color-coded results
Day/Week filterin
Delta + CVD & CVD Candles
Order-flow indicator combining Delta (Ask–Bid), Cumulative Volume Delta (CVD), and a unique CVD-based synthetic candle system. Shows buy/sell pressure, volume aggressiveness, and momentum shifts with optional Delta histogram, CVD line, and CVD+Delta combined candles. Useful for scalping, intraday trading, divergence detection, and understanding buyer/seller dominance. Overview The Delta + CVD & CVD Candles Indicator combines multiple order-flow tools into one clean
Indicator logic (quick summary) Retail sentiment input : You type in current retail long % from MyFxBook/FXSSI/etc. If > 60% long → contrarian bearish If < 40% long → contrarian bullish Else → neutral Trend bias : EMA(50) vs EMA(200) → primary trend MACD(6,13,5) direction as confirmation Volatility bias : ATR(14) vs ATR(50) → expansion ratio Too low/too high volatility → “AVOID” Session bias : Time-based classification (server time): Asia, London, New York Just a label + “quality fact

TScalper: The "Plug-and-Play" Scalping Solution Stop guessing the trend and start seeing it. TScalper is a non-repainting indicator that visualizes the invisible forces of market momentum. What it does:
It projects a "Sentiment Cloud" on your sub-window.
Green Fill: Buyers are in control. Look for Longs.
Red Fill: Sellers are in control. Look for Shorts. Why TScalper? Locked & Loaded: No confusing settings or inputs. We have tuned the internal algorithms for maximum efficiency

Here's a simple description for your indicator: FVG & CHOCH Detector - Visual Indicator for MT5 A clean and simple visual indicator that detects Fair Value Gaps (FVG) and Change of Character (CHOCH) patterns on any timeframe. Features: Bullish FVG Detection : Identifies bullish fair value gaps and marks them with blue boxes Bearish FVG Detection : Identifies bearish fair value gaps and marks them with red boxes CHOCH Detection : Detects trend changes with visual markers: Bullish CHOCH (cyan/aqua
1. Introduction This document explains how to use the CVD (Cumulative Volume Delta) + Delta Volume Histogram indicator. It covers setup, features, trading logic, and best practices. 2. What the Indicator Shows - Delta Histogram: Displays per‑bar delta (buy volume – sell volume) as green/red bars. - Helps identify market pressure, absorption, reversal signals, and trend strength. 3. How to Add Indicator in MT5 1. Open MT5. 2. Go to File → Open Data Folder. 3. Navigate to MQL5 → Indicators. 4. Pa
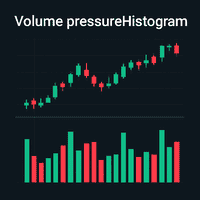
1. Overview The Volume Pressure Histogram (VPH) is a custom indicator for MetaTrader 5 (MT5) that measures buying and selling pressure based on tick or real volume. It highlights extreme buying/selling moments and provides a smoothed signal line for trend detection. 2. Indicator Components · Volume Pressure Histogram (Colored): o Green: Extreme buying pressure o Lime: Buying pressure o Red: Extreme selling pressure o Yellow: Selling pressure · Signal Li

Projected Moving Average A clean and practical moving-average tool designed for traders who want a clearer view of short-term and medium-term trend direction. The Projected Moving Average shifts a standard SMA forward by half of its period, creating a smooth projection zone that updates dynamically with each new candle.
This makes it easier to visually anticipate where the moving average is heading without repainting past values. Key Features Forward-shifted SMA (Length/2) for clearer trend

Product Name: SavasaLaS Tutelage | Pro Price Action Compass Stop guessing. Start trading with Confluence. SavasaLaS Tutelage is not just an indicator; it is a complete trading system designed for the serious Price Action trader. It eliminates chart noise by strictly enforcing the three pillars of institutional trading: Market Structure , Trend Direction , and Candlestick Verification . Unlike standard indicators that flood your chart with weak signals, SavasaLaS Tutelage waits for the "Perfect O
FREE

# Product Name: SamuraiFX Pro Volume Profile & Signals (MT5) **Stop Trading Blindly. See Where the "Smart Money" is Moving. ** Most indicators only tell you *when* price moved. **SamuraiFX Pro** reveals *where* the volume actually is. This institutional-grade tool combines **Volume Profile**, **VWAP**, and **Price Action Analysis** into one clean, non-repainting chart overlay. It automatically detects the daily market structure and provides high-probability **Buy & Sell arrows** based on institu

**Zonar Smart Analysis** is a complete "Smart Money" trading system designed for MetaTrader 5. It automates the classic **Opening Range Breakout (ORB)** strategy while filtering false signals using advanced Price Action algorithms (Wick Rejection & Swing Analysis). Stop guessing where the session is going. Let Zonar draw the zones, identify the breakout, and highlight institutional Order Blocks for maximum confluence. ### Key Features * **Automated ORB Box:** Automatically detects the Market
# ** Multi-Timeframe Fibonacci Levels Pro**
** Transform Your Trading with Institutional-Grade Fibonacci Analysis **
Multi-Timeframe Fibonacci Levels Pro is a revolutionary MetaTrader 5 indicator designed for day traders and scalpers. It automatically calculates and displays Fibonacci retracement levels from multiple higher timeframes directly on your 1-5 minute charts, giving you complete market structure visibility without switching between timeframes.
---
## ** Key Features**
*

OHLC & Smart Sessions
"Professional Market Structure Tool: Combine Daily OHLC Levels with Real-Time Session Analysis"
DESCRIPTION Professional trading indicator that combines Previous Day OHLC analysis with intelligent trading session tracking. Identifies key market structure levels, session highs/lows, and provides multi-channel alerts for precise trading decisions.
FULL DESCRIPTION
TRANSFORM YOUR TRADING WITH INSTITUTIONAL-GRADE ANALYSIS
Are you tired of manually drawing daily level
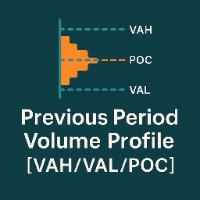
Previous Period Volume Profile [VAH/VAL/POC] — Professional Institutional-Level Reference Levels Previous Period Volume Profile gives traders instant visual access to the most important volume-based levels from the prior session: Point of Control (POC) , Value Area High (VAH) , and Value Area Low (VAL) .
These levels are widely used by professional traders to anticipate liquidity magnets, rotation zones, high-probability reversals, and continuation setups. Unlike full histogram packages that
ADX Wilder (Average Directional Movement Index by Welles Wilder) enhanced with fully customizable pop-up and push notifications. Get instant alerts directly on your platform and mobile device when: +DI crosses above –DI → Potential bullish trend start –DI crosses above +DI → Potential bearish trend start ADX crosses above your chosen strong-trend level (default 25) → Confirmation of strong trending market Features: 100% identical to the original MetaQuotes ADX Wilder calculation Clean, visible
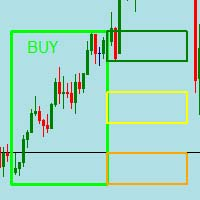
This is a simple indicator that indicates possible buy or sell trades. Apply indicator to chart and wait for retest to zones, apply with your risk management and own trend analysis and you can be profitable. This work best on the 5 minute timeframe. Apply to chart, you will then be able to change, switch times when blocks must appear on and off. You can fully customize the indicator at the input setting so make sure to take a look, you can adjust it to your preference.
when block closes ( bu

MercariaPattern1-2-3 відстежує рух ціни, знаходить трьоххвильові структури 1-2-3 та підсвічує момент, коли сценарій підтверджується пробоєм ключового рівня. MercariaPattern1-2-3 tracks price movement, detects three-leg 1-2-3 structures and highlights the moment when the scenario is confirmed by a key level breakout. Індикатор збирає локальні свінги в компактну фігуру 0–1–2–3 , чекає підтвердженого пробою та будує стрілку входу з готовими рівнями SL/TP. The indicator combines local swings into a

SMART STRUCTURE: 기관 분석을 위한 궁극의 도구 (SMC) 스마트 머니가 시장을 보는 방식으로 관찰하십시오. 단순히 기회를 알려주는 것을 넘어, 스마트 머니 분석(SMC)을 완전히 자동화 하고 시장의 구조적 견고함을 실시간으로 드러내는 오류 없는 트레이딩 조수가 있다고 상상해 보십시오. 그것이 바로 SMART STRUCTURE 입니다. 이것은 단순한 또 하나의 신호가 아닙니다. MetaTrader 5용으로 개발된 전문 분석 엔진으로, 시장 구조와 고확률 영역을 즉시 매핑하여 기관 트레이더와 같은 명확성과 정확성을 제공합니다. 결정적인 우위를 제공하는 핵심 기능 수동으로 차트를 그리는 것은 잊으십시오. SMART STRUCTURE는 가장 복잡한 분석을 자동화하여 사용자가 실행에 집중할 수 있도록 합니다. 동적 구조 매핑(Dynamic Structural Mapping): 주요 포인트를 자동으로 식별합니다. 최적화된 로직으로 **BOS (Break of Structure -

VIP Scalper는 정확한 신호, 최소 손절폭, 높은 안정성을 필요로 하는 트레이더를 위해 설계된 전문 Forex 스캘핑 지표입니다.
이 지표는 M1 차트에 최적화되어 있으며, 낮은 스프레드와 높은 변동성을 가진 통화쌍에서 뛰어난 성능을 발휘합니다. 주요 장점 고정밀 스캘핑 신호 손절 2–3핍, 익절 최대 10핍 트렌드 필터로 인해 오신호 최소화 주요 매개변수 1개만 사용하는 간단한 구조 EURUSD, GBPUSD, AUDUSD, EURJPY 등에서 작동 전략 테스터 및 EA와 호환 VIP Scalper가 효과적인 이유 알고리즘은 가격의 국소 구조를 분석하고 시장 잡음을 제거하여, 지속 가능성이 높은 진입 지점만을 식별합니다. 초보자와 숙련된 스캘퍼 모두에게 적합합니다. 트레이딩 권장 사항 시간 프레임: M1 SL: 2–3핍 TP: 약 10핍 손절 이동: 이전 캔들의 고점/저점 최적 종목: 낮은 스프레드, 높은 유동성 통화쌍 VIP Scalper는 안정적인 Forex 스캘핑 성

Haven Bar Replay — 당신만의 개인 트레이딩 시뮬레이터 소개합니다. Haven Bar Replay 는 수동 매매 연습과 전략 테스트를 위한 전문 시뮬레이터입니다. 이 도구는 MT5 차트를 과거 데이터 플레이어로 변환하여, 수개월 분량의 시장 움직임을 단 몇 분 만에 경험하게 해줍니다. 저의 다른 제품 확인하기 -> 여기를 클릭하세요 . 수익 내는 트레이딩을 배우고 싶지만, 진입 패턴(셋업)이 형성될 때까지 몇 시간씩 기다리기 힘드신가요? 이 도구는 바로 당신을 위해 설계되었습니다. 실제 시장처럼 과거 데이터를 사용하여 안목을 기르고, 가설을 검증하며, 실력을 연마하세요. 왜 Haven Bar Replay가 모든 트레이더에게 필수일까요? '차트 우측 가리기' 효과
지표가 '미래(실제 캔들)'를 완전히 숨기고 시뮬레이션된 부분만 보여줍니다. 당신은 미래의 움직임을 미리 보지 않고 정직하게 의사결정을 내릴 수 있습니다. 완벽한 시간 통제
지루한 횡보 구간은 빨리
FREE
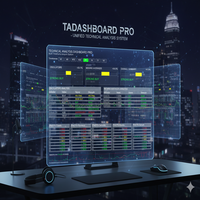
Technical Analysis Dashboard Pro (TADashboard Pro) – 통합 기술 분석 시스템 TADashboard Pro 는 여러 지표와 시간대를 하나의 시각적 인터페이스로 통합한 고급 기술 분석 패널입니다. 정확성과 효율성 을 요구하는 트레이더를 위해 설계된 이 시스템은 8가지 다른 시간대 에 걸쳐 7가지 오실레이터와 4가지 이동 평균 을 동시에 분석하며, 의사 결정을 단순화하는 정규화된 점수를 생성합니다. 주요 특징: 다중 시간대 분석 (Multi-Timeframe Analysis): 통합된 시각적 선택기로 M1, M5, M15, M30, H1, H4, D1, W1 기간을 쉽게 모니터링합니다. 고급 스코어링 시스템 (Advanced Scoring System): 오실레이터, 이동 평균, 그리고 전체 평가에 대한 독립적인 점수 ( $-100$ 에서 $+100$ ). 포함된 지표 (Included Indicators): RSI, MACD, Stochastic
FREE
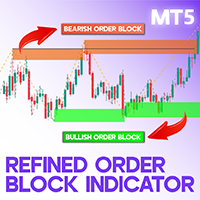
Refined Order Block Indicator for MT5 Designed around ICT and Smart Money strategies, the Refined Order Block (OBR) indicator is an essential tool for traders on the MetaTrader 5 (MT5) platform. It identifies and highlights key price levels by marking bullish order blocks in green and bearish order blocks in brown. These levels represent potential price reversal zones , often influenced by large institutional and bank orders. When the price reaches these critical areas, it may experience signifi

골드 & 통화 강도 분석 스위트 (MT5)
8개 통화 및 금에 대한 실시간 통화 강도 분석, 상관관계 추적, 세션 기반 트레이딩 인텔리전스를 위한 전문적인 7탭 대시보드.
개요
통화 강도 분석 스위트는 7개의 전문 패널(강도 측정기, 세션 성과, 페어 스캐너, 분석 탭, 상관관계 매트릭스, 상관관계 클러스터, 설정)을 통해 포괄적인 다중 통화 분석을 제공합니다. 이 시스템은 RSI 모멘텀, SMA 추세 확인, ATR 변동성 측정을 활용해 -10에서 +10까지의 척도로 강도를 추적합니다.
대시보드는 사용자 지정 가능한 시간대(H1/H4/D1)에 걸쳐 모든 페어의 실시간 강도 차이를 표시하고, 신호를 자동 분류(강력 매수/매도, 보통, 반전)하며, 원클릭 차트 전환 기능을 제공합니다. 상관 행렬은 모든 통화 간의 관계(-1.0 ~ +1.0)를 보여 중복 거래를 방지하고 헤징 기회를 식별합니다.
탐지 시스템에는 GAP 경고(강도 점프 ≥3.0 포인트), 발산 탐지(

Korean (한국어) ICT_SuperTrend 는 트레이더가 시장의 전체 흐름을 한눈에 파악할 수 있도록 설계된 "올인원" 도구입니다. 주요 장점은 다음과 같습니다: 하이브리드 트레이딩 시스템 **추세 추종(Trend Following)**과 **스마트 머니 컨셉 / ICT(가격 구조)**의 결합이 가장 큰 장점입니다. SuperTrend: 시장의 주요 방향(매수/매도)을 알려줍니다. ICT 컨셉: 지지/저항선과 같은 구조적 핵심 지점을 식별합니다. 명확한 진입 및 청산 시점 화살표 신호 가 추세 변화를 명확히 알려줍니다. SuperTrend 라인 은 동적 지지/저항 역할을 하며, 수익을 확정하기 위한 **트레일링 스톱(Trailing Stop)**으로 활용하기 좋습니다. 자동 유동성 레벨 탐색 (Liquidity Levels) 주요 **스윙 하이/로우(Swing Highs/Lows)**를 자동으로 스캔합니다. BSL (매수 측 유동성): 상단 저항. SSL (매도 측 유동성):

The official release price is $65 only for the first 10 copies, the next price is $125 Gold Scalper System is a multifunctional trading system that combines a breakout strategy for key liquidity levels with confirmation and a built-in Smart DOM Pro module for market depth analysis. The system identifies zones of limit order accumulation, tracks activity at support and resistance levels, and generates signals at the moment of their breako

[ 내 채널 ] , [ 내 제품 ] Lorentzian Distance Classifier는 머신러닝 기반 트레이딩 지표로, 근사 최근접 이웃(ANN) 프레임워크 내에서 로렌츠 거리(Lorentz distance)를 핵심 지표로 사용합니다. 기존의 유클리드 거리 대신, 금융 가격 움직임을 “왜곡된” 가격-시간 공간에서 발생하는 것처럼 처리합니다(상대성이론에서 거대한 물체가 시공간을 휘게 만드는 것과 유사). 이러한 접근 방식은 시장 노이즈, 이상치, 이벤트로 인한 왜곡(FOMC, 지정학적 충격 등)에 훨씬 더 강하며, 유클리드 거리 기반 방법들이 시간에 따라 포착하지 못하는 과거의 유사한 가격 움직임을 인식할 수 있도록 합니다. 이 지표는 종가 기준 캔들에서 명확한 **리페인트 없음(non-repainting)** 신호를 제공하며, 바로 사용할 수 있는 버퍼를 제공합니다. 기능
RSI, WaveTrend, CCI20, ADX를 조합할 수 있습니다.
총 다섯 개의 슬롯이 제공되며 —

앵커 VWAP(Anchored VWAP) 앵커 VWAP는 기존 VWAP의 변형으로, 거래 세션 시작이나 고정된 시간 간격이 아닌 특정 시점(앵커)에서 지표 계산을 시작합니다. 이는 주요 뉴스, 트렌드 시작, 지지선 또는 저항선 돌파와 같은 기술적 이벤트와 같은 특정 사건부터의 가격과 거래량 간의 관계를 평가하려는 트레이더에게 유용할 수 있습니다. 이 지표는 외환, 주식 및 지수에서 사용 가능합니다. 동일한 차트에 여러 인스턴스를 추가하고 각 VWAP의 앵커 지점을 클릭 한 번으로 수정할 수 있습니다. 가격이 VWAP에 도달할 때 알림을 활성화하십시오. VWAP는 "자성"을 가지고 있습니다: 캔들 위에 마우스를 올리면 HIGH로, 중앙에 두면 TYPICAL로, 캔들 아래에 두면 LOW로 자동 설정됩니다.

Buyer Seller Balance Analyzer 는 여러 타임프레임에서 매수자와 매도자의 힘을 종합적으로 보여줍니다. 주요 구성 요소: Buyer/Seller Balance 표 매수자와 매도자의 비율 표시 M1부터 MN1까지 모든 타임프레임 포함 색상 구분 (녹색 = 매수자, 빨강 = 매도자) 핵심 지표: Buyers (%) – 매수자 비율 Sellers (%) – 매도자 비율 ️ Balance – 매수자와 매도자의 차이 Strength – 추세 강도 (STRONG/MEDIUM/WEAK) Volume – 거래량 표시 (HIGH/normal) 추가 기능: 이동평균선 (8, 21, 50, 100, 200) 현재 가격을 표시하는 수평선 높은 거래량 강조 표시 신호 해석: 강한 추세: Balance 가 크게 양수 (진한 녹색) → 강한 상승 추세 Balance 가 크게 음수 (진한 빨강) →

바이너리 옵션용 신호 인디케이터로, 포렉스 및 기타 시장에서도 효과적으로 사용할 수 있습니다. M1–M5 단기 그리드 매매에 적합하며, 단계적인 포지션 증액 신호를 포함합니다. 인디케이터는 2단계 적응 방식을 사용합니다. 첫 번째는 기본 속도 프로파일(시작 단계에서 “빠르게/부드럽게” 모드 선택), 두 번째는 거래 결과에 기반한 자동 적응으로, 승리·손실 신호의 연속을 고려하여 현재 시장에 맞게 필터를 조정합니다. 모델은 차트에서 짧은 방향성 충격(임펄스)을 탐지하고, 바가 마감될 때 CALL(매수)과 PUT(매도) 화살표로 표시하며, 리페인트는 없습니다. 인디케이터는 일반 Forex/CFD 계좌에서도 사용할 수 있지만, 거래 기간이 짧기 때문에 스프레드와 수수료를 철저히 관리하여 비용이 움직임의 대부분을 “잠식”하지 않도록 해야 합니다. 동작 방식 표준 클래식 보조지표 조합 대신, 자체 개발한 다단계 적응형 예측 모델을 사용; 가격 움직임의 형태와 기울기, 추세 및 국부 변동성을

분석 대시보드는 과거 및 현재 거래를 분석하고, 추가 원형 차트를 통해 세부 정보 보기로 볼 수 있는 분석 대시보드를 제공하는 지표입니다.
주로 네 가지 분석 범주가 고려됩니다. 1) 성과 지표 2) 거래 행동 지표 3) 실행 품질 지표 4) 포지션 수준 지표.
네 가지 일반적인 분석 지표는 아래와 같이 더욱 구체적인 지표로 세분화됩니다.
성과 지표:
총이익 총손실 전체 이익률 전체 기대수익률 전체 승률 평균 위험 보상률 최대 손실률 최대 상승률 이 모든 지표는 원형 차트를 통해 표시되는 차트별 지표도 있습니다.
거래 행동 지표:
총 거래 총 수익 총 손실 총 평균 보유 시간 사용된 평균 거래 규모 손절매로 중단된 총 거래 손절매로 중단된 총 거래 총 수동 손절매 이러한 지표는 사용된 평균 거래 규모를 제외하고 차트별로 표시됩니다.
실행 품질 지표:
평균 슬리피지 평균 진입 스프레드 평균 청산 스프레드 총 수수료 + 스왑 수수료 총 이익에 미치는 영향 총 손실에 미치
FREE
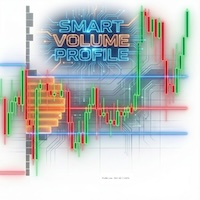
Korean "Smart Money" 스캔 (Volume Markers): 평균보다 높은 비정상적인 거래량을 녹색/빨간색 화살표로 명확하게 표시합니다. 이는 **세력(Smart Money)**의 진입을 식별하고 속임수 신호 를 걸러내는 데 도움을 줍니다. 주요 알림 (Alerts): 하루 종일 화면을 지켜볼 필요가 없습니다. 가격이 추세의 지속 또는 반전을 결정하는 중요한 지점인 **POC(매물대 중심)**를 교차할 때 시스템이 즉시 알림을 보냅니다. 실시간 시장 구조 확인 (Developing Profile): 현재 형성되고 있는 가격 주기의 프로필을 보여줍니다. 가격이 매집 구간 을 돌파하고 있는지, 아니면 평균으로 다시 회귀 하고 있는지 파악할 수 있습니다. thank you ..
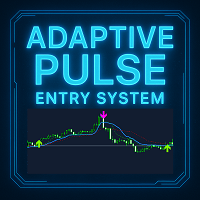
Adaptive Pulse - 전문 트레이딩 신호 시스템 간략한 설명 Adaptive Pulse는 적응형 시장 분석 기술을 기반으로 한 전문 트레이딩 신호 지표입니다. 이 지표는 자동으로 변동성에 적응하며 차트상에 시각적 화살표로 정확한 매수 및 매도 신호를 생성합니다. 모든 시간프레임과 금융상품에서 작동합니다. 주요 기능 이 지표는 각각 현재 시장 상황에 맞춰 조정되는 3개의 독립적인 적응형 라인을 갖춘 3단계 분석 시스템을 제공합니다. 시스템은 두 가지 유형의 트레이딩 신호를 생성합니다: 가격이 메인 라인과 교차할 때와 빠른 라인과 느린 라인이 서로 교차할 때입니다. 핵심 기능: 삼중 적응형 분석 시스템 두 가지 독립적인 트레이딩 신호 유형 내장된 장기 추세 필터 자동 모드를 갖춘 반복 신호의 스마트 필터링 시각적 매수 및 매도 화살표 현재 시장 상태를 표시하는 정보 패널 알림 시스템: 팝업 창, 사운드, 푸시 알림, 이메일 완전한 시각적 사용자 정의 작동 원리 이 지표는 시장
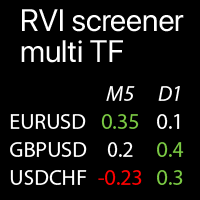
선택된 심볼에 대한 다중 시간대 RVI 값: 현재 시장 추세 비교 이 지표 는 상대 활력 지수(RVI) 값 을 모든 선택된 시간대 와 심볼 에서 단일 테이블 에 표시 하여 현재 시장 가격 추세 를 빠르게 분석 할 수 있게 합니다 . 나의 다기능 유틸리티 : 66+ 기능 | 문의하기 | MT4 버전 각 심볼 은 사용자 정의가 가능합니다: 제거하거나 교체할 수 있습니다. 최대 40개의 심볼을 추가할 수 있습니다. 패널은 차트의 어느 곳으로든 이동할 수 있습니다 (아무 곳이나 드래그).
입력 설정 에서 다음을 구성할 수 있습니다: RVI 지표 설정: MA 기간, 표시 데이터: "신호" 또는 "값". 각 시간대 를 활성화/비활성화할 수 있습니다 . 강조 옵션: 활성화된 경우 - 극단 수준이 사용자 정의 색상으로 강조 표시됩니다. 극단 수준 설정: 높은 값 및 낮
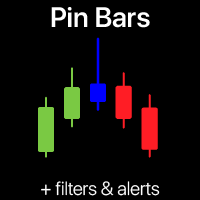
핀 바 패턴 스캐너 | 스마트 알림 및 트렌드 필터 높은 확률의 핀 바 반전 신호를 다시는 놓치지 마세요! 이 자동화된 핀 바 패턴 스캐너가 어려운 작업을 대신해 드립니다.
이 트레이딩 도구는 차트를 실시간으로 스캔하여 강력한 핀 바 (해머/슈팅스타) 패턴을 식별하고 즉시 신호를 보냅니다. 이 트레이딩 인디케이터는 추측 없이 순수 가격 행동의 힘을 활용하고자 하는 초보와 전문 트레이더 모두를 위해 설계되었습니다. 나의 다기능 유틸리티 : 이 인디케이터를 포함한 66+ 기능 | 문의하기 질문이 있으시면 | MT4 버전
핀 바 패턴이란 무엇이며 트레이딩에 왜 중요한가? 핀 바 (피노키오 바)는 가장 신뢰할 수 있고 인기 있는 가격 행동 패턴 중 하나입니다. 이는 강력한 가격 거부와 시장의 잠재적 반전을 신호합니다. 핀 바의 정의적 특징은 전체 바 길이의 최소 2/3 이상인 긴 꼬리와 반대쪽 끝에 있는 작은 몸통입니다. 강세 핀 바 (해머): 하락 추세 에서 형성됩니

Trading Report는 실시간으로 계좌와 트레이딩의 핵심 정보를 표시하는 가볍고 강력한 시각적 인디케이터입니다 — 모두 하나의 우아하고 완전히 드래그 가능한 미니멀 패널에 담겨 있습니다. 주요 기능 틱마다 업데이트 (오픈 포지션 및 실시간 P/L) 현재 포지션 정보 (BUY/SELL + 로트 + 진입가 + 실시간 손익 (초록/빨강)) 일일 손익 및 잔고 변화 (자동 색상: 초록=이익 | 빨강=손실 | 흰색=제로) 전체 통계: Balance, Equity, 총 거래수, 승/패, 승률(%), PF, 최고/최악 거래 “Report” 버튼 클릭으로 표시/완전 숨김 전환 버튼 드래그로 원하는 위치에 자유롭게 이동 사용 방법 원하는 차트에 인디케이터를 붙입니다 “Report” 버튼을 클릭하면 패널이 나타나고, 다시 클릭하면 완전히 사라집니다 버튼을 드래그해서 보고 싶은 위치로 자유롭게 이동하세요

Advanced SMC & Volumetric Order Block Indicator Overview
This enhanced-grade for MetaTrader 5 indicator is designed to decode market behavior using Smart Money Concepts (SMC) method . It goes beyond standard price action analysis by integrating Volumetric Data directly into market structure, helping traders identify high-probability reversal and continuation zones with precision. Key Features Volumetric Order Blocks: A unique, split-gauge visualization within Order Block zones that disp
FREE
Unlock Precision Trading: The ATR Dynamic Pivot System Download this free ATR Pivot Signals indicator and instantly gain an edge against market noise. This is the ultimate tool for traders who demand high-conviction entry points based on genuine market swing reversals, not guesswork. The ATR Pivot Signals system is an innovative technical indicator that utilizes the Average True Range (ATR) to dynamically filter volatility, ensuring that a signal is triggered only when a price move is
FREE

www tradepositive .lat ALGO Smart Flow Structure Indicator The ALGO Smart Flow Structure Indicator is designed for serious traders who use objective Market structure. Forget noise and slow indicators; this tool provides you with a crystal-clear, unambiguous view of structural breakouts across all timeframes. Based on the rigorous rules of the ALGO Smart Flow methodology, the indicator filters out internal structure and only shows you the Major Structural Points (Swing Points) , ensuring you
FREE
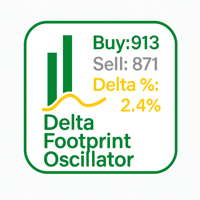
Delta Footprint Oscillator – Professional Order Flow Tool for MT5 The Delta Footprint Oscillator is a powerful order-flow indicator that lets you see buy/sell pressure directly inside your chart. It tracks micro-price movements tick-by-tick and calculates real-time Delta , Delta% , and a full per-bar footprint history .
Perfect for scalpers, day traders, volume/flow traders, and anyone who wants deeper insight into market aggression. Key Features Real order-flow delta from tick-based bid/ask m

Gamma & Volatility Levels Pro [XAUUSD Edition] – The indicator used by professional gold traders in 2025 Fully automatic indicator developed exclusively for XAUUSD (Gold). Displays in real time the most powerful institutional levels that move gold price every single day: • HVL (High Volatility Level) – Orange dashed line Dynamic extreme volatility level (20-period SMA + 1 standard deviation). Gold bounces or breaks this level 87 % of sessions with moves of +$40 to +$120. • CALL RESISTANCE – Blue
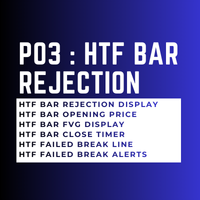
My other indicators: https://www.mql5.com/en/market/product/156702 https://www.mql5.com/en/market/product/153968 (FREE) https://www.mql5.com/en/market/product/153960 (FREE)
This indicator displays higher timeframe candles directly on your lower timeframe chart. It allows you to monitor higher timeframe price action without switching between charts. What This Indicator Does: The indicator places candles from a selected higher timeframe (such as H4, Daily, or Weekly) onto your current chart. This
FREE
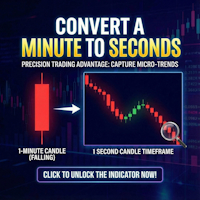
Second Timeframe Pro — See the Market Before Anyone Else!
Unlock a Hidden Level of Price Action
While other traders look at minute candles, you can see 60 candles within each minute!
What is Second Timeframe Pro?
It's a revolutionary indicator that creates full-fledged candlestick charts with second timeframes directly in MetaTrader 5.
Standard MT5 limits you to a minute chart. But the market doesn't stop every minute — it pulsates every second. Second Timeframe Pro removes this limitation
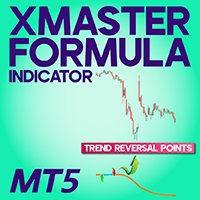
XMaster XHMaster Formula MT5 Indicator – No Repaint Strategy The XMaster / XHMaster Formula Indicator for MetaTrader 5 (MT5) is an upgraded version of the popular MT4 tool, designed to detect trend direction, momentum shifts, and high-probability reversal zones. With enhanced optimization for the MT5 engine, the indicator delivers stable No Repaint signals and performs efficiently on multiple asset classes including Forex, Gold, Cryptocurrencies, and Indices. The MT5 version integrates improved
FREE
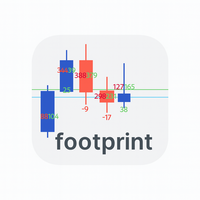
Footprint_Indicator_Fixed is a lightweight yet powerful footprint tool designed for traders who want real-time insight into market microstructure.
This indicator displays buy/sell tick counts and delta values directly on each candle, helping you instantly see which side of the market is dominant. Key Features ️ Real-time tick-based buy/sell volume counting ️ Delta footprint displayed underneath each candle ️ Clean and simple on-chart text objects—no buffers, no clutter ️ Automatic management
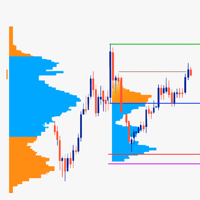
Daily Volume Profile (Multi-Day) for MT5 This indicator provides a clean, fast and highly optimized Daily Volume Profile for the last N days , updated automatically every minute without flickering or chart lag.
It draws full market structure: POC, VAH, VAL, Value Area, Day High/Low, Volume Distribution Buckets , and adapts dynamically to any timeframe using built-in shifting logic. Key Features:
Volume Profile for the last N days (configurable)
True daily POC, VAH, VAL with automatic labels

SUP – Support & Resistance Zone Detection Tool
The SUP Indicator is a professional trading tool designed to automatically detect and highlight Support and Resistance price zones on any market chart. Using advanced zone-mapping algorithms, it visualizes the strongest price levels where the market frequently reacts — helping traders identify entries, reversals, breakouts, and risk-management areas.
In addition to automatic detection, the indicator also allows you to manually add your own zones,
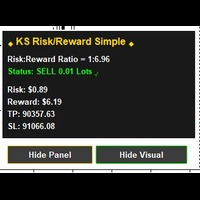
RR Ratio KS Simple Calculator Indicator Overview The RR Ratio KS Simple Calculator Indicator is a free, lightweight tool for MetaTrader 5 that automatically visualizes risk-reward (RR) ratios on your chart. Designed for manual traders and automated systems (EAs), it detects open positions with defined stop-loss (SL) and take-profit (TP) levels, then overlays clear visual zones to show potential risk and reward areas, including precise dollar amounts. This helps traders quickly assess trade setup
FREE

Mystic Pulse V2.0 is a trend-strength indicator built on the Directional Movement System (DI+ / DI−). It counts how many consecutive candles show increasing bullish or bearish momentum. Rising DI+ builds a Positive Count (uptrend pressure), while rising DI− builds a Negative Count (downtrend pressure). These counts reset when momentum weakens, giving a clear visual view of trend persistence and potential reversals. This MQL5 version is a conversion of the original TradingView script by chervolin
FREE

Candle Close Timer Matrix – MT5 Candle Countdown Indicator Candle Close Timer Matrix is a lightweight and powerful MetaTrader 5 (MT5) candle countdown indicator that shows exactly how many minutes and seconds are left before the current candle closes on any symbol and any timeframe. Live Signals & Products Whether you are a scalper , intraday trader or swing trader , knowing the exact candle close time helps you: Time your entries on candle close Avoid impulsive mid-candle decisions Sync your tr
FREE
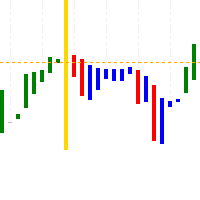
L3 Banker Fund Flow Trend Oscillator v5 is a simple translation of blackcat's work from pine script (language used by TradingView platform) to mql5. It generates buy and sell signals when two calculated buffers cross over each other in the oversold and overbought oscillator territory. Current version does not offer any changable inputs, but could be easily added in the modified version if requested.
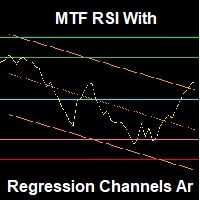
Note: The inputs of this indicator are in the Arabic language An advanced RSI indicator that displays dynamic linear regression channels in both the indicator window and the price chart, with predefined horizontal levels to detect overbought and oversold zones. Main Features (Summary): Synchronized linear regression channels on both price and RSI Multitimeframe support Smart and ready-to-use horizontal levels Professional design with optimized performance Feedback & Support We value your ex
FREE

Volatility Break Signals Description:
The Volatility Break Signals is an indicator designed to detect potential trend changes while partially filtering market noise. It uses an adaptive volatility measure based on the selected price (Close, Open, High, Low, etc.) and generates Buy and Sell signals when the price shows a reversal relative to the previous direction. How it works: Price Volatility Measurement The indicator calculates the absolute price changes from bar to bar ( |price - previous
FREE
RSI Bollinger DualStrike Signals offers a clear and structured approach to identifying areas that may be favorable for potential trend reversals. By combining the RSI with Bollinger Bands, the indicator highlights moments when price shows signs of pressure or loss of momentum. The BUY/SELL signals help traders make more organized and disciplined decisions. It is a useful tool for scalping, day trading, or swing trading not to predict the market, but to improve the reading and understanding of pr
FREE

Global Session 4X Indicator Global Session 4X is a visual indicator that displays active Forex trading sessions around the world in real time. Designed with precision and respect for market diversity, it covers financial hubs such as London, New York, Tokyo, Sydney, São Paulo, Istanbul, Riyadh, Toronto, and more. Each session is shown as a color-coded band highlighting the most traded currency pairs in that region. The layout is clean, modern, and fully customizable — traders can choose which se
FREE

STRAT Price Action Scanner – See the setup, size the risk, place the trade. Important
To place trades directly from the Trade Assistant panel, you must also install the STRAT Price Action Trade Manager EA (check the comment section) on the same terminal. The indicator sends the trade instructions; the EA is the component that actually places and manages the orders. Installation Instruction (please read) Guide to the STRAT Trading Strategy Why STRAT? Most price action trading is
FREE
ZigZag Reversal Detector Signals This is a technical indicator based on the ZigZag principle, designed to automatically detect market reversal points and generate clear buy and sell signals. Customizable Parameters ️: Level : Determines the sensitivity of the ZigZag to price changes. Ecart : Sets the minimum distance between two ZigZag points. Rebond : Adjusts the confirmation threshold for a reversal. Alerts & Notifications : Enable or disable according to your needs. Pe
FREE

Trading Sessions by Mahefa R is an indicator for MetaTrader 5 that visually identifies the four main trading sessions: New York, London, Tokyo, and Sydney . Designed to provide a clean, intuitive, and professional market view, it highlights the most active periods of the Forex market using smart visualization of session ranges , session-specific candle colors , and daily separators . Main Features: Automatic detection of the 4 major sessions New York London Tokyo Sydney Each session is fully c
FREE
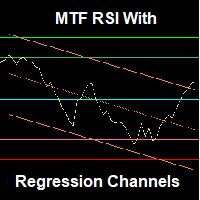
An advanced RSI indicator that displays dynamic linear regression channels in both the indicator window and the price chart, with predefined horizontal levels to detect overbought and oversold zones. Main Features (Summary): Synchronized linear regression channels on both price and RSI Multi–timeframe support Smart and ready-to-use horizontal levels Professional design with optimized performance Feedback & Support We value your experience! If you have any questions, suggestions, or encounter any
FREE

LIQUIDITY SWEEPS INDICATOR - MT5 Advanced Smart Money Concept Tool
OVERVIEW
The Liquidity Sweeps Indicator is a professional-grade MT5 tool designed to identify institutional liquidity grabs and stop-hunt patterns. Based on ICT (Inne
FREE
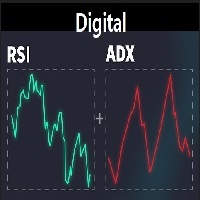
A lightweight digital indicator that combines the most important momentum tools directly on the chart. It displays real-time values of RSI, ADX, +DI, −DI, and DI Spread in a clean and compact format, without drawing any lines or graphical objects on the chart. Designed to provide fast insight into trend strength and the balance between buyers and sellers, without the need to open additional indicator windows. Fully customizable—font, size, and screen position can be adjusted easily.
FREE

Metatrader 5 version of the known "Currency Slope Strength" MT4 indicator. This tool was designed to visually measure the strength of major global currencies in real time, allowing to identify trending currencies, reversals, and cross-currency opportunities. Currencies: AUD, CAD, CHF, EUR, GBP, JPY, NZD and USD.
Level Crossing alerts (Pop-up,Push,Email). Customizable timeframes (Main and Extra). Customizable colors. Non-repainting . The indicator runs in Strategy Tester, but it may take a while

Instant Pitchfork is built for traders who rely on quick and precise pitchfork trend structures to plan entries, stops, and targets. Click an anchor on the chart and Instant Pitchfork automatically draws the best-fit Andrews’ Pitchfork for the current market structure.
Click the anchor again to instantly switch between Andrews’, Schiff, and Modified Schiff pitchfork modes to find the best structural fit in seconds. Works on any symbol and any timeframe.
Instant Pitchfork — Quick Manual 1. Atta

BOS and CHoCH Detector is an indicator designed to detect BOS (Break of Structure) and CHoCH (Change of Character) within the Smart Money Management strategy. It helps traders get a clearer view of the market on the chart and optimize their trading strategy. An additional advantage of this indicator is its color system: Green : signals a high probability of a buy opportunity. Red : signals a high probability of a sell opportunity. This tool is perfect for gaining clarity and confidence in your t

Overview Market Volume Profile Modes is a powerful MT5 volume distribution indicator that integrates multiple Volume Profile variants. Users can switch between different analysis modes through a simple menu selection. This indicator helps traders identify key price levels, support and resistance zones, and market volume distribution.
Core Concepts • POC (Point of Control): The price level with the highest volume concentration, representing the market's accepted "fair value" area • VAH (Value A
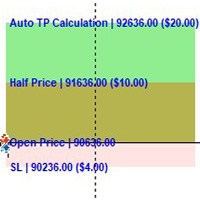
RR Ratio KS Visual Calculator Unlock effortless risk-reward mastery with the RR Ratio KS Visual Calculator —a sleek, professional MetaTrader 5 indicator that automates TP/SL calculations and delivers crystal-clear visual setups directly on your chart. No more tedious manual math or miscalculations: it instantly computes precise dollar amounts based on your lot size and position direction (buy/sell), displaying interactive lines for TP, SL, half-price targets, and open levels. Perfect for traders

VOLUMIZED ORDER BLOCKS [Riz] - MT5 Indicator Smart Money Order Block Detection with Volume Analysis
Volumized Order Blocks is an advanced Smart Money Concepts (SMC) indicator that automatically detects institutional order blocks with integrated volume analysis. It identifies high-probability supply and demand zones where banks and institutions
FREE

Product Name: Combined KD Enhanced Multi-Signal Stochastic Indicator Core Benefits: - **Signals in 1 Glance**: Red (buy) / green (sell) arrows + dual curves; auto-marked 20/80 overbought/oversold zones – no complex math needed. - **All-Market Fit**: Default KD(9,3,3); customizable settings work for stocks/forex/futures (any MT5 timeframe: M1-MN1). - **Lag-Free Performance**: 20% faster than official MT5 Stochastic – smooth loading even on large historical datasets.
Key Features: - Intui

HolyGrail M N/B: All our product purchase comes with our free ‘’DAILY SCALPER EA’’ - bit.ly/4qlFLNh Whatsapp Developer for yours after successful purchase
m ost wanted Edition Overview ATTENTION ALL TRADERS!
FINALLY UNVEILED: The "HolyGrail MostWanted" Indicator - Your All-in-One Institutional Trading Dashboard for MetaTrader 5
SPECIAL BONUS (VALID TILL JUNE 2026)- OUR DAILY SCALPER EA for BTCUSD and VIX75 •·································································•
Volumized OrderBlocks MTF - Multi-Timeframe Volumetric Order Block Indicator
OVERVIEW
Volumized OrderBlocks MTF is an advanced Multi-Timeframe Order Block indicator that automatically detects, displays, and merges Order Blocks from up to 3 different timeframes on a single chart. Built with institutional Smart Money Concepts (SMC) method
FREE
MetaTrader 마켓은 과거 데이터를 이용한 테스트 및 최적화를 위해 무료 데모 거래 로봇을 다운로드할 수 있는 유일한 스토어입니다.
어플리케이션의 개요와 다른 고객의 리뷰를 읽어보시고 터미널에 바로 다운로드하신 다음 구매 전 트레이딩 로봇을 테스트해보시기 바랍니다. 오직 MetaTrader 마켓에서만 무료로 애플리케이션을 테스트할 수 있습니다.
트레이딩 기회를 놓치고 있어요:
- 무료 트레이딩 앱
- 복사용 8,000 이상의 시그널
- 금융 시장 개척을 위한 경제 뉴스
등록
로그인
계정이 없으시면, 가입하십시오
MQL5.com 웹사이트에 로그인을 하기 위해 쿠키를 허용하십시오.
브라우저에서 필요한 설정을 활성화하시지 않으면, 로그인할 수 없습니다.