YouTube'dan Mağaza ile ilgili eğitici videoları izleyin
Bir alım-satım robotu veya gösterge nasıl satın alınır?
Uzman Danışmanınızı
sanal sunucuda çalıştırın
sanal sunucuda çalıştırın
Satın almadan önce göstergeyi/alım-satım robotunu test edin
Mağazada kazanç sağlamak ister misiniz?
Satış için bir ürün nasıl sunulur?
MetaTrader 4 için yeni teknik göstergeler - 16

SuperTrend new formula – doğru piyasa analizi için gelişmiş SuperTrend indikatörü SuperTrend new formula, popüler SuperTrend indikatörünün geliştirilmiş bir versiyonudur ve modern traderların ihtiyaçlarını karşılamak için tasarlanmıştır. Klasik çözümlerden farklı olarak bu araç, yerel ekstremum analizini, dinamik seviyeleri ve adaptif algoritmaları birleştirerek piyasa evrelerinin daha net ve daha yapısal bir görünümünü sunar. SuperTrend new formula, yükseliş ve düşüş hareketlerini görsel olarak
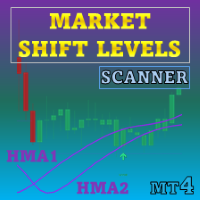
Özel teklif : ALL TOOLS , her biri sadece $35 ! Yeni araçlar ilk hafta veya ilk 3 satın alma için $30 olacaktır! MQL5’te Trading Tools Kanalı : En son haberlerim için MQL5 kanalıma katılın Bu gösterge, Hull Hareketli Ortalaması (HMA) mantığını kullanarak trend değişimlerini belirler ve piyasa yapısındaki dönüm noktalarını görselleştirir. Fiyatın tepki verebileceği potansiyel destek ve direnç bölgelerini vurgulayarak, erken trend geçişlerini gözlemlemeye yardımcı olur. MT5 sürümü için
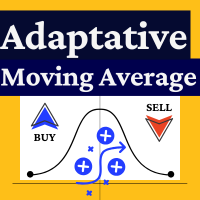
Zeiierman Uyarlanabilir Hareketli Ortalama, uyarlanabilir trend analizi yoluyla işlem fırsatlarını belirlemek için tasarlanmış bir teknik analiz aracıdır. Bu Metatrader uyarlaması, Zeiierman’ın TradingView üzerindeki orijinal göstergesini temel alır ve piyasayı görsel olarak değerlendirmek için çeşitli analitik yöntemleri birleştirir.
Teknik Özellikler Piyasa volatilitesine dayalı uyarlanabilir bir yumuşatma algoritması kullanır Duyarlılığı dinamik olarak ayarlamak için Bir Verimlilik Oranı (ER

Trend Catcher for MT4 – Hassas ticaret için gelişmiş ortağınız Trend Catcher for MT4, yatırımcılara finansal piyasa analizinde gelişmiş araçlar sunmak için tasarlanmış yenilikçi bir göstergedir. Hassasiyet, güvenilirlik ve kullanım kolaylığını bir araya getiren bu gösterge, sofistike algoritmalar kullanarak fiyat hareketlerini ve piyasa oynaklığını yorumlar, trend başlangıçlarını, olası dönüşleri ve stratejik giriş/çıkış noktalarını belirlemek için net ve zamanında sinyaller üretir. Trend Catche

You Trade with "The Trend is your Friend!" Attitude?
This is your Indicator... Golden Trend Alert Pro Tired of having MT4 and TradingView open because you can't get your trendline alerts?
You don't want to miss your trade anymore?
With the Golden Trend Alert Pro you will definitely never miss the trend in your direction again. You simply install the indicator in the terminal and then draw your trend lines.
The trend lines must be labeled "Alarm_up_..." or "Alarm_down..." Alarm_up, you will s

This indicator is a multifunctional technical analysis tool based on the combination of an adaptive exponential moving average and volatility filters calculated through the Average True Range (ATR). It is designed to accurately identify the current price direction, highlight key trend reversal areas, and visualize potential turning zones. The algorithm is built upon the dynamic construction of a trend ribbon using two levels of volatility — outer and inner ranges. The outer boundaries serve as i

This masterpiece blends cutting-edge Advance MA, HMA, and Momentum logic into stunning gold star signals, giving you the power to spot market shifts without the guesswork. Perfect for every trader—beginner or expert—this tool turns your XAUUSD charts into a goldmine of opportunity. Don’t just trade—thrive!
Why You’ll Love It
Crystal-Clear Signals : Gold star alerts highlight key market moments, guiding your decisions with ease. Smart Moving Average : Pair with the Advance MA to confidently de
FREE
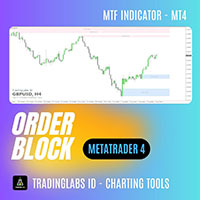
Order Block + Fair Value Gap (FVG) Indicator Multi-Timeframe Order Block + FVG Tool In the ICT (Inner Circle Trader) concept, Order Blocks (OB) + Fair Value Gaps (FVG) are among the most critical areas used by professional traders to read market structure, identify supply & demand zones, and spot high-probability entry points. The Order Block + FVG Indicator automatically detects and displays both Order Block zones and Fair Value Gaps directly on your MT4 charts. With multi-timeframe support, yo
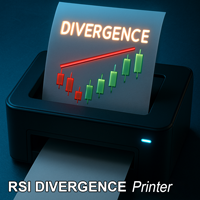
## RSI Divergence Printer Indicator This MetaTrader 4 (MT4) non repainting indicator automatically identifies and prints RSI divergences directly onto your price chart. This indicator can be used at any timeframes and is suitable for scalping, daytrading and swingtrading. In short, it looks for moments when the price is moving in one direction, but the underlying momentum is moving in the opposite direction, signaling a potential trend reversal. ## Explanation of the Indicator This tool, the
Scalping Edge Pro Indicator Unleash the Power of Precision Trading: Introducing Scalping Edge Pro Tired of market noise and conflicting signals that cloud your judgment? Are you searching for a tool that delivers the clarity and confidence needed to seize rapid opportunities in volatile markets? Scalping Edge Pro is the engineered solution designed for traders who demand precision and professionalism in every trade. It is meticulously calibrated for peak performance on the 15-minute (M15) timef
FREE

The TPX Dash Needle is everything you need to find the famous Didi Needles on several timeframes and in several pairs at the same time. These are the simultaneous meeting of the 3, 8 and 20 averages that, aligned with the ADX indicator, are synonymous with large and strong movements in the market. Now with the new Heiken Aish filter, the name of the pair shows the direction of the Heiken Aish you choose, it can be weekly or daily, all signals will appear on the screen, but now you can configure

Scalper Arrow x is a buy sell arrow type indicator, the strategy behind its signals is based on the MFI indicator with trend filter using Halftrend formula, this indicator can be used alone or mixed with other tools. NOTE : THIS INDICATOR DOESN'T REPAINT OR BACK PAINT, AND ITS ARROW SIGNALS ARE NOT DELAYED. ---------------------------------------------------------------
FREE
Trend Pulse One is a new generation indicator based on an improved version of Parabolic SAR, supplemented with arrow signals. Its purpose is to simplify the process of trend analysis and provide the trader with clear, visually understandable entry and exit points.
The main difference from the standard SAR is that Trend Pulse supplements the SAR lines with arrows that signal a change in trend direction. This makes the indicator convenient for visual analysis and application in real trading.

Introducing the Professional Arka STM Signal Indicator
With Arka Candle Close Time – 100% Free Version Fast, Accurate, and Unmatched in Identifying Trading Opportunities
This indicator is the result of combining advanced price action analysis with specialized market algorithms, delivering clear, timely, and profitable signals. Completely Free – No Installation or Usage Limits
️ An automated trading bot, fully synchronized with it, is also ready to run. The Power of ARKA STM Si
FREE
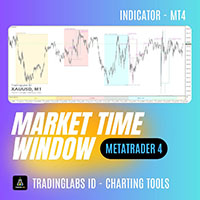
ICT Market Time Cycle – Complete Session & Time Window ICT Market Time Cycle is a professional trading indicator designed to help traders follow the ICT (Inner Circle Trader) methodology with ease.
It automatically displays the main market sessions (Asia, London, and New York), along with Killzones, Silver Bullet windows, and Macro times directly on your chart. With this tool, you no longer need to calculate session times manually – everything is plotted automatically in a clean and professional

Introducing the Professional Indicator ARKA – Candle Close Time
Do you want to always know the exact remaining time for the current candle to close? Or do you want to instantly see the real-time broker spread right on your chart without any extra calculations?
The ARKA – Candle Close Time indicator is designed exactly for this purpose: a simple yet extremely powerful tool for traders who value clarity, precision, and speed in their trading.
Key Features:
Displays the exact time re
FREE
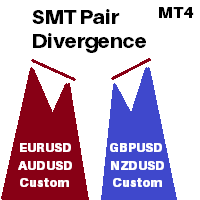
Pair correlation divergence. Define your pair in indicator setting with this format : SYMBOL1:SYMBOL2,SYMBOL3:SYMBOL4 Already Defined Symbols : EURUSD:GBPUSD,AUDUSD:NZDUSD,USDCHF:EURUSD,USDCAD:Crude,XAUUSD:AUDUSD Symbol name should match the exact case as you see it in left panel where all symbols are listed. (Indicator will not work on strategy tester, strategy tester fail to load different symbols data internally, watch video for functional usage) CAUTION : If you drag any symbol on screen

Pro Trend Sniper is a powerful trading indicator designed for traders who demand accuracy and speed in spotting market opportunities. With advanced trend detection, it helps you identify clear entry and exit points , giving you the edge to stay ahead in the markets. Its clean design and easy-to-use interface make it perfect for both beginners and professionals, ensuring you trade with confidence and precision . With three profit targets (TP1, TP2, TP3) clearly displayed, you can secure profits s

Magical Arrow Indicator – Clear & Reliable Signals The Magical Arrow Indicator is a non-repainting, trend-following tool that gives you crystal-clear Buy and Sell signals .
It high-probability reversals and entries . No more guesswork – just follow the arrows on your chart! The Magical Arrow Indicator is a powerful, easy-to-use trading tool that helps you catch the most profitable Buy and Sell opportunities in the Forex market.
It is designed for beginners and professional traders , giving y
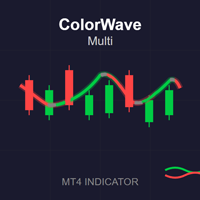
ColorWave Multi MA The ColorWave Multi MA is a highly configurable Moving Average (MA) indicator, with some advanced features: 1. Purpose of the indicator It draws a moving average line on the chart.
Instead of a single color, it splits the MA into three line segments :
Up (green) when the MA is rising,
Down (red) when the MA is falling,
Flat (gray, dotted) when the MA is flat within a threshold.
It supports many MA types , not just the standard SMA/EMA.
This is useful for traders b
CISD (Change In State Delivery) Indicator TradingLabs ID – ICT Concept Tool The Change In State Delivery (CISD) Indicator is designed based on the ICT (Inner Circle Trader) concept, where price transitions from one delivery state to another often signal high-probability trade opportunities. This tool automatically detects and marks CISD levels on your MT4 charts, helping traders identify potential breakout and retest zones with great accuracy. It is especially useful for traders applying Smart

ALL IN ONE INDICATOR :
Auto Multi Trend : BBMA_MTF ( Trend Is Your Friend )
Auto Engulfing Arrow : Candle to Candle
Auto Fibo CBR : Breakout Confirmation Download Here https://linktr.ee/ARFXTools
Auto Smart Money Area : Download Here https://linktr.ee/ARFXTools
BBMA Arrow MACD Trend Strategy (High-Probability Reentry) ️ Core Concept: A fusion of BBMA (Bollinger Bands + MAs) , CSAK/CSM Arrows , and MACD to spot high-probability trend reentry setups , validated across multiple time
Features List 1:
FVG->iFVG Order Block High Transaction Line (Personal strategy) Premium Discount 50% and 61% Previous day high low Previous week high low Candle end countdown Feature List 2 : (Implemented based on feedback from community groups) trend identification Hide FVG, Order Block, Large Transaction line below 50% equilibrium. Hide all/Individual texts/features FUTURE Feature List (Will be implemented only if at least 5 people request for it.)
Asia, London, NY lq zones (Implemented) Def

Oil Master indicator is a very beginner-friendly buy sell arrow type indicator that works on oil pairs, this indicator focuses on giving quick scalping signals with built-in money management in form of Take profit and stop-loss colored lines that come with each arrow signal, the indicator also has its built in Stats panel that gives signal accuracy % alongside useful info. HOW TO USE : Open trade according to arrow direction, after that use the TP and SL lines above and below the arrow and drag
FREE
HTF Candle Plus Timer Upgrade your trading experience with HTF Candle Plus Timer, a smart indicator that displays higher timeframe candles directly on your current chart. It allows you to stay aligned with the bigger market picture while focusing on your preferred trading timeframe. Key Features: Higher Timeframe Candles
Plot custom higher timeframe (HTF) candles such as H1, H4, D1, W1, or MN directly on lower timeframe charts for a clearer market overview. Current Candle Timer
A live countdown

Trend Reversal pro is a histogram type indicator that give long and short signals, the indicator can be traded on its own with following entry rules . Buy Rule, histogram gives green bar. Sell Rule, histogram gives red bar. This indicator doesn't repaint or back paint, this indicator signals are not delayed. -------------------------------------------------------
FREE

Designed for precision-minded traders, GannVision fuses time-tested geometric forecasting with modern analytics to deliver unparalleled market insights. Harnessing the power of Gann angles, time cycles, and price harmonics, this tool helps traders identify high-probability entry and exit points, forecast trend reversals, and decode the hidden structure of market movements. Key Features: Gann Angle Mapping for trend strength and direction Time Cycle Forecasting to anticipate turning points

How SilverSentintel indicator empowers the silver trader: Regime-aware: differentiates trend vs range so you don’t trade breakouts in chop or fade strong trends blindly. Action gating: only prints arrows when confidence is high and false-probability is low. Risk framing: immediate ATR-based SL/TP suggestions for disciplined execution. Mean-reversion context: intraday VWAP tells you when price is stretched. Silver Sentinel indicator (MQL4, XAG-only, 30m focus) This indicator is engineered for

IQ6kPower — Market Intelligence Redefined IQ6kPower is not just another technical indicator.
It’s the distilled essence of adaptive trading logic, refined to operate at what we call an effective market IQ of 6000 . This isn’t a marketing flourish — it’s a statement of precision, adaptability, and insight at a scale few tools can match. Proven Performance:
IQ6kPower has been battle‑tested in live market conditions and rigorous simulated environments — including successfully navigating multiple
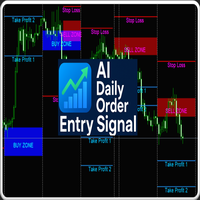
H1 indicator with daily BUY/SELL zones, Stop Loss, and two Take Profit levels. Includes HUD (spread, timeframe, countdown). No popups, no DLLs. AI Daily Order Entry Signal — H1 Only
This MT4 indicator draws clear daily BUY and SELL zones directly on your H1 chart. Each zone includes predefined Stop Loss, Take Profit 1, and Take Profit 2 levels, giving you a complete daily trade plan without extra setup.
How to Use - Attach to any H1 chart (works with forex, crypto, indices, metals). - Follow
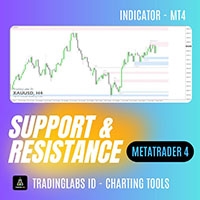
Classic Support & Resistance Tired of drawing support and resistance levels manually?
Now you can save time and trade with confidence using the Classic Support & Resistance Indicator. This tool automatically plots key support and resistance zones on your MT4 chart with high accuracy and clean visualization. Designed especially for traders who rely on Breakout – Retest Entry strategies and market structure analysis. Key Features: Auto Support & Resistance Zones
Automatically identifies and plots
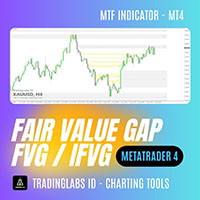
Fair Value Gap (FVG) & Inversion Fair Value Gap (iFVG) – TradingLabs ID In the ICT (Inner Circle Trader) concept, a Fair Value Gap (FVG), also known as Imbalance, occurs when price moves too quickly, leaving behind a gap without sufficient order balance. These areas are highly valuable for professional traders as they often signal potential retracement or entry zones with high probability. The FVG & iFVG Indicator is designed to automatically detect Fresh, Mitigated, and Inversion Fair Value Gap
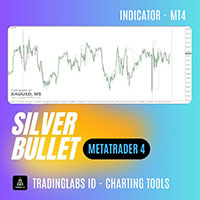
ICT Silver Bullet – Time Window Indicator The ICT Silver Bullet indicator automatically marks the ICT Silver Bullet time windows on your chart, helping you stay focused on the highest-probability setups defined by the ICT methodology. This tool is especially powerful when combined with a Fair Value Gap (FVG) indicator – simply wait for an FVG setup to form inside the Silver Bullet window, and you’ll have a precise time-based confirmation for your entries. Key Features: Automatic Silver Bullet Wi

Indicator Description GOLD TITAN KING SIGNAL INDICATOR High-Precision Gold Scalping Buy/Sell Signals – Manual Trading Assistant Overview The Gold Titan King Signal Indicator is a manual trading assistant tool designed for high-frequency scalping on Gold (XAUUSD) and other major pairs.
It generates clear BUY/SELL signals with precise entry levels, along with adjustable Stop Loss and Take Profit levels displayed directly on the chart. ️ This tool is NOT an EA. It does not execute trades

Williams' Market Dynamics Compass: Ваш навигатор в хаосе рынка! Устали от множества индикаторов и запутанных графиков? Williams' Market Dynamics Compass — это комплексный инструмент, который объединяет классические и проверенные временем стратегии Билла Уильямса в одном удобном решении. Индикатор поможет вам видеть рынок как единую, динамичную систему, а не набор случайных движений. Что внутри?
Мультитаймфреймовый анализ AO (Awesome Oscillator): Получайте информацию о трендах на разных таймфре
IntraScalpermt4 Indicator is an advanced, dynamic level-providing strategy built on proven price action principles.
At the start of every trading session, it automatically calculates the decisive Golden Level —a key point that guides high-probability trade opportunities. The upper blue line signals a confirmed short move towards the dotted lines, while the same logic applies to downside trends. Each dotted line is drawn once per day and represents a 90% likelihood of reversal based o
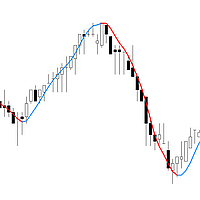
Flash Trend - т рендовый индикатор, напоминающий скользящую среднюю, но с адаптивной формулой, которая позволяет выявлять смену тренда гораздо быстрее, чем стандартные скользящие средние.
Особенности: Индикатор разработан для трейдеров ориентированных на трендовую торговлю и помогает оперативно выявлять смену тренда на любом таймфрейме. Для большей эффективности, можно применить на графике вторую линию с периодом в 5-10 раз больше первого, получив таким образом линию тренда старшего таймфрейма

Purpose :
This indicator displays real-time risk and target profit exposure of your open/pending trades directly on the chart, with optional multi-currency conversion (e.g., USD → INR or any currency pair you enter). Main Features Risk Tracking Calculates the total risk exposure if Stop Loss (SL) is hit. Expressed in Account Currency (e.g., USD) plus optional conversions. Target Profit Tracking Sums up potential profit to Take Profit (TP) (only for orders where TP is set). Useful for comparin

Nirvana Trend — Çoklu zaman dilimi onayı ve risk yönetimi yardımcılarıyla trend indikatörü Giriş
Nirvana Trend, filtrelenmiş sinyaller, çoklu zaman dilimi onayı ve volatiliteye (ATR) dayalı otomatik durdurma/çıkış seviyeleri sağlayarak işlem karar verme sürecini daha düzenli hâle getiren analitik bir indikatördür. Günlük/toplam düşüş limiti gibi kısıtların bulunduğu ortamlarda çalışıyorsanız, bu araç kişisel kurallarınıza ve risk yönetimi çerçevenize bağlı kalmanıza yardımcı olabilir. Kullanım

Profesyonel trader’lar ve değerlendirme hesapları (Prop) için Risk Yönetimi ve Limit İzleme Göstergesi Bu araç, risk yönetimi ve limitlere ilişkin bilgileri grafikte yalnızca görüntüler ve karar verme sürecinde odaklanmanıza yardımcı olur. Gösterge hiçbir işlemi açmaz/kapatmaz/değiştirmez ve Uzman Danışmanlar (EA) ile çakışmaz. Özellikler Günlük ve toplam drawdown izleme Günlük ve toplam drawdown’ı Bakiye (Balance) veya Özsermaye (Equity) bazında hesaplar ve gösterir (ayar yapılabilir). Tanımla
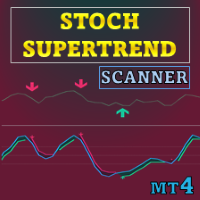
Özel fırsat : ALL TOOLS , her biri sadece $35 ! Yeni araçlar ilk hafta boyunca veya ilk 3 satın alma için $30 olacaktır! Trading Tools Channel on MQL5 : En son haberleri almak için MQL5 kanalıma katılın Bu araç, momentum değişimlerine dayalı yön sinyalleri üretmek için Stochastic RSI’ı SuperTrend mantığıyla birleştirir. Stochastic RSI üzerine SuperTrend tarzı bir zarf yerleştirir ve momentum aşırı alım/aşırı satım eşiklerini geçtiğinde dönüş noktalarını vurgular. Daha fazla MT5 sürüm
SR PrevPeriods MT4 Genel Bakış
SR PrevPeriods, MetaTrader 4 grafiğinde önceki günün, önceki haftanın ve önceki ayın en yüksek ve en düşük seviyelerini gerçek zamanlı olarak çizer. Hafif bir indikatör olup, fiyat tepkisi bölgeleri, kırılma seviyeleri ve yeniden denge alanlarıyla sıkça örtüşen tarihi destek ve direnç bölgelerini vurgulamak için tasarlanmıştır. Ne Yapar
Önemli geçmiş seviyelere yatay çizgiler çizer ve istenirse tam fiyat bilgisini gösteren metin etiketleri ekler. Çizgiler her yen
FREE
Açıklama
Market Phase Analyzer, piyasanın üç ana aşamasını belirlemek için tasarlanmış gelişmiş bir göstergedir: Birikim (Accumulation) , Manipülasyon (Manipulation) ve Dağıtım (Distribution) .
Otomatik seans analizi sayesinde gösterge Asya Kutusunu (Asia Box) çizer, kritik seviyelerin üzerinde veya altında oluşan sweep hareketlerini tespit eder ve ters dönüşleri doğrulamak için ATR filtresini kullanarak yanlış sinyalleri azaltır. Başlıca Özellikler Özelleştirilebilir Asya seansı kutusunu vurgu
FREE
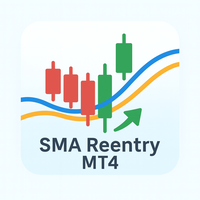
Açıklama
SMA Reentry, ana trend içerisinde yeniden giriş noktalarını belirlemek için tasarlanmış bir MetaTrader 4 göstergesidir. Kısa vadeli hareketleri yakalamak için hızlı bir Basit Hareketli Ortalama (SMA) ve genel piyasa yönünü filtrelemek için yavaş bir SMA kullanır. Hızlı SMA yavaş SMA’nın üzerinde olduğunda ve fiyat, önceki mumda altına düştükten sonra tekrar üzerine çıktığında alım sinyali oluşur. Hızlı SMA yavaş SMA’nın altında olduğunda ve fiyat, önceki mumda üzerine çıktıktan sonra t
FREE
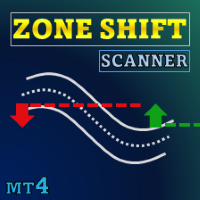
Özel teklif : ALL TOOLS , her biri sadece $35 ! Yeni araçlar ilk hafta boyunca veya ilk 3 satın alma için $30 olacaktır! MQL5’te Trading Tools Kanalı : en son haberlerimi almak için MQL5 kanalıma katılın Zone Shift, EMA/HMA tabanlı bantları kullanarak trend değişimlerini tespit eden ve kritik tepki seviyelerini gösteren bir trend tanımlama aracıdır. Trend yönünü mum renkleriyle gösterir ve önemli yeniden testleri görsel işaretlerle belirterek momentumu takip etmeyi kolaylaştırır. MT5

Ziwox Dünya Haritası Oturum Göstergesi (MetaTrader 4 için) Küresel piyasa farkındalığını doğrudan grafiklerinize taşıyın!
Ziwox Dünya Haritası Oturum Göstergesi, MT4 grafiğinizin arka planında gerçek zamanlı bir dünya haritası gösterir ve mevcut işlem oturumu ile mükemmel şekilde senkronize edilir. Temel Özellikler: Canlı Oturum Senkronizasyonu : Küresel zaman çizelgesinde tam olarak nerede olduğunuzu görün; mevcut mum, dünya haritasındaki konumuna göre hizalanır. Senkronizasyon Modu Değiştirme
FREE
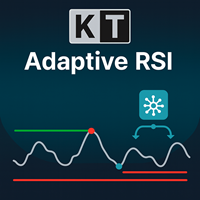
KT Adaptive RSI göstergesi, klasik RSI ile uyarlanabilir bir modülü entegre ederek, mevcut piyasa koşullarına göre dinamik aşırı alım ve aşırı satım seviyelerini belirler. Geleneksel RSI, 70'in üzerinde aşırı alım ve 30'un altında aşırı satım varsayar, ancak bu her enstrüman için her zaman doğru değildir. Uyarlanabilir modülümüz, geçmiş verileri hızla analiz ederek en uygun aşırı alım ve aşırı satım eşiklerini belirler. Bu, yatırımcıların gerçek zamanlı piyasa davranışına göre hassas giriş ve çı
- Nasıl Çalışır Temel Kavram Bu, konsolidasyon dönemlerini (aralıkları) belirleyen ve fiyat bu aralıkların üzerine çıktığında veya altına düştüğünde sinyal üreten bir aralık kırılması işlem göstergesidir. Hem trend hem de ortalamaya dönüş modlarında çalışabilir. Temel Bileşenler: 1. Menzil Tanımlaması Aralık Dönemi : Her işlem günü için belirli bir zaman aralığını tanımlar (örneğin, 10:00 - 12:00) Aralık Hesaplaması : Bu dönemde gösterge en yüksek yüksek ve en düşük düşük fiyatları izler İşl
Günlük yatırımcılar için tasarlanmış, profesyonel düzeltme, net bildirimler ve çoklu zaman dilimi desteğine sahip akıllı, renk kodlu hareketli ortalamalar.
## Basitçe anlatmak gerekirse, yaptığı şey şu: - Grafiğe hareketli ortalama çizin. - Çizginin rengi yönüne göre değişir. - Mavi = Yükseliş trendi - Kırmızı = Düşüş trendi - Sarı = akromatik/nötr renk - İsteğe bağlı olarak hat yönü değiştiğinde bildirim gönderebilirsiniz. - Mevcut zaman d

The Donchian Trend Uyarısı nesnel olarak ölçmek için tasarlanmış bir teknik analiz filtresidir. trend gücü, piyasa eğilimi ve geri dönüş sinyalleri prensiplerini kullanarak Donchian Kanalı kırılmaları . Bu gösterge, fiyat hareketini belirli bir değere göre izler. kullanıcı tanımlı dönem kanalı (varsayılan: 10 çubuk), oluşturuluyor görsel oklar ve gerçek zamanlı uyarılar önemli olduğunda kopuş onayları veya trend değişimleri meyd

"Dinamik Scalping Osilatörü" - gelişmiş, özel bir Kripto-Forex göstergesi - MT4 için verimli bir işlem aracı!
- Yeni nesil Osilatörler - nasıl kullanılacağını görmek için resimlere bakın. - Dinamik Scalping Osilatörü, uyarlanabilir Aşırı Satış/Aşırı Alım bölgelerine sahiptir. - Osilatör, dinamik Aşırı Satış/Aşırı Alım bölgelerinden kesin giriş noktalarını bulmak için yardımcı bir araçtır. - Aşırı Satış değerleri: Yeşil çizginin altında, Aşırı Alım değerleri: Turuncu çizginin üzerinde. - Bu gös

Genel Bakış PriceTime Navigator , üç güçlü ICT-tarzı yapıyı ( OTE kutusu + EQ50 , Equal High/Low & Liquidity Sweep , Günlük Anchored VWAP ) BOS/CHOCH, FVG, OB, SD gibi yapı araçlarıyla tek bir konfluans haritasında birleştiren MT4 indikatörüdür . İşlem açmaz; karar destek sunar. Çekirdek Modüller OTE Kutusu + EQ50 : Son majör swing’den %62–%79 OTE bölgesini ve %50 denge çizgisini çizer. Equal High/Low + Sweep : Eşit tepe/dip kümelerini işaretler; süpürme (fitille dışarı, kapanış içeri) anında et
Hi Trader, ================================================================================ If you like my indicator, please do not hesitate to give a review and/or comment. Thank you! ================================================================================
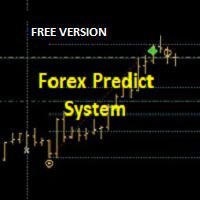
This indicator draws trade entry zone and target levels based on the levels of the previous day.
A blue zone (BUY) or red zone (SELL) is drawn and two targets. The optimal trade entry value is also indicated.
A second gray zone is
FREE

Rtc ML Ai | Predictor CORE MACHINE LEARNING ENGINE
Adaptive ML Market Predictor – Multi-Bar Trend & Candle Forecast What This Indicator Does This indicator is a real-time market prediction engine designed to analyze price behavior and estimate future market tendencies . Unlike conventional indicators, this system does not rely on static parameters or historical curve-fitting , but adapts its internal state dynamically during live market operation. Instead of using static rules, the indic
Volume Profile Order Blocks - A smarter way to visualize liquidity, volume, and key levels. Volume Profile Order Blocks is a cutting-edge indicator that enhances traditional order block strategies by embedding a detailed volume profile directly within each zone. This provides traders with a clear, data-driven view of where institutional interest may lie — not just in price, but in volume distribution. MT5 Version - https://www.mql5.com/en/market/product/146215/ Join To Learn Market Depth

O indicador com alertas do Setup de Larry Williams que conseguiu fazer U$ 10.000 virar U$ 1.100,00 em um campeonato de Trade em 1987 e comprovou fazendo a filha, que é atriz, fazer o mesmo estrago no mercado! A média de 9 para cima é compra, para baixo é venda, simples assim! Com alertas de sons e visual de compra, venda e flat, você se mantendo posicionado até a o alerta inverso a sua posição. Aconselhável usar de H1 para cima.
FREE

- Real price is 200$ - 50% Discount (It is 99$ now) - It is enabled for 3 purchases. Contact me for extra bonus (Gann Trend indicator), instruction or any questions! - Non-repaint, No lag - I just sell my products in Elif Kaya Profile, any other websites are stolen old versions, So no any new updates or support. - Lifetime update free Gann Gold EA MT5 Introduction W.D. Gann’s theories in technical analysis have fascinated traders for decades. It offers a unique approach beyond traditional c

This indicator is designed for scalping on low timeframes (M1-M15) in volatile markets like major forex pairs (e.g., EURUSD, GBPUSD). It generates non-repainting buy (green up arrow) and sell (red down arrow) signals based on EMA crossover confirmed by RSI momentum and MACD crossovers, minimizing false signals in ranging markets. How to Use:
Attach the indicator to your MT4 chart. Look for arrows on the chart: Buy on green up arrow, Sell on red down arrow. Signals appear at the open of the new

Scalping Magic Cube is a new generation multi-level intelligent tool designed to accurately determine the direction of market movement and identify potential trend change points. The indicator is based on a complex analysis system that combines elements of linear regression, adaptive moving averages, dynamic filters and impulse strength assessment models. Unlike classical methods that react to the price with a delay, Scalping Magic Cube forms stable trend zones and displays them as color rectan
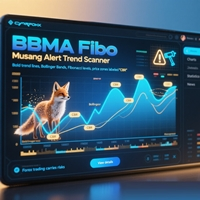
BONUS INDICATOR HERE : https://linktr.ee/ARFXTools
BBMA Fibo Musang Alert Trend Scanner Smart Indicator Powered by 3 Proven Trading Systems – All in One! Take your trading to the next level with this intelligent indicator that combines three of the most powerful and time-tested strategies in the market: BBMA Oma Ally – Your main reference for trend direction & market mapping
Fibo Musang CBR – Automatically alerts you on key breakout opportunities
Multi Trend Scanner – Fully custom
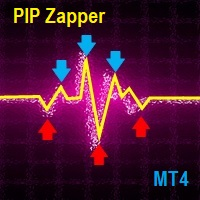
The pip Zapper is a light scalping indicator that generates alternate signals to help you close, gaining or losing trades quickly. This helps you capture trending and ranging scenarios.
When an arrow is generated enter trade after the candle closes. The indicator works with all instruments that are available on mt4 and mt5, including synthetic indices(Volatility, Range Break, Boom, Crash, etc.). Works in both ranging and trending phases. The default settings are already optimized.
MT5 Version
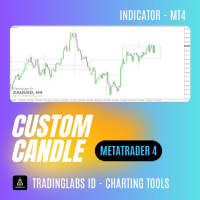
Custom Candle – Multi-Timeframe Visualization Analyzing multiple timeframes is essential for accurate trading decisions, but switching between charts can be inconvenient and inefficient. The Custom Candle indicator solves this problem by overlaying higher-timeframe (HTF) candles directly onto your lower-timeframe (LTF) chart. This allows you to see the bigger picture at a glance, align with the higher trend, and improve trade accuracy—without leaving your current chart. Key Features Multi-Timefr
FREE

Turn chaos into clarity. Trade with precision. Bitcoin’s volatility can be your greatest ally — or your fastest downfall. Btc Trailblazer is your AI‑inspired market scout, designed to decode BTC’s behaviour in real‑time and flag the traps before you step into them . Harnessing an ensemble of advanced, pre‑defined technical algorithms, this indicator goes far beyond basic buy/sell alerts: AI‑inspired analysis engine blending trend, momentum, volatility, market structure, and regime context. Fals

Squeeze and Momentum Indicator Indicator — Version 1.0
The Squeeze and Momentum Indicator is designed to highlight periods of low volatility followed by potential expansions in market activity. It combines Bollinger Bands and Keltner Channels to identify “squeeze” conditions and uses a momentum histogram to estimate the likely direction of the move once volatility expands.
How it works: A squeeze occurs when the Bollinger Bands contract inside the Keltner Channels. This condition is marked wit
FREE
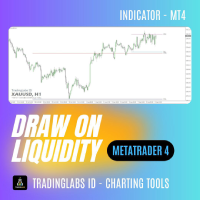
Draw On Liquidity (DOL) – PDHL, PWHL & Kill Zones Liquidity levels often act as magnets for price movement. The highs and lows of the previous day (PDHL) and week (PWHL) are key reference points where stop orders and institutional activity tend to cluster. Identifying these levels manually is time-consuming and prone to error. The Draw On Liquidity (DOL) indicator automatically plots these essential levels on your chart and highlights high-probability trading windows through session kill zones.
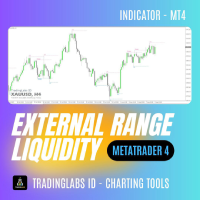
External Range Liquidity - Market Structure Mapper Objectively reading market structure is the foundation of any successful trading strategy. However, manually identifying Swing Highs/Lows, Higher Highs (HH), or Lower Lows (LL) is often subjective and confusing, especially for developing traders. The External Range Liquidity indicator is your complete solution. This tool automatically detects and labels these crucial market structure points directly on your MT4 chart. It provides you with a clea

Mirror Dominance
Назначение: визуально сравнить силу двух валютных пар и ловить моменты смены доминирования. Индикатор строит в отдельном окне две зеркальные линии для выбранных пар, показывает их схождение/расхождение и даёт сигналы на пересечениях (маркеры на основном графике). Есть Alert и Push-уведомления (по желанию), а также мини-метка виртуальной прибыли последнего сигнала.
Автор: Alexander Lapin | Платформа: MT4 Входные параметры (основные)
Pair1 / Pair2 — выбор двух валютных пар из

BONUS INDICATOR HERE : https://linktr.ee/ARFXTools
Trading Flow Using Fibo Eminence Signal 1️⃣ Wait for the Fibonacci to Auto-Draw The system automatically detects swings (from high to low or vice versa) Once the Fibonacci levels appear, the indicator sends an alert notification “Fibonacci detected! Zone is ready.” 2️⃣ Check the Entry Zone Look at the ENTRY LINE (blue zone) This is the recommended SELL entry area (if the Fibonacci is drawn from top to bottom) Wait for the price to enter

Easy RSI Divergences – Unlock Professional-Level Divergence Trading Easy RSI Divergences is a cutting-edge indicator for MetaTrader 4, crafted for traders who want to gain a competitive edge by accurately identifying RSI (Relative Strength Index) divergences in real time. Whether you are a beginner or a professional, this tool transforms complex market signals into clear, actionable insights. The indicator automatically detects both classic divergences (indicating potential trend reversals) a
ALL IN ONE INDICATOR :
Auto Multi Trend : 3 EMA FMCBR-W ( Trend Is Your Friend ) Auto Fibo CBR : Breakout Confirmation Auto Smart Money Area : Download Here https://linktr.ee/ARFXTools
FMCBR-W Multi Trend Scanner + Alert A Smart Indicator Combining 3 Proven Trading Systems — in One Powerful Tool! Boost your analysis accuracy and speed with this intelligent indicator that integrates three popular and effective trading strategies: Core Components: FMCBR-W – Serves as the main gui
MetaTrader mağazası, alım-satım robotları ve teknik göstergeler satmak için en iyi yerdir.
MetaTrader platformu için ilgi çekici bir tasarıma ve iyi bir açıklamaya sahip bir uygulama geliştirmeniz yeterlidir. Milyonlarca MetaTrader kullanıcısına sunmak için size ürününüzü Mağazada nasıl yayınlayacağınızı açıklayacağız.
Alım-satım fırsatlarını kaçırıyorsunuz:
- Ücretsiz alım-satım uygulamaları
- İşlem kopyalama için 8.000'den fazla sinyal
- Finansal piyasaları keşfetmek için ekonomik haberler
Kayıt
Giriş yap
Gizlilik ve Veri Koruma Politikasını ve MQL5.com Kullanım Şartlarını kabul edersiniz
Hesabınız yoksa, lütfen kaydolun
MQL5.com web sitesine giriş yapmak için çerezlerin kullanımına izin vermelisiniz.
Lütfen tarayıcınızda gerekli ayarı etkinleştirin, aksi takdirde giriş yapamazsınız.