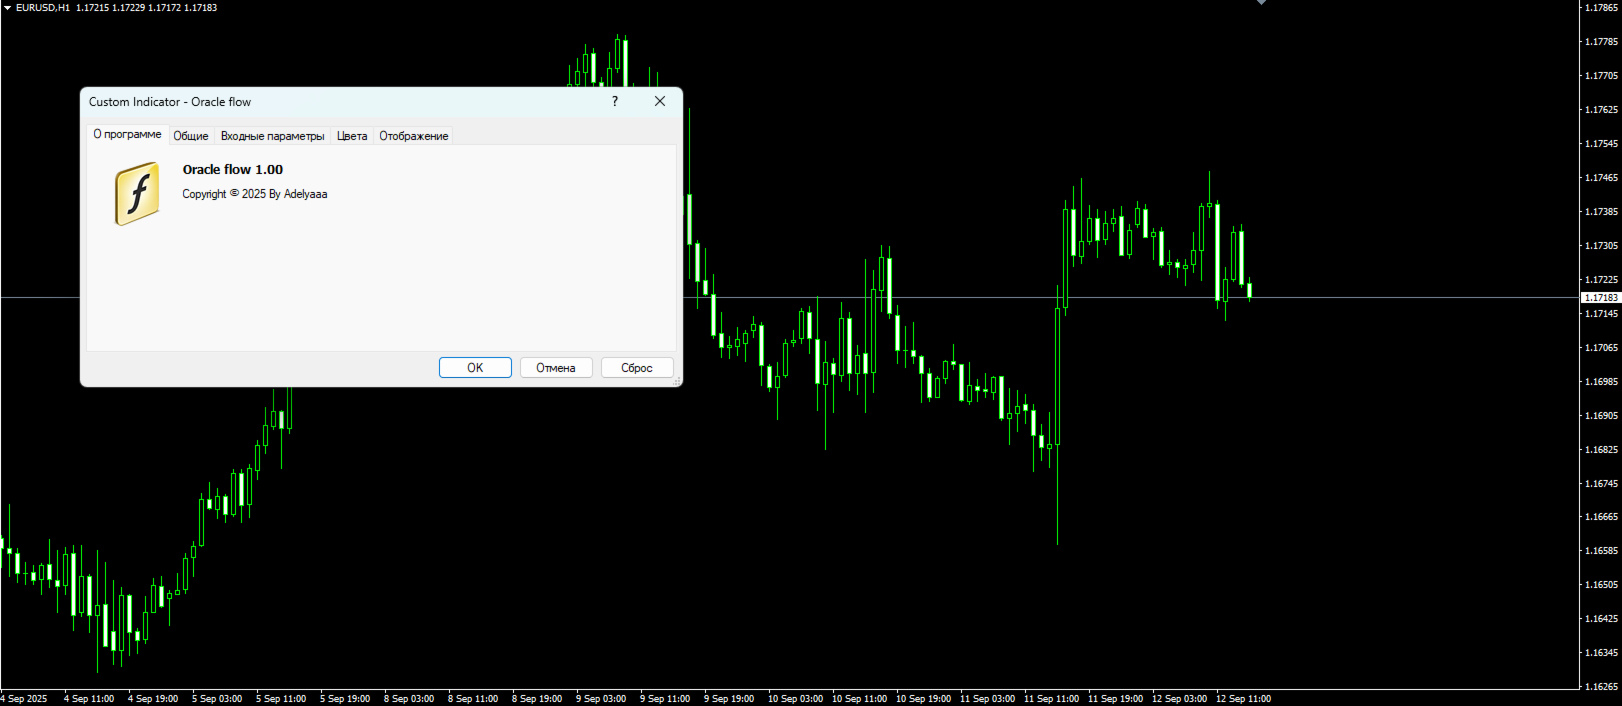
Oracle flow
- Göstergeler
-
Adolfina Denysenko
 Welcome! I'm Adelina, a trader and strategy author on MQL5. I use a combination of technical analysis, algorithmic solutions, and strict risk management in my approach. Here, you will find my transparent and efficient trading signals, advisors, and indicators. I believe in a systematic approach
 - Sürüm: 1.1
- Güncellendi: 1 Ekim 2025
- Etkinleştirmeler: 5
📌 Purpose of the indicator:
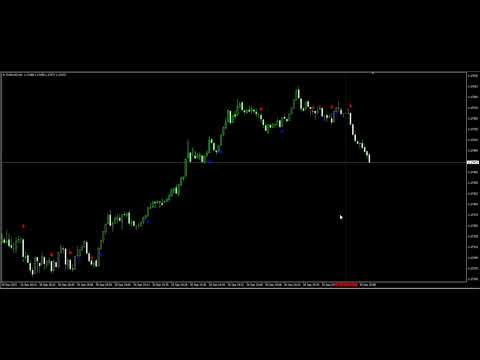
Oracle Flow is designed to identify BUY/SELL market entry points using a combination of technical indicators and filters. The indicator displays arrows on the chart to signal possible trend reversals or continuations.
⚙ Main elements used:
Exponential moving averages (EMAs)
– two periods are used: Faster and Slower. These are used to identify crossovers that confirm the strength of the movement.
RSI (Relative Strength Index):
– assesses the strength of the trend. A signal is generated when the 50 level is crossed, indicating a change in bull/bear dominance.
Bulls Power and Bears Power:
– determine the imbalance between bulls and bears, enhancing signal filtering.
Bollinger Bands:
– check for price movement outside the channels.
Volatility filtering:
The indicator calculates the average range of candles (high–low) to refine entry points.
🔔 Signal formation conditions:
✅ BUY signal (blue downward arrow):
EMA (Faster) is above EMA (Slower), indicating a possible reversal based on the previous value.
The RSI shows the price moving above the key level.
Bulls Power confirms growth and Bears Power declines.
The price is below the lower Bollinger Band.
Additional filters (the difference between the highest and lowest prices over a given period) confirm the strength of the signal.
✅ SELL signal (red upward arrow):
The EMA (Faster) is below the EMA (Slower).
The RSI shows a decline.
Bears' power is strengthening and bulls' power is decreasing.
The price is above the upper Bollinger band.
Additional filters confirm the strength of the downward movement.
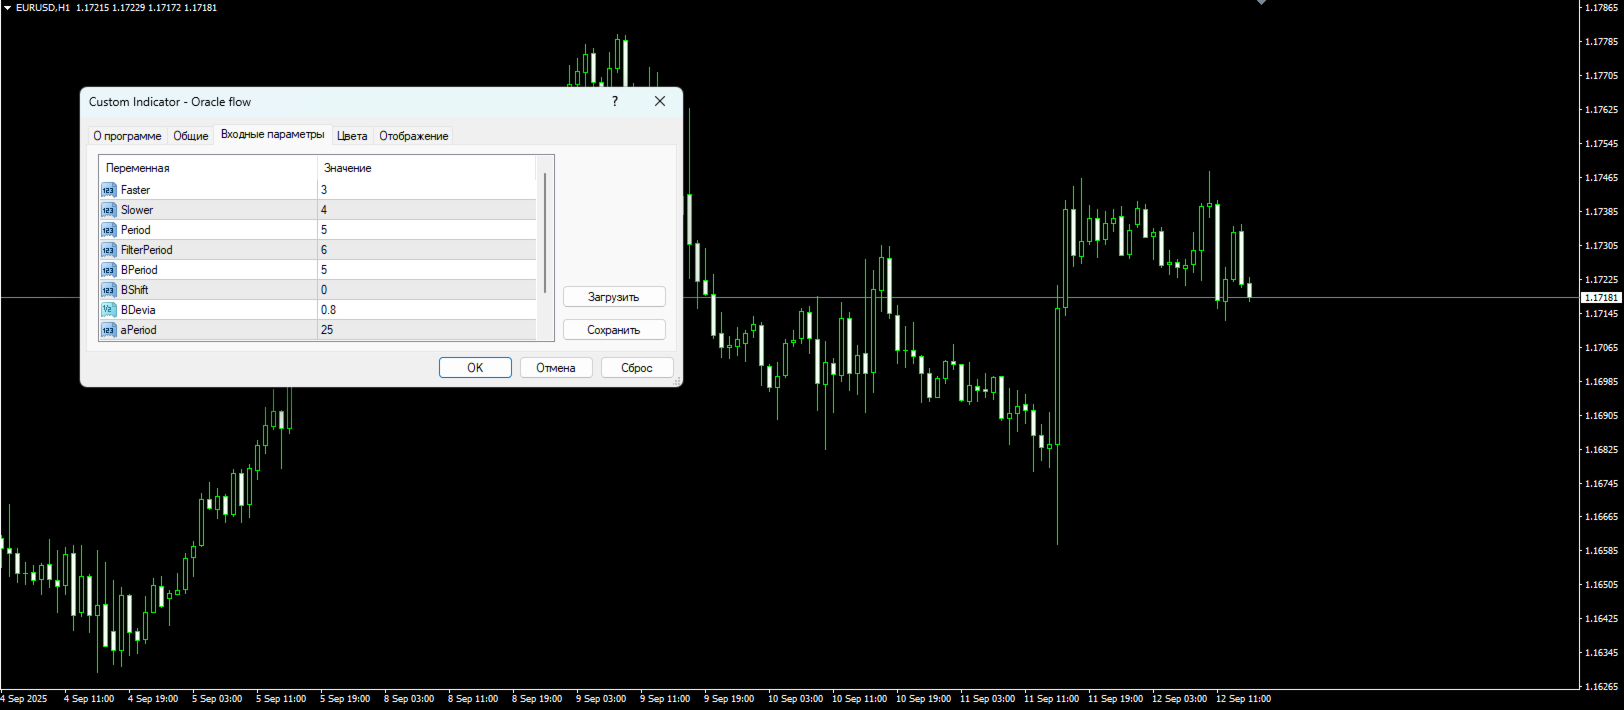
🔧 External parameters:
Period: RSI period.
📊 Display on the chart:
Blue arrow (below the price) – BUY signal.
Red arrow (above the price): SELL signal.
✅ Advantages:
It combines several indicators at once, reducing the number of false signals.
It works on any timeframe and instrument.
Signals are easy to interpret (arrows).