Neue technische Indikatoren für den MetaTrader 4 - 16
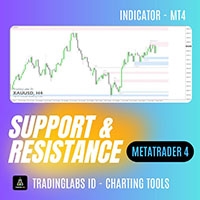
Klassische Unterstützung und Widerstand Sind Sie es leid, Unterstützungs- und Widerstandsniveaus manuell zu zeichnen?
Mit dem Classic Support & Resistance Indicator können Sie jetzt Zeit sparen und mit Zuversicht handeln. Dieses Tool zeichnet automatisch die wichtigsten Unterstützungs- und Widerstandszonen auf Ihrem MT4-Chart mit hoher Genauigkeit und sauberer Visualisierung. Es wurde speziell für Trader entwickelt, die sich auf Breakout - Retest Entry Strategien und Marktstrukturanalysen verlas
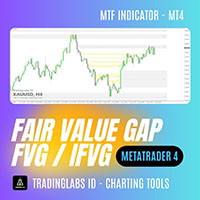
Fair Value Gap (FVG) & Inversion Fair Value Gap (iFVG) - TradingLabs ID Im ICT-Konzept (Inner Circle Trader) tritt eine Fair Value Gap (FVG), auch bekannt als Imbalance, auf, wenn sich der Preis zu schnell bewegt und eine Lücke ohne ausreichendes Ordergleichgewicht hinterlässt. Diese Bereiche sind für professionelle Trader sehr wertvoll, da sie oft potenzielle Rücksetzer oder Einstiegszonen mit hoher Wahrscheinlichkeit signalisieren. Der FVG & iFVG Indikator wurde entwickelt, um automatisch Fres
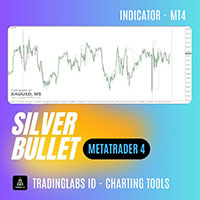
ICT Silver Bullet - Zeitfenster-Indikator Der ICT Silver Bullet-Indikator markiert automatisch die ICT Silver Bullet-Zeitfenster auf Ihrem Chart und hilft Ihnen, sich auf die Setups mit der höchsten Wahrscheinlichkeit zu konzentrieren, die von der ICT-Methode definiert werden. Dieses Tool ist besonders leistungsfähig, wenn es mit einem Fair Value Gap (FVG)-Indikator kombiniert wird - warten Sie einfach, bis sich ein FVG-Setup innerhalb des Silver Bullet-Fensters bildet, und Sie erhalten eine prä

Indikator Beschreibung GOLD-TITAN-KING-SIGNALINDIKATOR Hochpräzise Gold Scalping Kauf/Verkaufssignale - Manueller Handelsassistent Übersicht Der Gold Titan King Signalindikator ist ein manueller Handelsassistent , der für das Hochfrequenz-Scalping auf Gold (XAUUSD) und andere wichtige Paare entwickelt wurde.
Er generiert klare KAUF-/VERKAUFS-Signale mit präzisen Einstiegslevels sowie einstellbaren Stop-Loss- und Take-Profit-Levels , die direkt auf dem Chart angezeigt werden. ️ Dieses T

Williams' Market Dynamics Compass: Ihr Navigator im Marktchaos! Haben Sie genug von zahlreichen Indikatoren und verwirrenden Charts? Der Williams' Market Dynamics Compass ist ein umfassendes Instrument, das die klassischen und bewährten Strategien von Bill Williams in einer praktischen Lösung vereint. Der Indikator hilft Ihnen, den Markt als ein einziges, dynamisches System zu sehen und nicht als eine Ansammlung zufälliger Bewegungen. Was ist drin?
Multitimeframe AO (Awesome Oscillator) Analys
Der IntraScalpermt4-Indikator ist eine fortschrittliche, dynamische Level-Strategie, die auf bewährten Price-Action-Prinzipien basiert.
Zu Beginn jeder Handelssitzung berechnet er automatisch das entscheidende Golden Level - einen Schlüsselpunkt, der Handelsmöglichkeiten mit hoher Wahrscheinlichkeit anzeigt. Die obere blaue Linie signalisiert eine bestätigte Short-Bewegung in Richtung der gepunkteten Linien, während die gleiche Logik für Abwärtstrends gilt. Jede gepunktete Linie wird einmal pro
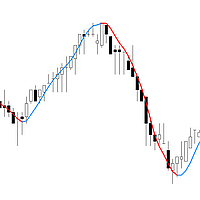
Flash Trend ist ein Trendindikator , der einem gleitenden Durchschnitt ähnelt, aber mit einer adaptiven Formel, die es Ihnen ermöglicht, Trendänderungen viel schneller zu erkennen als herkömmliche gleitende Durchschnitte.
Merkmale: Der Indikator wurde für trendorientierte Trader entwickelt und hilft, Trendänderungen auf jedem Zeitrahmen schnell zu erkennen. Für eine höhere Effizienz können Sie eine zweite Linie auf dem Diagramm mit einer Periode, die 5-10 Mal länger ist als die erste, anwenden

Zweck :
Dieser Indikator zeigt in Echtzeit das Risiko und das Gewinnziel Ihrer offenen/anhängigen Trades direkt auf dem Chart an, mit optionaler Mehrwährungsumrechnung (z.B. USD → INR oder ein beliebiges Währungspaar, das Sie eingeben). Hauptmerkmale Risiko-Tracking Berechnet das Gesamtrisiko , wenn der Stop Loss (SL) erreicht wird. Ausgedrückt in der Kontowährung (z. B. USD) plus optionale Umrechnungen. Ziel-Gewinn-Verfolgung Summiert den potenziellen Gewinn bis zum Take Profit (TP) (nur für
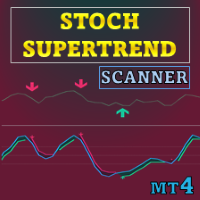
Sonderangebot : ALL TOOLS , nur $35 pro Stück! Neue Tools kosten $30 während der ersten Woche oder für die ersten 3 Käufe ! Trading Tools Channel on MQL5 : Treten Sie meinem MQL5-Kanal bei, um meine neuesten Updates zu erhalten Dieses Tool kombiniert Stochastic RSI mit der SuperTrend-Logik, um richtungsweisende Signale auf Basis von Momentum-Verschiebungen zu erzeugen. Es legt einen SuperTrend-ähnlichen Envelope auf den Stochastic RSI und hebt Wendepunkte hervor, wenn das Momentum
SR PrevPeriods MT4 Übersicht
SR PrevPeriods zeichnet in Echtzeit das Hoch und Tief des Vortages, der Vorwoche und des Vormonats direkt im MetaTrader-4-Chart ein. Es handelt sich um einen leichten Indikator, der historische Unterstützungs- und Widerstandsbereiche hervorhebt, die häufig mit Preisreaktionszonen, Ausbrüchen und Rebalancing-Bereichen übereinstimmen. Funktionen
Zeichnet horizontale Linien an den wichtigsten vorherigen Levels und optional Textlabels mit dem genauen Wert. Die Linien w
FREE
Beschreibung
SMA Reentry ist ein Indikator für MetaTrader 4, der dazu entwickelt wurde, Wiedereinstiegspunkte innerhalb des Haupttrends zu identifizieren. Er verwendet zwei einfache gleitende Durchschnitte: einen schnellen, um kurzfristige Bewegungen zu erfassen, und einen langsamen, um die allgemeine Marktrichtung zu filtern. Ein Kaufsignal entsteht, wenn der schnelle SMA über dem langsamen SMA liegt und der Preis nach einem Unterschreiten in der vorherigen Kerze wieder darüber schließt. Ein V
FREE
Beschreibung
Der Market Phase Analyzer ist ein fortschrittlicher Indikator, der entwickelt wurde, um die drei Hauptphasen des Marktes zu identifizieren: Akkumulation , Manipulation und Distribution .
Durch automatische Sitzungsanalyse zeichnet der Indikator die Asia Box , erkennt Sweep-Bewegungen über oder unter wichtigen Niveaus und bestätigt Umkehrsignale mit dem ATR-Filter , um Fehlsignale zu reduzieren. Hauptfunktionen Markierung der asiatischen Handelssitzung mit anpassbarem Rechteck. Auto
FREE
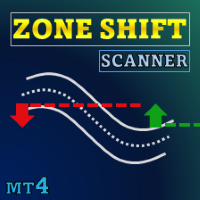
Sonderangebot : ALL TOOLS , nur $35 pro Stück! Neue Tools kosten $30 in der ersten Woche oder für die ersten 3 Käufe ! „Trading Tools“-Kanal auf MQL5 : Tritt meinem MQL5-Kanal bei, um meine neuesten Updates zu erhalten Zone Shift ist ein Tool zur Trenderkennung, das auf EMA/HMA basierende Bänder verwendet, um Trendwechsel zu erkennen und wichtige Reaktionsniveaus anzuzeigen. Es zeigt die Trendrichtung über Kerzenfarben und markiert wichtige Retests mit visuellen Hinweisen, um das M

Ziwox World Map Session Indicator für MetaTrader 4 Bringen Sie das Bewusstsein für den globalen Markt direkt auf Ihre Charts!
Unser World Map Session Indicator zeigt eine Weltkarte in Echtzeit als Hintergrund Ihres MT4-Charts an – perfekt synchronisiert mit der aktuellen Handelssitzung. Hauptfunktionen: Live-Sitzungssynchronisation : Sehen Sie genau, wo Sie sich in der globalen Zeitleiste befinden; die aktuelle Kerze ist auf ihrer Position auf der Weltkarte markiert. Synchronisationsmodus umscha
FREE
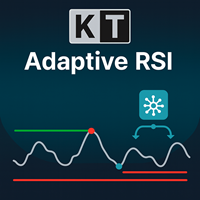
Der KT Adaptive RSI Indikator kombiniert ein adaptives Modul mit dem klassischen RSI und identifiziert dynamische Überkauft- und Überverkauft-Niveaus basierend auf den aktuellen Marktbedingungen. Der traditionelle RSI geht davon aus, dass ein Instrument überkauft ist, wenn es über 70 liegt, und überverkauft, wenn es unter 30 liegt – doch das ist nicht immer für jedes Instrument zutreffend. Unser adaptives Modul analysiert schnell historische Daten, um optimal geeignete Überkauft- und Überverkauf

Steigern Sie Ihr Breakout-Trading mit dem Support Resistance Breakout Indicator MT4, einem leistungsstarken, auf ZigZag basierenden Tool, das dynamisch Unterstützungs- und Widerstandszonen erkennt und bestätigte Breakout-Signale für hochprobable Einstiege in Forex-, Aktien-, Krypto- und Rohstoffmärkten liefert. Basierend auf etablierten Prinzipien der Preisaktion, wie sie auf Websites wie Investopedia und BabyPips beschrieben werden, wo Breakouts von Unterstützungs-/Widerstandszonen als Signale

Der Donchian Trend Alarm ist ein technischer Analysefilter, der entwickelt wurde, um objektiv zu messen Trendstärke, Markttendenz und Umkehrsignale unter Verwendung der Prinzipien von Ausbrüche im Donchian-Kanal . Dieser Indikator überwacht die Preisentwicklung im Verhältnis zu einem benutzerdefinierter Periodenkanal (Standard: 10 Takte), erzeugt visuelle Pfeile und Echtzeitwarnungen wenn signifikant Ausbruchsbestätigungen oder Trendw

„Dynamischer Scalping-Oszillator“ – ein fortschrittlicher, benutzerdefinierter Krypto-Forex-Indikator – ein effizientes Handelstool für MT4!
– Neue Oszillatorengeneration – siehe Bilder zur Anwendung. – Der dynamische Scalping-Oszillator verfügt über adaptive Überverkauft-/Überkauft-Zonen. – Der Oszillator ist ein Hilfsmittel, um genaue Einstiegspunkte in dynamischen Überverkauft-/Überkauft-Bereichen zu finden. – Überverkauft: unterhalb der grünen Linie, Überkauft: oberhalb der orangefarbenen
Was ist der Bias Finder Der Bias Finder (with Export) ist ein fortschrittlicher Indikator, der statistische Markt-Biases erkennt und analysiert. Er bietet eine klare Visualisierung wiederkehrender Tendenzen und ist besonders nützlich für diskretionäre sowie systematische Trader, die quantitative Analysen in ihre Handelsstrategien integrieren möchten. Analysemodi Der Indikator berechnet und zeigt den Preis-Bias nach verschiedenen zeitlichen Logiken: Hourly Bias : stündliche statistische Analyse W

Dieser Indikator ist ein multifunktionales Werkzeug der technischen Analyse, das auf der Kombination eines adaptiven exponentiellen gleitenden Durchschnitts und Volatilitätsfiltern basiert, die über den Average True Range (ATR) berechnet werden. Er wurde entwickelt, um die aktuelle Preisrichtung präzise zu identifizieren, Schlüsselbereiche möglicher Trendwenden hervorzuheben und potenzielle Wendebereiche visuell darzustellen. Der Algorithmus basiert auf der dynamischen Konstruktion eines Trendba
Hallo Trader, ================================================================================ Wenn Ihnen mein Indikator gefällt, zögern Sie bitte nicht, eine Bewertung und/oder einen Kommentar abzugeben. Vielen Dank dafür! ================================================================================
Dieser Indikator zeichnet Handelseinstiegszonen und Zielniveaus auf der Grundlage der Niveaus des Vortages.
Es wird eine blaue Zone (KAUFEN) oder eine rote Zone (VERKAUFEN) eingezeichnet und zw
FREE

Die TPX Dash Needle ist alles, was Sie brauchen, um die berühmten Didi-Nadeln auf mehreren Zeitskalen und in mehreren Paaren gleichzeitig zu finden. Dabei handelt es sich um das gleichzeitige Zusammentreffen der Durchschnitte 3, 8 und 20, die, abgestimmt auf den ADX-Indikator, ein Synonym für große und starke Bewegungen auf dem Markt sind. Mit dem neuen Heiken Aish-Filter zeigt der Name des Paares die Richtung des Heiken Aish an, die Sie auswählen, es kann wöchentlich oder täglich sein, alle Sig

Rtc ML Ai | Predictor CORE MACHINE LEARNING ENGINE
Adaptive ML Market Predictor - Multi-Bar Trend & Candle Forecast Was dieser Indikator tut Im Gegensatz zu herkömmlichen Indikatoren verlässt sich dieses System nicht auf statische Parameter oder historische Kurvenanpassungen , sondern passt seinen internen Zustand dynamisch während des laufenden Marktbetriebs an. Anstatt statische Regeln zu verwenden, lernt der Indikator kontinuierlich aus Live-Marktdaten und passt sein internes Modell dynam
Der Indikator mit Setup-Warnungen von Larry Williams, dem es 1987 gelang, bei einer Handelsmeisterschaft 10.000 Dollar in 1.100 Dollar zu verwandeln, und der dies bewies, indem er seine Tochter, die Schauspielerin ist, den gleichen Schaden am Markt anrichten ließ! Der Durchschnitt von 9 oben ist kaufen, unten ist verkaufen, so einfach ist das! Mit akustischen und visuellen Alarmen für Kauf, Verkauf und Flat bleiben Sie in Position, bis der Alarm Ihre Position umkehrt. Wir empfehlen den Einsatz a
FREE

Dieser Indikator ist für das Scalping auf niedrigen Zeitrahmen (M1-M15) in volatilen Märkten wie den wichtigsten Forex-Paaren (z.B. EURUSD, GBPUSD) konzipiert. Er generiert Kauf- (grüner Pfeil nach oben) und Verkaufssignale (roter Pfeil nach unten), die auf dem EMA-Crossover basieren und durch RSI-Momentum und MACD-Crossover bestätigt werden, wodurch falsche Signale in schwankenden Märkten minimiert werden. Wie man ihn benutzt:
Befestigen Sie den Indikator an Ihrem MT4-Chart. Achten Sie auf di

Scalping Magic Cube ist ein intelligentes Multi-Level-Tool der neuen Generation, das entwickelt wurde, um die Richtung der Marktbewegung genau zu bestimmen und potenzielle Trendwechselpunkte zu identifizieren. Der Indikator basiert auf einem komplexen Analysesystem, das Elemente der linearen Regression, adaptive gleitende Durchschnitte, dynamische Filter und Modelle zur Bewertung der Impulsstärke kombiniert. Im Gegensatz zu klassischen Methoden, die verzögert auf den Kurs reagieren, bildet Scal
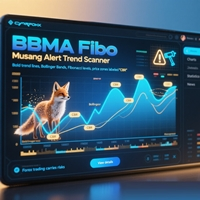
BONUSINDIKATOR HIER : https://linktr.ee/ARFXTools
BBMA Fibo Musang Alert Trend Scanner Smart Indicator Powered by 3 Proven Trading Systems - Alles in einem! Bringen Sie Ihr Trading auf die nächste Stufe mit diesem intelligenten Indikator, der drei der leistungsfähigsten und bewährtesten Strategien auf dem Markt kombiniert: BBMA Oma Ally - Ihre wichtigste Referenz für Trendrichtung und Marktabbildung
Fibo Musang CBR - Warnt Sie automatisch bei wichtigen Ausbruchschancen
Multi Trend
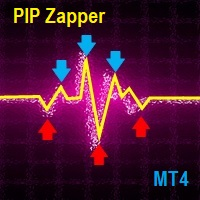
Der Pip Zapper ist ein leichter Scalping-Indikator, der alternative Signale generiert , um Ihnen zu helfen, Trades schnell zu schließen, zu gewinnen oder zu verlieren. Dies hilft Ihnen, Trend- und Schwankungsszenarien zu erfassen.
Wenn ein Pfeil generiert wird, steigen Sie in den Handel ein, nachdem die Kerze geschlossen wurde . Der Indikator funktioniert mit allen Instrumenten, die auf mt4 und mt5 verfügbar sind, einschließlich synthetischer Indizes (Volatilität, Range Break, Boom, Crash, etc.)

ALL IN ONE INDICATOR :
Auto Multi Trend : BBMA_MTF ( Trend Is Your Friend )
Auto Engulfing Arrow : Candle to Candle
Auto Fibo CBR : Breakout Confirmation Hier herunterladen https://linktr.ee/ARFXTools
Auto Smart Money Area : Hier herunterladen https://linktr.ee/ARFXTools
BBMA Arrow MACD Trend Strategie (Hochwahrscheinlicher Wiedereinstieg) ️ Kernkonzept: Eine Verschmelzung von BBMA (Bollinger Bands + MAs) , CSAK/CSM Arrows und MACD , um hochwahrscheinliche Trendwiedereinstiegs-Setups

Verwandeln Sie das Chaos in Klarheit. Handeln Sie mit Präzision. Die Volatilität von Bitcoin kann Ihr größter Verbündeter sein - oder Ihr schnellster Untergang. Btc Trailblazer ist Ihr KI-inspirierter Marktscout, der das Verhalten von BTC in Echtzeit entschlüsselt und die Fallen aufzeigt, bevor Sie in sie hineinlaufen . Dieser Indikator nutzt eine Reihe fortschrittlicher, vordefinierter technischer Algorithmen und geht damit weit über einfache Kauf-/Verkaufswarnungen hinaus: KI-inspirierte Analy
Squeeze- und Momentum-Indikator Indikator - Version 1.0
Der Squeeze- und Momentum-Indikator wurde entwickelt, um Perioden niedriger Volatilität, gefolgt von potenziellen Ausdehnungen der Marktaktivität, hervorzuheben. Er kombiniert Bollinger Bänder und Keltner-Kanäle, um "Squeeze"-Bedingungen zu identifizieren, und verwendet ein Momentum-Histogramm, um die wahrscheinliche Richtung der Bewegung abzuschätzen, sobald die Volatilität zunimmt.
Wie es funktioniert: Ein Squeeze tritt auf, wenn sich d
FREE

Easy RSI Divergences - Erschließen Sie sich den Divergenzhandel auf professionellem Niveau Easy RSI Divergences ist ein hochmoderner Indikator für MetaTrader 4, der für Händler entwickelt wurde, die sich einen Wettbewerbsvorteil verschaffen wollen, indem sie RSI-Divergenzen (Relative Strength Index) in Echtzeit genau erkennen. Ob Sie Anfänger oder Profi sind, dieses Tool verwandelt komplexe Marktsignale in klare, umsetzbare Erkenntnisse. Der Indikator erkennt automatisch sowohl klassische Div
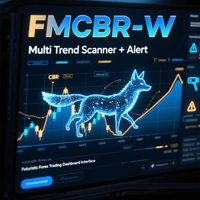
ALL IN ONE INDICATOR :
Auto Multi Trend : 3 EMA FMCBR-W ( Trend Is Your Friend ) Auto Fibo CBR : Ausbruchs-Bestätigung Auto Smart Money Area : Hier herunterladen https://linktr.ee/ARFXTools
FMCBR-W Multi Trend Scanner + Alert Ein intelligenter Indikator, der 3 bewährte Handelssysteme kombiniert - in einem einzigen leistungsstarken Tool! Steigern Sie Ihre Analysegenauigkeit und Geschwindigkeit mit diesem intelligenten Indikator, der drei beliebte und effektive Handelsstrategien integr
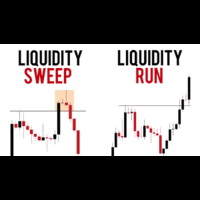
Der Liquiditätsfallen-Umkehrindikator verfolgt die Liquiditätsfallen und fängt sie bei einer schnellen Umkehr nach der Stopp-Jagd gut und schnell ab. Eine Liquiditätsfalle im Handel bezieht sich typischerweise auf eine Preiszone, in der sich eine große Anzahl von Aufträgen (insbesondere Stop-Losses und schwebende Aufträge) konzentriert . Liquiditätsfalle → Stop Hunt → Schnelle Umkehrung Der Kurs konsolidiert sich in der Nähe eines wichtigen Niveaus (z. B. einer Unterstützung). Unterhalb dieses

ALL IN ONE INDICATOR :
Auto Multi Trend : BBMA OMA ALLY_MTF ( Trend Is Your Friend )
Auto Arrow : CSAK & CSM Confirmation
Auto Smart Money Area : Download Here https://linktr.ee/ARFXTools
Handelssystem: BBMA MultiTrend CSAK/CSM Pfeil + Trendbestätigung in die gleiche Richtung
Zielsetzung: Finden von Wiedereinstiegsmöglichkeiten nach dem Auftreten des CSAK/CSM-Pfeilsignals, mit Bestätigung der Trendrichtung in die gleiche Richtung (Multi-Timeframe-Trend) nach dem BBMA Oma Ally Konzept

Jeder Indikator, der auf Basis vergangener Bars berechnet wird, hinkt zwangsläufig dem aktuellen Preis hinterher. Zerolag Pro berechnet auf 0 ( aktuellen) Balken unter Verwendung von Bid / Ask oder Close[0] und ermöglicht Ihnen eine "Vorschau" auf mögliche Signalverschiebungen, ohne auf den Balkenschluss zu warten.
Der Zerolag Pro Handelsindikator wurde entwickelt, um Marktverschiebungen zu erfassen, sobald sie geschehen. Durch die Kombination von adaptiven gleitenden Durchschnitten, volatilitä

GannVision wurde für präzisionsorientierte Händler entwickelt und verbindet bewährte geometrische Prognosen mit moderner Analytik, um unvergleichliche Markteinblicke zu liefern. Dieses Tool nutzt die Leistungsfähigkeit von Gann-Winkeln, Zeitzyklen und Kursharmonien und hilft Händlern, Einstiegs- und Ausstiegspunkte mit hoher Wahrscheinlichkeit zu identifizieren, Trendumkehrungen vorherzusagen und die verborgene Struktur von Marktbewegungen zu entschlüsseln. Hauptmerkmale: Gann Angle Mapping f

Wie der SilverSentintel-Indikator den Silberhändler stärkt: Regime-Aware: Unterscheidet zwischen Trend und Spanne, so dass Sie nicht blind auf Ausbrüche in Chops setzen oder starke Trends ausblenden. Action Gating: druckt nur Pfeile, wenn das Vertrauen hoch und die Falschwahrscheinlichkeit niedrig ist. Risiko-Framing: sofortige ATR-basierte SL/TP-Vorschläge für disziplinierte Ausführung. Mean-Reversion-Kontext: Intraday-VWAP zeigt Ihnen, wann der Preis gestreckt ist. Silber Sentinel Indikator (M

TripleSync Pro FX ist ein fortschrittlicher multidimensionaler Trend-Synchronisationsindikator, der speziell für Devisenhändler entwickelt wurde. Er kombiniert drei Kerndimensionen - Kursmomentum, Volatilitätsanalyse und Marktstimmung - mit intelligenten Algorithmen, um Wendepunkte im Markttrend genau zu erkennen und Händlern zu helfen, in einem komplexen und volatilen Marktumfeld intelligentere Entscheidungen zu treffen. Highlights der Kernfunktionalität Dreifaches Signal-Bestätigungssystem
FREE

Eingabe: Bereichsstartzeit: Die Startzeit der Bereichserstellung Range End Time : Der Endzeitpunkt der Range-Erstellung Trade End Time : Die Zeit, bis zu der die Linie der Range Zone High/Low verlängert wird Minimum Size : Die Mindestgröße der Range in Punkten Maximum Size : Die maximale Größe des Bereichs in Punkten Wenn die Größe der Handelsspanne zwischen dem Minimum und dem Maximum liegt, druckt der Indikator die erste Farbe (blau).
Produkt-Beschreibung: Kaufen-Verkaufen-Pfeil-Indikator für MT4
Mit dem Buy Sell Arrow Indicator für MT4 , einem innovativen Tool, das auf der Grundlage fortschrittlicher Candlestick-Muster hochwahrscheinliche Handelsgelegenheiten aufzeigt, erreichen Sie neue Höhen im Handel. Dieser MT4-Indikator wurde speziell für Forex-Händler entwickelt, die GOLD auf dem 5-Minuten-Chart handeln. Er bietet eine außergewöhnliche Genauigkeit mit einer beeindruckenden Gewinnrate von 85% und ermöglicht es Ihnen,

Nirvana Trend — Trendindikator mit Multi‑Timeframe‑Bestätigung und Hilfen fürs Risikomanagement Einführung
Nirvana Trend ist ein analytischer Indikator, der den Trading‑Entscheidungsprozess strukturierter macht, indem er gefilterte Signale, Bestätigungen über mehrere Zeiteinheiten und automatische Stopp‑/Ausstiegsniveaus auf Basis der Volatilität (ATR) bereitstellt. Wenn Sie in Umgebungen mit Beschränkungen wie täglichen/gesamt Drawdown‑Limits handeln, kann dieses Tool die Einhaltung Ihrer pers

Indikator für Risikomanagement und Limitüberwachung für professionelle Trader und Evaluierungskonten (Prop) Dieses Tool zeigt präzise Informationen zu Risikomanagement und Limits ausschließlich auf dem Chart an, um fokussierte Entscheidungen zu unterstützen. Der Indikator öffnet/schließt/ändert keine Trades und interferiert nicht mit Expert Advisors (EAs). Funktionen Überwachung des täglichen und gesamten Drawdowns Berechnet und zeigt täglichen und gesamten Drawdown auf Basis von Kontostand (Ba
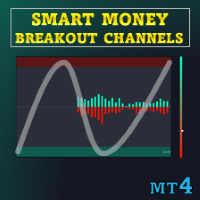
Sonderangebot : ALL TOOLS , nur $35 pro Stück! Neue Tools kosten $30 in der ersten Woche oder für die ersten 3 Käufe ! Trading-Tools-Kanal auf MQL5 : Tritt meinem MQL5-Kanal bei, um meine neuesten Nachrichten zu erhalten Dieser Indikator zeichnet Ausbruchserkennungszonen, sogenannte “Smart Breakout Channels”, die auf volatilitätsnormalisierten Preisbewegungen basieren. Diese Zonen werden als dynamische Boxen mit Volumen-Overlays dargestellt. Das Tool erkennt temporäre Akkumulations
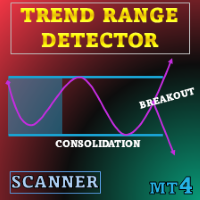
Sonderangebot : ALL TOOLS , nur $35 pro Stück! Dieses Tool ist 3 Tage KOSTENLOS ; verpassen Sie es nicht! Neue Tools kosten $30 während der ersten Woche oder für die ersten 3 Käufe ! Trading Tools Channel on MQL5 : Treten Sie meinem MQL5-Kanal bei, um die neuesten Nachrichten zu erhalten Trend Range Detector wurde für Anwender entwickelt, die eine strukturierte, datenbasierte Sicht auf Preis-Konsolidierungen bevorzugen. Anstatt auf subjektives Chart-Lesen zu setzen, wendet er klar

Verbessern Sie Ihre Trading-Vielseitigkeit mit dem Make Your Own Index MT4-Indikator, einem anpassbaren Tool, das Ihnen ermöglicht, personalisierte Indizes aus beliebigen Symbolen zu bauen, die zu einer einzigen Linie mit gleich- oder gewichteten Allokationen verschmolzen werden, um Sektorperformance, diversifizierte Portfolios oder strategische Baskets zu tracken. Inspiriert von etablierten Indizes wie dem S&P 500 (marktkapitalisierungsgewichtet seit 1957) oder gleichgewichteten Alternativen, d
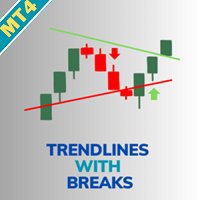
Verbessern Sie Ihr Breakout-Trading mit dem Trendlines with Breaks by LuxAlgo MT5, einem innovativen pivot-basierten Indikator, der dynamische Trendlinien automatisch zeichnet und Echtzeit-Breaks hervorhebt, inspiriert vom popularen LuxAlgo-Suite auf TradingView, wo es über 100.000 Nutzungen und positive Bewertungen für seine Genauigkeit bei der Erkennung von Support/Resistance-Leveln gesammelt hat. Gefeiert in Trading-Communities wie Reddit und YouTube für seine non-repainting-Option und anpass
- Wie es funktioniert Kernkonzept Dies ist ein Range-Breakout-Handelsindikator, der Konsolidierungsperioden (Bereiche) identifiziert und Signale generiert, wenn der Preis über oder unter diese Bereiche fällt. Er kann sowohl im Trend- als auch im Mean-Reversion-Modus arbeiten. Schlüsselkomponenten: 1. Bereichsidentifizierung Bereichszeitraum : Definiert ein bestimmtes Zeitfenster an jedem Handelstag (z. B. 10:00 - 12:00 Uhr) Bereichsberechnung : Während dieses Zeitraums verfolgt der Indikator
Ein farbcodierter intelligenter gleitender Durchschnitt mit professioneller Glättung, klaren Warnungen und Unterstützung mehrerer Zeitrahmen, entwickelt für den alltäglichen Händler.
## Einfach ausgedrückt, was es tut - Zeichnen Sie einen gleitenden Durchschnitt in das Diagramm. - Die Farbe der Linie ändert sich je nach Richtung. - Blau = Aufwärtstrend - Rot = Abwärtstrend - Gelb = Flach/Neutral - Senden Sie optional eine Warnung, wenn die Linie

Überblick PriceTime Navigator ist ein MT4-Indikator , der drei wirkungsstarke, ICT-ähnliche Konzepte — OTE-Zone (Premium/Discount + EQ50) , Equal High/Low mit Liquiditäts-Sweep , sowie den täglich verankerten VWAP — mit Struktur-Tools (BOS/CHOCH, FVG, OB, SD) zu einer klaren Konfluenz-Karte vereint. Er platziert keine Trades; er dient als Entscheidungs-Cockpit für diskretionäre oder regelbasierte Trader. Kernmodule OTE-Zone + EQ50 : Zeichnet automatisch die 62–79 %-Optimal-Entry-Zone aus dem let
Signale mit TP SL-Indikator - ein leistungsstarkes Handelsinstrument, das EMA-Crossover , RSI-Filter und ATR-basierte TP/SL-Levels kombiniert, um Ihnen zu helfen, Markteinstiege mit hoher Wahrscheinlichkeit zu erkennen. Dieser Indikator wurde entwickelt, um den Signals with TP SL Expert Advisor visuell zu unterstützen, kann aber auch manuell als eigenständiges Bestätigungstool für Intraday- und Swing-Trading verwendet werden. Merkmale: Kauf-/Verkaufspfeile basierend auf EMA-Crossover + RSI-Be

Volume Profile Order Blocks - Ein intelligenter Weg zur Visualisierung von Liquidität, Volumen und wichtigen Niveaus. Volume Profile Order Blocks ist ein hochmoderner Indikator, der die traditionellen Orderblock-Strategien durch die Einbettung eines detaillierten Volumenprofils direkt in jeder Zone erweitert. Dadurch erhalten Händler einen klaren, datengestützten Überblick darüber, wo das institutionelle Interesse liegen könnte - nicht nur im Preis, sondern auch in der Volumenverteilung. MT5-Ver

- Real Preis ist 200$ - 50% Rabatt (Es ist 99$ jetzt) - Es ist für 3 Käufe aktiviert. Kontaktieren Sie mich für zusätzliche Bonus (Gann Trend Indikator ), Anleitung oder Fragen! - Nicht nachgemalt, keine Verzögerung - Ich verkaufe nur meine Produkte in Elif Kaya Profil, alle anderen Websites sind gestohlenen alten Versionen, also keine neuen Updates oder Unterstützung. - Lifetime Update kostenlos Gann Gold EA MT5 Einführung Die Theorien von W.D. Gann zur technischen Analyse faszinieren Trader s

SessionViz Pro - Professioneller Visualisierer für Handelssitzungen
ÜBERBLICK: Professioneller Indikator zur Hervorhebung von Handelssitzungszeiten und bestimmten Zeiträumen auf Ihren MetaTrader 5-Charts. Unverzichtbares Werkzeug für sitzungsbasierte Handelsstrategien und zeitabhängige Marktanalysen.
KEY FEATURES: Hervorhebung der Hintergrundbereiche von Handelssitzungen mit benutzerdefinierten Farben Zeichnen Sie vertikale Linien zu bestimmten Zeiten für präzise Einstiege Unterstützung
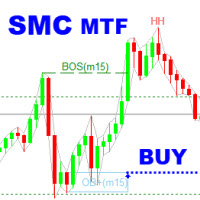
SMC Analyzer Multi-Timeframe ist ein leistungsstarkes Tool, das Händlern hilft, Smart Money Concepts (SMC) über mehrere Zeitrahmen hinweg anzuwenden. Dieser Indikator identifiziert wichtige strukturelle Punkte wie Marktstrukturverschiebungen (Break of Structure und Change of Character), Orderblöcke, Fair Value Gaps (FVG) und Liquiditätszonen aus höheren Zeitrahmen und überlagert sie auf dem aktuellen Chart. Durch den Abgleich dieser kritischen SMC-Signale über mehrere Zeitrahmen hinweg erhalten

ALL IN ONE INDICATOR :
Auto Multi Trend : Alligator_MTF ( Trend Is Your Friend ) Auto Fibo CBR : Ausbruchs-Bestätigung Auto Smart Money Area : Hier herunterladen https://linktr.ee/ARFXTools
Alligator Fibo Musang CBR Alert Trend Scanner Ein intelligenter Indikator mit 3 bewährten Handelssystemen in einem! Dieser All-in-One-Indikator wurde für Trader entwickelt, die die Marktrichtung schnell, präzise und einfach analysieren wollen .
Er kombiniert 3 bewährte Strategien, um Ihnen einen

Hallo Herr Trader! Heute möchte ich Ihnen meinen innovativen Indikator zorro vorstellen. Der Indikator wird in Form eines Preiskanals eines Abwärts- oder Aufwärtstrends dargestellt. Kauf- oder Verkaufssignale werden generiert, wenn der Preis die horizontale Linie des Preiskanals von unten nach oben oder von oben nach unten durchbricht, wobei die Einstiegspunkte in Form von Pfeilen angezeigt werden. Der Indikator kann auf jedem Zeitrahmen funktionieren und einen guten Gewinn bringen. Der Indikat
Hier ist die vollständige englische Übersetzung Ihres Textes: TRI Visualizer Enhanced - Thermodynamische Marktanalyse Übersicht
Der TRI (Thermal Range Indicator) Visualizer Enhanced ist ein seltener Marktanalyse-Indikator, der über die konventionelle technische Analyse hinausgeht und die Prinzipien der Thermodynamik aus der Physik anwendet. Er interpretiert Marktpreisschwankungen als "thermodynamische Energie" und ermöglicht so die hochpräzise Erkennung von subtilen Marktveränderungen, die

Monster Reverse ist ein Reverse-Handelsindikator, der leistungsstarke Umkehrpunkte liefert, die eine hohe Trefferwahrscheinlichkeit haben. Der Indikator malt nicht neu und das Signal wird nicht verzögert. Hinweis: Bitte kombinieren Sie den Indikator mit Ihrem System, um die besten Erfahrungen mit dem Indikator zu machen. Parameter des Indikators : 1.Signalperioden 2.Bänder Perioden 3.Pfeilfarben 4.Alarme ----------
FREE

Übersicht
RenkoVP ist ein professionelles Tool zur Preisstrukturanalyse, das vollständig online auf dem Hauptchart läuft. Im Gegensatz zu vielen anderen Renko-Indikatoren benötigt er keine Offline-Charts. Der Indikator kombiniert Renko-Bausteine, Volumenprofil, dynamische Fibonacci-Levels und automatische Mustererkennung, um Händlern zu helfen, Trends, Schlüsselzonen und präzise Einstiegs- und Ausstiegspunkte zu identifizieren. Renko Bricks Konfiguration
Der Indikator bietet sowohl manuelle als

ChronoVolume Ausführlicher Blog-Beitrag mit Bildschirmfotos: https://www.mql5.com/en/blogs/post/763650
Es handelt sich um einen fortgeschrittenen Indikator zur Volumenanalyse.
Überblick:
ChronoVolume analysiert Volumendaten in MetaTrader 4, indem es das grundlegende Tick-Volumen in aussagekräftige Handelseinblicke umwandelt.
Da MT4 nur das Tick-Volumen (Anzahl der Preisänderungen) liefert, verwendet dieser Indikator Algorithmen, um den Kauf- und Verkaufsdruck zu schätzen, wodurch Sie ein klare
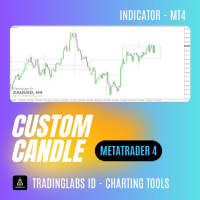
Benutzerdefinierte Kerze - Multi-Timeframe-Visualisierung Die Analyse mehrerer Timeframes ist für präzise Handelsentscheidungen unerlässlich, aber der Wechsel zwischen den Charts kann unbequem und ineffizient sein. Der Custom Candle-Indikator löst dieses Problem, indem er Kerzen mit höherem Zeitrahmen (HTF) direkt in Ihren Chart mit niedrigerem Zeitrahmen (LTF) einblendet. So können Sie das Gesamtbild auf einen Blick sehen, sich am übergeordneten Trend orientieren und die Handelsgenauigkeit verb
FREE
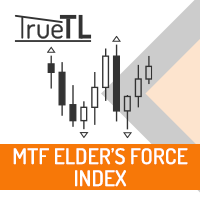
Fortgeschrittener Elder's Force Index (EFI) Indikator mit Unterstützung für mehrere Zeitrahmen, anpassbaren visuellen Signalen und hochgradig konfigurierbarem Warnsystem.
Merkmale: Visuelle Signalmarker (Pfeile und/oder vertikale Linien) mit anpassbaren Farben und Codes Drei unabhängige Signalpuffer mit konfigurierbaren Auslösern (Richtungswechsel, Pegelkreuzung, Peak/Valley) Hochgradig anpassbare Warnfunktionen für jedes Signal (per E-Mail, Push, Ton, Popup) Konfigurierbarer Alarmzeitpunkt (n
FREE

## Daily SR Navigator: Ihre tägliche Handelskarte Navigieren Sie den Markt mit Präzision und nutzen Sie die Kraft des Daily Open Price! Sind Sie es leid, jeden Tag manuell Unterstützungs- und Widerstandslinien (SR) zu zeichnen, nur um dann festzustellen, dass sie ungenau sind? Der Daily SR Navigator ist die intelligente Lösung, um Ihre technische Analyse zu automatisieren. Er liefert Ihnen wichtige und vom Markt beachtete Niveaus, insbesondere für XAUUSD (Gold) . Dieser Indikator ist das Ergebni
FREE
Dynamischer Farb-Fibonacci-Indikator Dieses Tool wurde entwickelt, um den Prozess des Zeichnens und Aktualisierens von Fibonacci-Levels in Ihrem Chart zu automatisieren. Es passt sich automatisch an Markttrends an und liefert klare visuelle Hinweise und Warnungen, die Ihnen bei der Analyse von Kursbewegungen helfen. Hauptmerkmale Adaptive Farben: Die Fibonacci-Linien ändern automatisch ihre Farbe, um den aktuellen Trend widerzuspiegeln. Sie erscheinen blau bei Aufwärtstrends und rot bei Abwärts
VortexX ULTRA PRO - Leistungsstarker Pfeilindikator für BTCUSD & EURUSD VortexX ULTRA PRO ist ein hochpräziser Pfeilindikator für MetaTrader 4, der für den sicheren Handel auf den Zeitrahmen H4 und D1 entwickelt wurde. Speziell für BTCUSD und EURUSD optimiert, liefert er zuverlässige und genaue Kauf-/Verkaufssignale - auch bei hoher Marktvolatilität. Hauptmerkmale von VortexX ULTRA PRO : ️ Funktioniert auf H4- und D1-Zeitfenstern ️ Optimiert für BTCUSD und EURUSD ️ Basiert auf einer bewähr
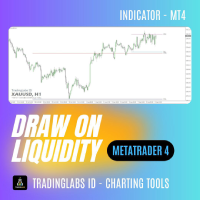
Abruf von Liquidität (DOL) - PDHL, PWHL & Kill Zones Liquiditätsniveaus wirken oft als Magneten für Kursbewegungen. Die Höchst- und Tiefststände des Vortages (PDHL) und der Vorwoche (PWHL) sind wichtige Bezugspunkte, an denen sich Stop-Orders und institutionelle Aktivitäten häufen. Die manuelle Identifizierung dieser Niveaus ist zeitaufwändig und fehleranfällig. Der Draw On Liquidity (DOL)-Indikator stellt diese wichtigen Niveaus automatisch auf Ihrem Chart dar und hebt durch Session Kill Zones
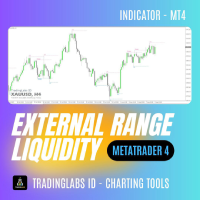
Liquidität im Außenbereich - Marktstrukturabbildung Das objektive Lesen der Marktstruktur ist die Grundlage jeder erfolgreichen Handelsstrategie. Die manuelle Identifizierung von Swing Highs/Lows, Higher Highs (HH) oder Lower Lows (LL) ist jedoch oft subjektiv und verwirrend, insbesondere für angehende Trader. Der External Range Liquidity-Indikator ist Ihre Komplettlösung. Dieses Tool erkennt und kennzeichnet automatisch diese entscheidenden Marktstrukturpunkte direkt auf Ihrem MT4-Chart. Es bie

Dominanz spiegeln
Zweck: die Stärke zweier Währungspaare visuell zu vergleichen und die Momente des Dominanzwechsels zu erkennen. Der Indikator erstellt zwei Spiegelungslinien für die ausgewählten Paare in einem separaten Fenster, zeigt ihre Konvergenz/Divergenz an und gibt Signale, wenn sie sich kreuzen (Marker im Hauptdiagramm). Es gibt Alert- und Push-Benachrichtigungen (optional) sowie einen Mini-Marker für den virtuellen Gewinn des letzten Signals.
Autor: Alexander Lapin | Plattform: MT4

BONUSINDIKATOR HIER : https://linktr.ee/ARFXTools
Handelsfluss mit Fibo Eminence Signal 1️⃣ Warten Sie auf den automatischen Fibonacci-Draw Das System erkennt automatisch Schwankungen (vom Hoch zum Tief oder umgekehrt) Sobald die Fibonacci-Levels erscheinen, sendet der Indikator eine Warnmeldung "Fibonacci erkannt! Zone ist bereit." 2️⃣ Überprüfen Sie die Einstiegszone Schauen Sie sich die ENTRY LINE (blaue Zone) an. Dies ist der empfohlene SELL-Einstiegsbereich (wenn die Fibonacci-Linie
MetaTrader Market bietet jedem Entwickler eine einfache und bequeme Plattform für den Verkauf von Programmen.
Wir unterstützen Sie bei der Veröffentlichung des Produkts und beraten Sie gerne, wie man eine Beschreibung für den Market vorbereitet. Alle Produkte, die im Market verkauft werden, sind durch eine zusätzliche Verschlüsselung geschützt und können nur auf dem Rechner des Kunden gestartet werden. Illegales Kopieren ist ausgeschlossen.
Sie verpassen Handelsmöglichkeiten:
- Freie Handelsapplikationen
- Über 8.000 Signale zum Kopieren
- Wirtschaftsnachrichten für die Lage an den Finanzmärkte
Registrierung
Einloggen
Wenn Sie kein Benutzerkonto haben, registrieren Sie sich
Erlauben Sie die Verwendung von Cookies, um sich auf der Website MQL5.com anzumelden.
Bitte aktivieren Sie die notwendige Einstellung in Ihrem Browser, da Sie sich sonst nicht einloggen können.