YouTubeにあるマーケットチュートリアルビデオをご覧ください
ロボットや指標を購入する
仮想ホスティングで
EAを実行
EAを実行
ロボットや指標を購入前にテストする
マーケットで収入を得る
販売のためにプロダクトをプレゼンテーションする方法
MetaTrader 4のための新しいテクニカル指標 - 16

Scalpetronix Indicator — Scalpetronix ロボットのシグナルコア このインジケーターは、Expert Advisor Scalpetronix が基盤としているアルゴリズムとシグナルを実装しています。ロボットのすべてのエントリーは、次の計算に基づいて生成されます:指数移動平均 (EMA) の組み合わせ、ADX によるトレンドフィルタリング、ATR によるボラティリティ正規化、ローソク足構造の分析。 インジケーターの利点 動的な閾値を持つマルチレベル EMA システム(高速と低速)を使用; ADX フィルターによって弱いシグナルを排除; ATR を通じてボラティリティを考慮し、市場の異なるフェーズに感度を適応; ローソク足の構造を分析(買いは HH/HL モデル、売りは LH/LL モデル); 多層ラインとフェーズの塗りつぶしによってシグナルを可視化し、エントリーポイントに矢印を描画。 動作アルゴリズム EMA と動的閾値の計算
sep(t) = max(Point, 0.1 * ATR(t))
— 買い状態: EMA_fast(t) > EMA_slo

First time on MetaTrader, introducing IQ Star Lines - an original Vedic Astrology based indicator. "Millionaires don't use astrology, billionaires do" . - J.P. Morgan, Legendary American financier and banker.
IQ Star Lines, an unique astrological indicator purely based on Vedic astrology calculations, published for the first time on Metatrader. This unique tool plots dynamic planetary grid lines based on real-time stars, constellations, and celestial movements, which allows you to plot t
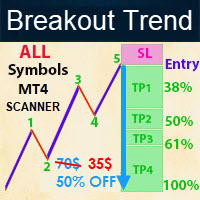
- Real price is 70$ - 50% Discount (It is 35$ now) Contact me for instruction, any questions! - Lifetime update free - Non-repaint - I just sell my products in Elif Kaya Profile, any other websites are stolen old versions, So no any new updates or support. Introduction Breakout Trend Scanner indicator works based on the Elliott Wave in technical analysis describes price movements in the financial market that are related to changes in trader sentiment and psychology and finds end of movement and
ChartFix – Fixed Scale and Pan Chart Controls for MT4 ChartFix is a lightweight indicator that adds convenient on-chart navigation tools to MetaTrader 4. The controls are designed to offer a chart interaction style that creates an optional switch between MT4 default auto scale feature and a fixed scale chart that can be moved up and down and easily scaled vertically. Main Functions Zoom In / Zoom Out – Adjust the chart scale directly from on-screen buttons. Scale Mode Switch – Toggle between MT4
HTF MACD – Trend-Aligned Signals (one subwindow, arrows on chart) What it does
This indicator keeps you trading with the higher-timeframe trend while using MACD crosses for precise entries. In a single subwindow it shows: HTF Trend Histogram — green = uptrend, red = downtrend (neutral is hidden for a cleaner view) MACD Lines — blue = MACD main, orange = MACD signal Arrows on the price chart when a valid, trend-aligned MACD cross occurs Optional alerts on bar close Entry logic (strict, closed-ba
FREE
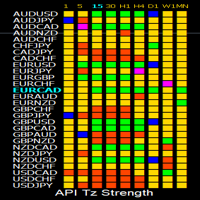
API Tz Strength Indicator MT4 – All-in-One Strength Dashboard for 28 Symbols and 9 Timeframes Take your Strength analysis to the next level with one powerful dashboard. The API Tz Strength Indicator MT4 is designed for traders who want to track market strength and reversals across multiple symbols and timeframes – all from a single chart. With advanced clickable controls, customizable watchlists, and smart alerts, this tool simplifies multi-symbol, multi-timeframe analysis like never before. ___

My Fibonacci An automated Fibonacci indicator that combines ZigZag swing detection with comprehensive Expert Advisor integration through a 20-buffer system. More details about data specification and EA integration: https://www.mql5.com/en/blogs/post/764109 Core Features Automated Fibonacci Detection The indicator identifies swing points using configurable ZigZag parameters and draws Fibonacci retracements and extensions automatically. It updates levels as new swing formations develop. Market Ad
FREE
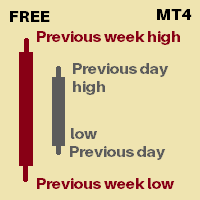
Its an indicator that will show you
Previous day high Previous day low Previous week high Previous week low You can set how many days of history you would like to see for previous day high low and previous week high low Currently 30 days of PDH/L will be marked 4 weeks of PWH/L will be marked You can change it from indicator settings. Dates are shown at marking lines to identify which date does that marking belongs to.
Thank you :) Always open to feedback and criticism if it helps me provide yo
FREE
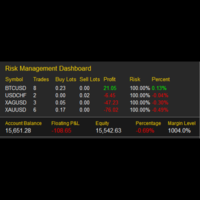
My Risk Management The Risk Management Dashboard is a visual tool designed to help traders monitor risk exposure in real time. With a clear and compact layout, it provides an instant overview of trading activity, enabling more disciplined and informed decision-making. Key Features Active Symbol Summary
Displays all traded symbols with the number of trades, total buy/sell lots, and current profit/loss. Per-Symbol Risk Analysis
Calculates and shows the risk percentage of each symbol relative to
FREE
Description in English Currency Strength Money PRO — The Ultimate Currency Strength Indicator The Currency Strength Money PRO was designed for traders who need clarity and accuracy when analyzing Forex and Metals markets. ️ Modern LiveCharts-style display — colored bars instantly show which currencies are strong and which are weak.
️ Fully customizable — select currencies, timeframes, weights, and colors to fit your strategy.
️ Smart alerts — get notifications when a true imbalance between

Профессиональный индикатор "Choch Pattern Levels" с RSI-фильтром для MT4 Описание: Вы устали от ложных пробоев и хотите находить точки разворота тренда с высокой точностью? Индикатор Choch Pattern Levels — это ваш профессиональный инструмент для определения смены характера рынка (Change of Character), дополненный мощным фильтром RSI и анализом объемов , чтобы вы входили в рынок только по самым надежным сигналам. Этот индикатор автоматически находит и отрисовывает на графике ключевые паттерны раз
FREE

4 trendlines are given by 2 timeframes, defined by the zigzag indicator. It leverages the Zig Zag indicator to identify significant highs and lows across two configurable timeframes (default: M15 for short-term and H1 for medium-term), automatically plotting upward and downward trendlines for each. This helps visualize trend structures, reversals, and alignments between timeframes without switching charts, while adhering to trendline rules that contain the high and low points of the previous two
FREE
Multi-Timeframe EMA Momentum Filter — Version 1.0 This indicator is designed to help traders evaluate short-term EMA crossovers in the context of higher timeframe momentum. Its purpose is to reduce noise and highlight setups that align with the broader market trend. How it works: On the main chart, arrows appear when a fast EMA crosses a slow EMA on the current timeframe, provided that higher timeframe momentum confirms the direction. In the subwindow, a histogram displays the difference betwee
FREE
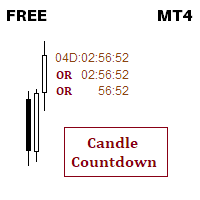
This indicator is about candle countdown timer
You can change timer color 3 colors can be set for different time range You can set font size, you can set font name If you need anything extra, ping me, I will add that functionality. Thank you :) Always open to feedback and criticism if it helps me provide you more value. - Rahul
My other indicators you may like
[I have been trading forex for last 6 years and i publish every indicator that i build for my personal use so everyone can benefit]
FREE
RangePower Index is an MT4 indicator that accurately measures the strength of currencies, indices, gold and oil based on their daily range. Thanks to this, you will immediately know which assets have real momentum and which, on the contrary, are losing strength.
Daily range analysis (high–low) for currencies, indices, gold and oil Quick visualization of the strongest and weakest assets With RangePower Index you will gain a clear competitive advantage - trade only where there is real market
FREE

Description The BBMA + EMA50 Structure is a basic BBMA trading framework indicator combined with EMA 50 and First Momentum detection .
It helps traders to quickly identify market structure, momentum shifts, and potential entry points with clear visual signals. Key Features: BBMA Structure : Displays the essential Bollinger Bands + Moving Average framework. EMA 50 Filter : Helps confirm trend direction and structure bias. First Momentum Detector : Automatically detects the first momentum breako
FREE
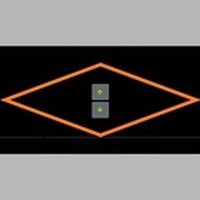
Symbol Cycler is a lightweight on-chart utility that lets you quickly switch between symbols in your Market Watch list using two simple arrow buttons (). With a single click, you can scroll forward or backward through your predefined symbols without leaving the chart. Key Features: One-click symbol switching from the chart Works with your Market Watch list order Buttons can be placed in any chart corner or even the center Timeframe remains locked while switching symbols Clean, responsive UI
FREE
What is this Indicator?
The Volume Power Meter is a lightweight MT4 indicator that measures the strength of trading volume and converts it into an easy-to-read rating between 1/10 and 10/10 .
Instead of showing complex histograms or volume bars, it gives traders a simple numeric score in one corner of the chart: 1/10 = Very weak volume 5/10 = Average volume 10/10 = Extremely high volume This helps traders quickly judge market participation and momentum without cluttering th

NeoPrescience AI: The Ultimate All-in-One Trading Dashboard & Scanner Main Dashboard on a clean chart. A Buy/Sell signal with TP/SL projection zones. Scanner Panel showing multiple high-confidence setups. A non-Forex chart (e.g., XAUUSD or BTCUSD) to highlight versatility.
Stop Guessing. Start Trading with Data-Driven Confidence. Cluttered charts. Dozens of conflicting indicators. Missed opportunities. NeoPrescience AI changes everything.
This is not just another indicator — it is your complet
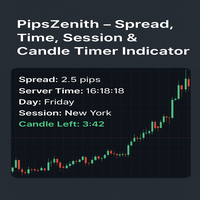
PipsZenith – Spread, Time, Session & Candle Timer Indicator (v3.2) Description:
Stay one step ahead in Forex trading with PipsZenith , the ultimate on-chart tool that gives you everything you need at a glance. Designed for precision traders, this indicator displays: Real-time Spread – Know the exact cost of your trades instantly. Server Time – Always stay synchronized with broker time. Day & Weekday Info – Track your trading week effortlessly. Active Trading Session – Instantly identify Tokyo,
Advanced SRP (Strong Retracement/Reversal Points) Tired of support and resistance indicators that constantly repaint, clutter your charts with irrelevant lines, and fail across different timeframes? It's time to stop guessing and start trading with institutional-grade clarity. Advanced SRP is not just another S/R tool; it's a definitive market structure indicator designed for the serious trader. It identifies and displays the most critical price levels where the market is statistically likely t
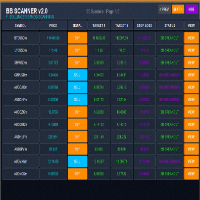
BB Scanner MT4 is a powerful, next-generation market scanner that detects Bollinger Bands breakouts across multiple symbols and timeframes.
It provides a modern, interactive dashboard that displays signals, entry price, target levels, stop loss, and real-time status — all in one place. Key Features Multi-Symbol & Multi-Timeframe Scanning (auto or custom list) Precise BB Breakout Detection (Buy/Sell with ATR-based targets) Automatic Target 1, Target 2, Stop Loss calculation ️ Modern
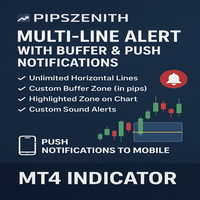
Multi-Line Alert with Buffer & Push Notifications (MT4 Indicator) Originally shared as a free community tool , this upgraded version is now available on the MQL Market for traders who want professional-grade alerts without sitting in front of the screen all day. With this indicator, simply place horizontal lines on your chart — the indicator will automatically track them, highlight your chosen buffer zone, and notify you the moment price approaches your level. Whether you’re trading support/r

Session Kill zones with panel for quick changes.
Asia Killzone London Killzone New York Killzone London Close Killzone In this indicator GMT+2 timings are used that are most common among many brokers. read the image attached in the screenshots to know more about sessions adjustments Session timings can be changed according to your broker timings and day light savings.
Thank you :) Always open to feedback and criticism if it helps me provide you more value. - Rahul My other indicators you may l

PipsZenith Smart Money Momentum Zones (SM-MZ) v1.0 Brand: PipsZenith
Platform: MetaTrader 4 (MT4)
Type: Momentum / Smart Money / Swing Zone Indicator
Version: 1.0 Overview Unlock the secrets of the market with PipsZenith SM-MZ , a revolutionary momentum-based indicator inspired by Smart Money and liquidity concepts . SM-MZ detects areas where momentum accelerates near swing highs and lows—highlighting potential explosive price zones before big market moves. Perfect for traders looking to anticip
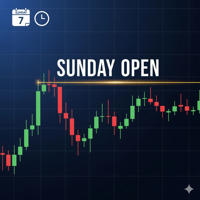
Версия на английском языке https://www.mql5.com/ru/market/product/148576?source=Site +Profile+Seller Это руководство создано, чтобы помочь начинающим трейдерам понять, как работает и настраивается индикатор "Sunday Open", а также как правильно интерпретировать его сигналы для принятия взвешенных торговых решений. Часть 1: Что такое индикатор Sunday Open и как его использовать? Основная идея В основе индикатора лежит простая, но мощная концепция: цена открытия недели является ключевым уровнем по

NEXT price Actions - Series One
1. Auto Mapping Projection Price Action XAUUSD to get the most accurate setup for each Entry Zone. 2. The tool used has been customized according to Swap Zones setup.
3. The setup that results after Mapping is all setups, namely Scalping, Intraday, and Swing.
4. This setup does not need a marking and depends on SNR & SND.
5. This setup only depends 100% on the tool used.
6. This setup is very suitable for getting an Entry in a shadow candle stick.
7. This s
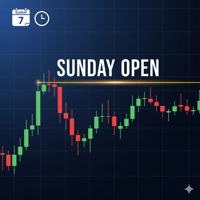
Russian version https://www.mql5.com/ru/market/product/148571?source=Site +Profile+Seller This guide is designed to help beginner traders understand how the "Sunday Open " indicator works and is configured, as well as how to properly interpret its signals for making informed trading decisions. Part 1: What is the Sunday Open Indicator and How to Use It? Core Concept The indicator is based on a simple but powerful concept: the weekly opening price is a key support and resistance level. Imagine t

NEXT price Actions - Daily Pivots
1. Auto Mapping Projection Price Action XAUUSD to get the most accurate setup for each Entry Lines.
2. The tool used has been customized according to Swap Pivots setup.
3. The setup that results after Mapping is suitable for Intraday
4. This setup does not need a marking and depends on SNR & SND.
5. This setup only depends 100% on the tool used.
6. This setup is very suitable for getting an Entry in a shadow candle stick.
7. This setup will also follow th

PipsZenith Smart Money Swing (SMC) Indicator v1.0 Bring Institutional Trading Power to Your MT4 Charts The PipsZenith Smart Money Swing (SMC) Indicator is a cutting-edge trading tool designed for professional traders who want to trade Smart Money Concepts (SMC) directly in MetaTrader 4.
It combines market structure analysis, order block detection, liquidity mapping, and imbalance zones into a single, powerful and fully customizable indicator. This is not just another repainting arrow tool

Candlestick Momentum is a professional-grade technical analysis indicator that identifies high-momentum candlesticks using advanced ATR (Average True Range) analysis. This indicator helps traders identify potential trend continuation or reversal points by detecting candles with strong directional movement and minimal wicks.
Trading Strategies
Strategy 1: Momentum Breakout - Setup : Wait for momentum candle signals - Entry : Enter on arrow signal - Stop Loss : Below/above the momentum candle -

Apollo Trend Riderは、買いと売りのシグナルを提供する使いやすい矢印インジケーターです。インジケーターはリペイントされないため、テストを行い、取引に使用するあらゆる取引商品や時間枠に適応させることができます。プッシュ通知を含むあらゆる種類のアラート機能も備えています。 このインジケーターは、トレンド、ブレイクアウト、反転といった複数の戦略を組み合わせたものです。このインジケーターはスタンドアロンシステムとしても使用できます。しかし、取引をより良く、よりシンプルにするために、取引する銘柄の価格チャネルとトレンドの方向を確認するのに役立つ特別なテンプレートを無料で提供しています。 Apollo Trend Riderインジケーターは、あらゆる取引商品と時間枠で使用できます。通貨、指数、株式、仮想通貨など、あらゆる取引商品で使用できます。 購入後に私に連絡して、取引のヒント、特別なテンプレート ファイル、素晴らしいボーナスを入手してください。 あなたの取引が大成功することを祈っています!
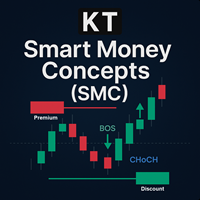
KT SMC インジケーターは、リアルタイムですべてのバーをスキャンし、 ブレイク・オブ・ストラクチャー (BOS)、キャラクターの変化 (CHoCH)、オーダーブロック、フェアバリューギャップ (FVG)、プレミアム/ディスカウントゾーン、イコールハイ/ロー などの主要な Smart Money Concepts の要素をマークします。これらは ICT によって広められ、世界中のプライスアクション・トレーダーに利用されています。チャート上に明確で視覚的なサインを表示するため、初心者でも自信を持ってマーケットフローを読み解くことができます。
Smart Money Concepts は、大口プレイヤーが買い流動性や売り流動性を残す場所を特定することに焦点を当てています。これらの流動性プールを追跡することで、トレーダーはランダムなサポートやレジスタンスに頼るのではなく、より明確なエントリーゾーンとエグジットゾーンを見極めることができます。
特徴
SMC のコア要素のみを強調表示: BOS、CHoCH、オーダーブロック、FVG、イコールハイ/ロー。チャートを整理された状態に保ち、見や
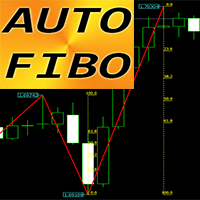
Crypto_Forexインジケーター「 Auto FIBO 」は、取引の補助ツールとして最適です!
- このインジケーターは、フィボナッチレベルとローカルトレンドライン(赤色)を自動計算し、チャート上に表示します。 - フィボナッチレベルは、価格が反転する可能性のある重要なエリアを示します。 - 最も重要なレベルは、23.6%、38.2%、50%、61.8%です。 - リバーサルスキャルピングやゾーングリッドトレードにも活用できます。 - Auto FIBOインジケーターを使用することで、既存のシステムを改善する機会も数多くあります。
高品質のトレーディングロボットとインジケーターをご覧になるにはここをクリックしてください! これは、このMQL5ウェブサイトでのみ提供されるオリジナル製品です。

Support Resistance Breakout Indicator MT4でブレイクアウト取引を強化しましょう。このZigZagを基盤とした強力なツールは、サポートとレジスタンスゾーンを動的に特定し、外国為替、株式、暗号通貨、商品市場で高確率のエントリーのための確認済みブレイクアウトシグナルを提供します。InvestopediaやBabyPipsなどのサイトで紹介されている確立された価格アクションの原則に基づき、サポート/レジスタンスのブレイクアウトは、買い手と売り手のダイナミクスの変化によってトレンドの反転または継続を示すとされており、このインジケーターはRedditのr/Daytradingやr/Forex、Forex Factoryフォーラムなどのトレーディングコミュニティで高く評価されています。ユーザーは有効なブレイクアウトの検出精度が最大75%に達し、クローズベースのトリガーによる偽シグナルの減少、基本的な確認を組み合わせることで勝率が15-30%向上し、しばしば不安定なセッションを収益機会に変えると報告しています。主な利点には、モメンタムを活用するための正確なブレイ
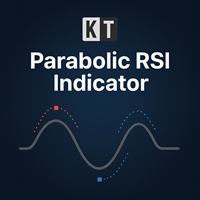
KT Parabolic RSI は、RSI ラインの上にパラボリックSARを直接重ねて表示し、市場の転換点をわかりやすく強調します。従来のRSIの買われすぎ・売られすぎ水準はすでに反転を示唆しますが、PSARフィルターを追加することで不要なノイズを取り除き、シグナルをより明確かつ信頼できるものにし、取引機会をより精度の高い形で提供します。 大きな四角シグナル: RSIが買われすぎまたは売られすぎゾーンにあるときにパラボリックSARが反転。このサインは高い確率で市場の転換を示します。 小さな四角シグナル: RSIが中立帯の範囲にあるときのSAR反転。これらは低確率のシグナルとして扱い、部分的な利確や既存トレンドの継続に活用できます。
特徴 RSIのモメンタムとパラボリックSARのトレンド反転を1つの画面に統合し、2つのインジケーターを別々に管理する必要がなくなります。 RSIウィンドウに表示される四角マーカーはメインチャート上にも反映されるため、価格の動きを見ながらシグナルを確認できます。 ローソク足分析とRSI-SARの定量シグナルを組み合わせ、エントリー前にチャートパターンを確認
説明
Volatility ATR Crossover Histogram は MetaTrader 4 用のインジケーターで、高速 ATR と低速 ATR を比較することでボラティリティの拡大と収縮を測定します。結果は別ウィンドウのカラーヒストグラムに表示されます。緑色のバーはボラティリティ上昇局面を示し、赤色のバーはボラティリティ低下局面を示します。エントリータイミング、トレード管理、市場環境の検出に役立つユニバーサルフィルターとして設計されています。 動作原理
このインジケーターは、カスタマイズ可能な期間で 2 つの ATR を計算し、その差を描画します。高速 ATR が低速 ATR を上回ると、ヒストグラムは正となり緑色になります。高速 ATR が低速 ATR を下回ると、ヒストグラムは負となり赤色になります。これによりボラティリティのレジームシフトが強調され、ブレイクアウトトレード、トレンドフォロー、平均回帰戦略に有効です。 トレードシグナル
緑のヒストグラムがゼロ以上 → ブレイクアウトやトレンド継続に適した市場。
赤のヒストグラムがゼロ以下 → レンジ相場、押し目、
FREE
ドンチャン・グラデーションは 、従来のチャネル分析を直感的な トレンド追跡システム に変革します。色の変化がダイナミックなドンチャン・チャネルを価格チャートに直接描画し、 リアルタイムの色の変化を通してトレンドの強さ と 市場 バイアスの変化を視覚的に示します。この自動適応型価格チャネルは、境界線と色相を調整することで 、新たなトレンドを確認し、潜在的な反転を察知し 、 ブレイクアウトの機会が生まれるとそれをハイライトします 。色分けされた視覚化により、複雑な価格アクションの解釈が簡素化され、トレーダーは市場の勢いを一目で把握できるようになります。
仕組み このツールは継続的に計算し、 最高値と最低値 選択した期間(デフォルト:10本のバー)のチャートを、メインチャート上に変化するチャネルとして描画します。色のグラデーションは市場の状況に応じて変化します。 強気バイアス(青): チャネル上限付近での価格取引 弱気バイアス(赤): チャネル下限値の価格テスト
主な特徴 ライブチャンネルの視覚化: 価格抑制の境界をチャート上で直接確認 適応型カラーコ
Bias Finderとは Bias Finder (with Export) は、市場の統計的なバイアスを検出・分析し、繰り返し現れる傾向をわかりやすく可視化する高度なインジケーターです。裁量トレーダーからシステムトレーダーまで、定量分析をトレード戦略に取り入れたい方に最適なツールです。 分析モード このインジケーターは、さまざまな時間的ロジックに基づいて価格バイアスを計算・表示します: Hourly Bias :時間ごとの統計分析 Weekday Bias :曜日別のパフォーマンス分布 Day-of-Month Bias :月の日ごとの価格挙動 Monthly Bias :月単位の傾向分析 主な機能 見やすく整理された表形式での表示 合計損益、回数、平均損益 の詳細データを提供 プラス・マイナスを自動で強調表示(色はカスタマイズ可能) ワンクリックで CSV形式にエクスポート 任意のチャートに合わせた表示調整が可能 トレードにおける利点 繰り返し出現する市場パターンを即座に把握 季節性や市場サイクル に基づく戦略に最適 裁量分析 と 定量的システム開発 の両方に対応 エクスポートし

SuperTrend new formula – 高度な SuperTrend インジケーターで正確なマーケット分析 SuperTrend new formula は、人気のある SuperTrend インジケーターを改良したバージョンであり、現代のトレーダーのニーズに応えるよう設計されています。従来のツールとは異なり、このインジケーターは局所的な極値分析、ダイナミックなレベル、そして適応型アルゴリズムを組み合わせることで、市場の各フェーズをより明確かつ体系的に表示します。 SuperTrend new formula は、上部と下部の 2 本のダイナミックラインを描写し、強気と弱気の動きを視覚的に分離します。モメンタムが変化するとラインは自動的に再計算され、主観的な推測に頼らずに実際のトレンド方向を特定するのに役立ちます。 なぜ SuperTrend new formula は従来の SuperTrend より優れているのか: 局所的なボラティリティに適応し、偽の価格変動をフィルタリング。 強気局面(青いライン)と弱気局面(オレンジのライン)を明確に区別。 M1 から D1 以上まで
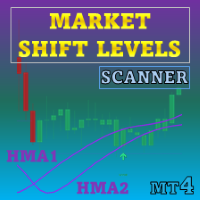
特別オファー : ALL TOOLS 、各 $35 のみ! 新しいツール は 最初の 1 週間 または 最初の 3 回の購入 について $30 になります! MQL5 の Trading Tools チャンネル :私の最新情報を受け取るため、MQL5 チャンネルに参加してください このインジケーターは、Hull Moving Average(HMA)のロジックを用いてトレンドの転換を特定し、市場構造の転換点を可視化します。価格が反応しやすい潜在的なサポート/レジスタンス領域を強調し、初期のトレンド移行を観察するのに役立ちます。 MT5 版はこちら: Market Shift Levels MT5 Scanner MT4 版はこちら: Market Shift Levels MT4 Scanner その他の製品はこちら: All P roducts Market Shift Levels は、市場行動の方向変化を示す水平ゾーンです。これらのシフトは、遅延を抑えつつ反転の可能性を示すよう設計された 2 本の平滑化された HMAs のクロスから導出されます。
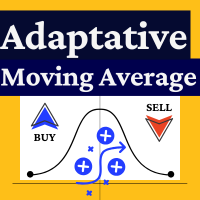
Zeiierman アダプティブ移動平均線は、適応的なトレンド分析を通じて取引機会を特定するために設計されたテクニカル分析ツールです。これは、TradingView における Zeiierman のオリジナル指標を基にした Metatrader 用の適応版であり、複数の分析手法を組み合わせて市場の視覚的な評価を提供します。
技術的特徴 市場のボラティリティに基づく適応的平滑化アルゴリズムを使用 感度を動的に調整するために効率比 (ER) を計算 ボラティリティ測定のためにシグマバンドを組み込み 色付きの移動平均線によってトレンド方向を表示 トレンド変化やシグナルに関する設定可能なアラートを含む
機能
このインジケーターは市場データを処理して以下を行います: ボラティリティの状況に応じて平滑化係数を調整 色の変化によってトレンド方向を表示(強気、弱気、または中立) シグマに基づく条件を用いてエントリーおよびエグジットの可能性を生成 トレンドを視覚化するためのローソク足カラー表示をオプションで提供
想定される利用例 トレンドフォロー戦略や平均回帰戦略に役立つ可能性がある 外国為替、株

Trend Catcher for MT4 – 精密取引のための高度なパートナー Trend Catcher for MT4 は、精度・信頼性・使いやすさを兼ね備えた革新的なインジケーターであり、トレーダーに金融市場分析のための高度なツールを提供します。高度なアルゴリズムに基づき、価格変動や市場のボラティリティを解析し、トレンドの始まり、潜在的な反転、戦略的なエントリーやイグジットポイントを示す明確かつタイムリーなシグナルを生成します。 Trend Catcher for MT4 の強みの一つは、さまざまな市場環境に適応できる能力です。レンジ相場から強いトレンドまで、一貫性のあるシグナルを提供し、誤ったシグナルを最小限に抑え、トレーダーの意思決定に自信を与えます。パラメータを自由にカスタマイズできるため、初心者から熟練トレーダーまで、自身の取引スタイルに最適化して使用できます。 インジケーターは、ボラティリティや価格ダイナミクスに基づいた分析を統合し、トレンドモメンタム、サポートとレジスタンス、重要な反転ポイントといった技術的要素を組み合わせています。これにより、市場を包括的に捉え、従

You Trade with "The Trend is your Friend!" Attitude?
This is your Indicator... Golden Trend Alert Pro Tired of having MT4 and TradingView open because you can't get your trendline alerts?
You don't want to miss your trade anymore?
With the Golden Trend Alert Pro you will definitely never miss the trend in your direction again. You simply install the indicator in the terminal and then draw your trend lines.
The trend lines must be labeled "Alarm_up_..." or "Alarm_down..." Alarm_up, you will s

This masterpiece blends cutting-edge Advance MA, HMA, and Momentum logic into stunning gold star signals, giving you the power to spot market shifts without the guesswork. Perfect for every trader—beginner or expert—this tool turns your XAUUSD charts into a goldmine of opportunity. Don’t just trade—thrive!
Why You’ll Love It
Crystal-Clear Signals : Gold star alerts highlight key market moments, guiding your decisions with ease. Smart Moving Average : Pair with the Advance MA to confidently de
FREE
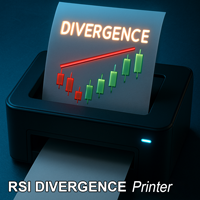
## RSI Divergence Printer Indicator This MetaTrader 4 (MT4) non repainting indicator automatically identifies and prints RSI divergences directly onto your price chart. This indicator can be used at any timeframes and is suitable for scalping, daytrading and swingtrading. In short, it looks for moments when the price is moving in one direction, but the underlying momentum is moving in the opposite direction, signaling a potential trend reversal. ## Explanation of the Indicator This tool, the

Scalping Edge Pro Indicator Unleash the Power of Precision Trading: Introducing Scalping Edge Pro Tired of market noise and conflicting signals that cloud your judgment? Are you searching for a tool that delivers the clarity and confidence needed to seize rapid opportunities in volatile markets? Scalping Edge Pro is the engineered solution designed for traders who demand precision and professionalism in every trade. It is meticulously calibrated for peak performance on the 15-minute (M15) timef
FREE

The TPX Dash Needle is everything you need to find the famous Didi Needles on several timeframes and in several pairs at the same time. These are the simultaneous meeting of the 3, 8 and 20 averages that, aligned with the ADX indicator, are synonymous with large and strong movements in the market. Now with the new Heiken Aish filter, the name of the pair shows the direction of the Heiken Aish you choose, it can be weekly or daily, all signals will appear on the screen, but now you can configure

Scalper Arrow x is a buy sell arrow type indicator, the strategy behind its signals is based on the MFI indicator with trend filter using Halftrend formula, this indicator can be used alone or mixed with other tools. NOTE : THIS INDICATOR DOESN'T REPAINT OR BACK PAINT, AND ITS ARROW SIGNALS ARE NOT DELAYED. ---------------------------------------------------------------
FREE

トレンドパルスワンは、改良版パラボリックSARを基盤としており、矢印シグナルを補完する新世代の指標です。この指標は、トレンド分析プロセスを簡素化し、トレーダーに対して明確で視覚的に理解しやすいエントリーポイントとエグジットポイントを提供することを目的としています。
標準SARとの主な違いは、トレンドパルスがSARラインにトレンド方向の変化を示す矢印を追加している点です。これにより、視覚的な分析や実際の取引に役立つ指標となっています。
インジケーターの仕組み
SARライン(ライム色):
現在のトレンド方向を示す動的曲線として表示されます。
・SARが価格の下にある場合、市場は上昇トレンドにあります。
・SARが価格の上にある場合、市場は下降トレンドにあります。
・ チャートの矢印
青い上向き矢印(BUY):トレンドが上昇トレンドに転換した際に表示されます。
赤い下向き矢印(SELL):トレンドが下降トレンドに転換した際に表示されます。
フィルタリングアルゴリズム:
動的なステップ値と最大値を使用し、さまざまな市

Introducing the Professional Arka STM Signal Indicator
With Arka Candle Close Time – 100% Free Version Fast, Accurate, and Unmatched in Identifying Trading Opportunities
This indicator is the result of combining advanced price action analysis with specialized market algorithms, delivering clear, timely, and profitable signals. Completely Free – No Installation or Usage Limits
️ An automated trading bot, fully synchronized with it, is also ready to run. The Power of ARKA STM Si
FREE
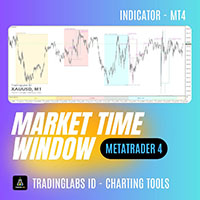
ICT Market Time Cycle – Complete Session & Time Window ICT Market Time Cycle is a professional trading indicator designed to help traders follow the ICT (Inner Circle Trader) methodology with ease.
It automatically displays the main market sessions (Asia, London, and New York), along with Killzones, Silver Bullet windows, and Macro times directly on your chart. With this tool, you no longer need to calculate session times manually – everything is plotted automatically in a clean and professional

Introducing the Professional Indicator ARKA – Candle Close Time
Do you want to always know the exact remaining time for the current candle to close? Or do you want to instantly see the real-time broker spread right on your chart without any extra calculations?
The ARKA – Candle Close Time indicator is designed exactly for this purpose: a simple yet extremely powerful tool for traders who value clarity, precision, and speed in their trading.
Key Features:
Displays the exact time re
FREE
Pair correlation divergence. Define your pair in indicator setting with this format : SYMBOL1:SYMBOL2,SYMBOL3:SYMBOL4 Already Defined Symbols : EURUSD:GBPUSD,AUDUSD:NZDUSD,USDCHF:EURUSD,USDCAD:Crude,XAUUSD:AUDUSD Symbol name should match the exact case as you see it in left panel where all symbols are listed. (Indicator will not work on strategy tester, strategy tester fail to load different symbols data internally, watch video for functional usage) CAUTION : If you drag any symbol on screen

Pro Trend Sniper is a powerful trading indicator designed for traders who demand accuracy and speed in spotting market opportunities. With advanced trend detection, it helps you identify clear entry and exit points , giving you the edge to stay ahead in the markets. Its clean design and easy-to-use interface make it perfect for both beginners and professionals, ensuring you trade with confidence and precision . With three profit targets (TP1, TP2, TP3) clearly displayed, you can secure profits s

Magical Arrow Indicator – Clear & Reliable Signals The Magical Arrow Indicator is a non-repainting, trend-following tool that gives you crystal-clear Buy and Sell signals .
It high-probability reversals and entries . No more guesswork – just follow the arrows on your chart! The Magical Arrow Indicator is a powerful, easy-to-use trading tool that helps you catch the most profitable Buy and Sell opportunities in the Forex market.
It is designed for beginners and professional traders , giving y
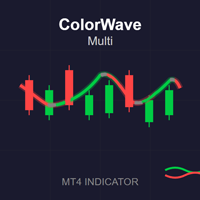
ColorWave Multi MA The ColorWave Multi MA is a highly configurable Moving Average (MA) indicator, with some advanced features: 1. Purpose of the indicator It draws a moving average line on the chart.
Instead of a single color, it splits the MA into three line segments :
Up (green) when the MA is rising,
Down (red) when the MA is falling,
Flat (gray, dotted) when the MA is flat within a threshold.
It supports many MA types , not just the standard SMA/EMA.
This is useful for traders b
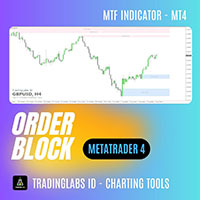
Order Block + Fair Value Gap (FVG) Indicator Multi-Timeframe Order Block + FVG Tool In the ICT (Inner Circle Trader) concept, Order Blocks (OB) + Fair Value Gaps (FVG) are among the most critical areas used by professional traders to read market structure, identify supply & demand zones, and spot high-probability entry points. The Order Block + FVG Indicator automatically detects and displays both Order Block zones and Fair Value Gaps directly on your MT4 charts. With multi-timeframe support, yo
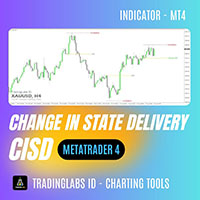
CISD (Change In State Delivery) Indicator TradingLabs ID – ICT Concept Tool The Change In State Delivery (CISD) Indicator is designed based on the ICT (Inner Circle Trader) concept, where price transitions from one delivery state to another often signal high-probability trade opportunities. This tool automatically detects and marks CISD levels on your MT4 charts, helping traders identify potential breakout and retest zones with great accuracy. It is especially useful for traders applying Smart

ALL IN ONE INDICATOR :
Auto Multi Trend : BBMA_MTF ( Trend Is Your Friend )
Auto Engulfing Arrow : Candle to Candle
Auto Fibo CBR : Breakout Confirmation Download Here https://linktr.ee/ARFXTools
Auto Smart Money Area : Download Here https://linktr.ee/ARFXTools
BBMA Arrow MACD Trend Strategy (High-Probability Reentry) ️ Core Concept: A fusion of BBMA (Bollinger Bands + MAs) , CSAK/CSM Arrows , and MACD to spot high-probability trend reentry setups , validated across multiple time

Oil Master indicator is a very beginner-friendly buy sell arrow type indicator that works on oil pairs, this indicator focuses on giving quick scalping signals with built-in money management in form of Take profit and stop-loss colored lines that come with each arrow signal, the indicator also has its built in Stats panel that gives signal accuracy % alongside useful info. HOW TO USE : Open trade according to arrow direction, after that use the TP and SL lines above and below the arrow and drag
FREE
Features List 1:
FVG->iFVG Order Block High Transaction Line (Personal strategy) Premium Discount 50% and 61% Previous day high low Previous week high low Candle end countdown Feature List 2 : (Implemented based on feedback from community groups) trend identification Hide FVG, Order Block, Large Transaction line below 50% equilibrium. Hide all/Individual texts/features FUTURE Feature List (Will be implemented only if at least 5 people request for it.)
Asia, London, NY lq zones (Implemented) Def
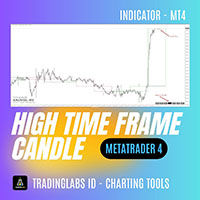
HTF Candle Plus Timer Upgrade your trading experience with HTF Candle Plus Timer, a smart indicator that displays higher timeframe candles directly on your current chart. It allows you to stay aligned with the bigger market picture while focusing on your preferred trading timeframe. Key Features: Higher Timeframe Candles
Plot custom higher timeframe (HTF) candles such as H1, H4, D1, W1, or MN directly on lower timeframe charts for a clearer market overview. Current Candle Timer
A live countdown

Trend Reversal pro is a histogram type indicator that give long and short signals, the indicator can be traded on its own with following entry rules . Buy Rule, histogram gives green bar. Sell Rule, histogram gives red bar. This indicator doesn't repaint or back paint, this indicator signals are not delayed. -------------------------------------------------------
FREE

Designed for precision-minded traders, GannVision fuses time-tested geometric forecasting with modern analytics to deliver unparalleled market insights. Harnessing the power of Gann angles, time cycles, and price harmonics, this tool helps traders identify high-probability entry and exit points, forecast trend reversals, and decode the hidden structure of market movements. Key Features: Gann Angle Mapping for trend strength and direction Time Cycle Forecasting to anticipate turning points

How SilverSentintel indicator empowers the silver trader: Regime-aware: differentiates trend vs range so you don’t trade breakouts in chop or fade strong trends blindly. Action gating: only prints arrows when confidence is high and false-probability is low. Risk framing: immediate ATR-based SL/TP suggestions for disciplined execution. Mean-reversion context: intraday VWAP tells you when price is stretched. Silver Sentinel indicator (MQL4, XAG-only, 30m focus) This indicator is engineered for

IQ6kPower — Market Intelligence Redefined IQ6kPower is not just another technical indicator.
It’s the distilled essence of adaptive trading logic, refined to operate at what we call an effective market IQ of 6000 . This isn’t a marketing flourish — it’s a statement of precision, adaptability, and insight at a scale few tools can match. Proven Performance:
IQ6kPower has been battle‑tested in live market conditions and rigorous simulated environments — including successfully navigating multiple
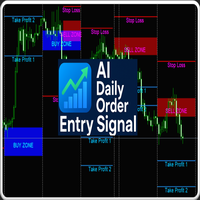
H1 indicator with daily BUY/SELL zones, Stop Loss, and two Take Profit levels. Includes HUD (spread, timeframe, countdown). No popups, no DLLs. AI Daily Order Entry Signal — H1 Only
This MT4 indicator draws clear daily BUY and SELL zones directly on your H1 chart. Each zone includes predefined Stop Loss, Take Profit 1, and Take Profit 2 levels, giving you a complete daily trade plan without extra setup.
How to Use - Attach to any H1 chart (works with forex, crypto, indices, metals). - Follow
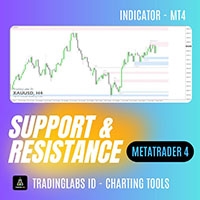
Classic Support & Resistance Tired of drawing support and resistance levels manually?
Now you can save time and trade with confidence using the Classic Support & Resistance Indicator. This tool automatically plots key support and resistance zones on your MT4 chart with high accuracy and clean visualization. Designed especially for traders who rely on Breakout – Retest Entry strategies and market structure analysis. Key Features: Auto Support & Resistance Zones
Automatically identifies and plots
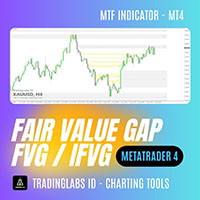
Fair Value Gap (FVG) & Inversion Fair Value Gap (iFVG) – TradingLabs ID In the ICT (Inner Circle Trader) concept, a Fair Value Gap (FVG), also known as Imbalance, occurs when price moves too quickly, leaving behind a gap without sufficient order balance. These areas are highly valuable for professional traders as they often signal potential retracement or entry zones with high probability. The FVG & iFVG Indicator is designed to automatically detect Fresh, Mitigated, and Inversion Fair Value Gap
MetaTraderマーケットが取引戦略とテクニカル指標を販売するための最適な場所である理由をご存じですか?宣伝もソフトウェア保護も必要なく、支払いのトラブルもないことです。これらはすべて、MetaTraderマーケットで提供されます。
取引の機会を逃しています。
- 無料取引アプリ
- 8千を超えるシグナルをコピー
- 金融ニュースで金融マーケットを探索
新規登録
ログイン