Anchored VWAP with Alerts
- インディケータ
- バージョン: 2.50
- アップデート済み: 13 12月 2025
- アクティベーション: 5
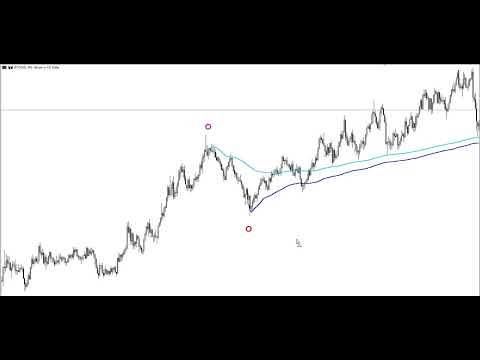
アンカードVWAP
アンカードVWAPは、従来のVWAPの変形版であり、指標の計算が取引セッションの開始時や固定された時間間隔ではなく、特定の時点(アンカー)から開始されます。これは、重要なニュース、トレンドの開始、サポートラインやレジスタンスラインの突破などのテクニカルイベントなど、特定のイベントを起点として、出来高と価格の関係を評価したいトレーダーに有用です。
この指標は、外国為替、株式、指数で機能します。
同一のチャートに複数のインスタンスを追加でき、各VWAPのアンカーをクリック一つで変更することが可能です。
価格がVWAPに到達した際にアラートを有効にします。
VWAPは「磁石的」な性質を持っています:ローソク足の上にマウスを置くとHIGHに、中央でTYPICALに、ローソク足の下でLOWに自動設定されます。