Anchored VWAP Pro

What is VWAP?

The Volume Weighted Average Price (VWAP) is a trading benchmark that reflects the average price of a security, weighted by volume, over a specific time period. It helps traders identify fair value and is used widely in intraday trading to assess price action relative to institutional trading levels.

Key Features of Anchored VWAP PRO

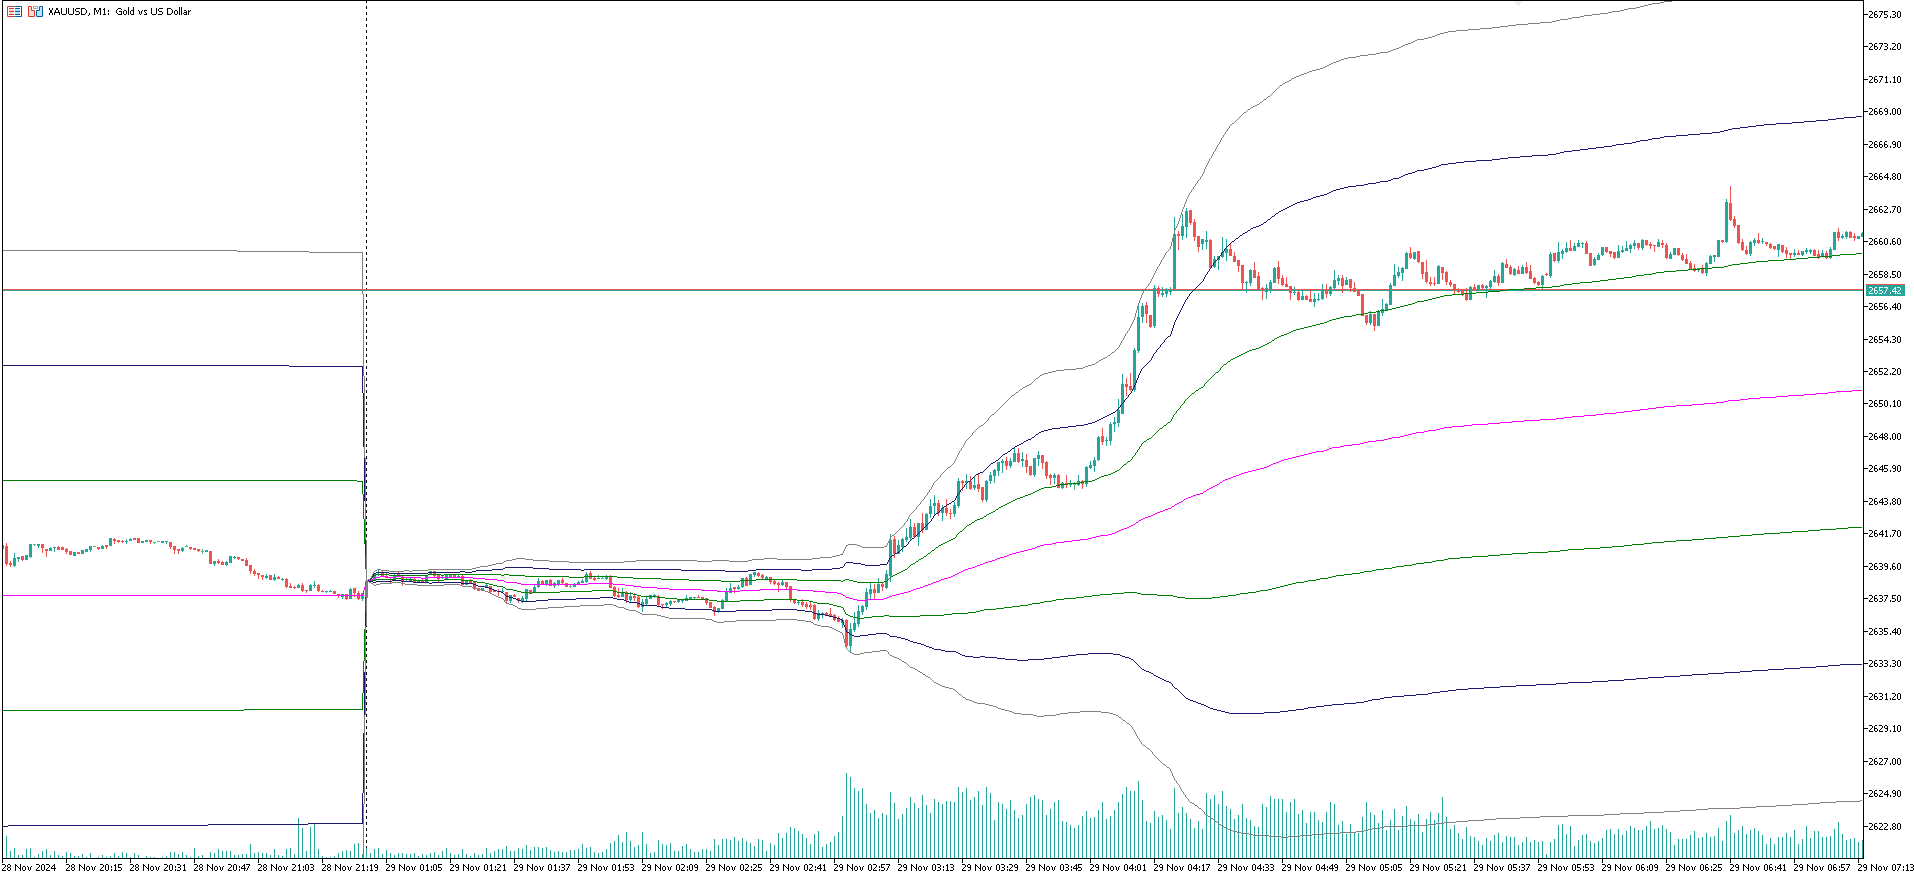
  1. Anchored Calculation:

    • Unlike traditional VWAP that resets daily, your indicator allows users to anchor VWAP to specific time frames or key points (e.g., news events, session starts).
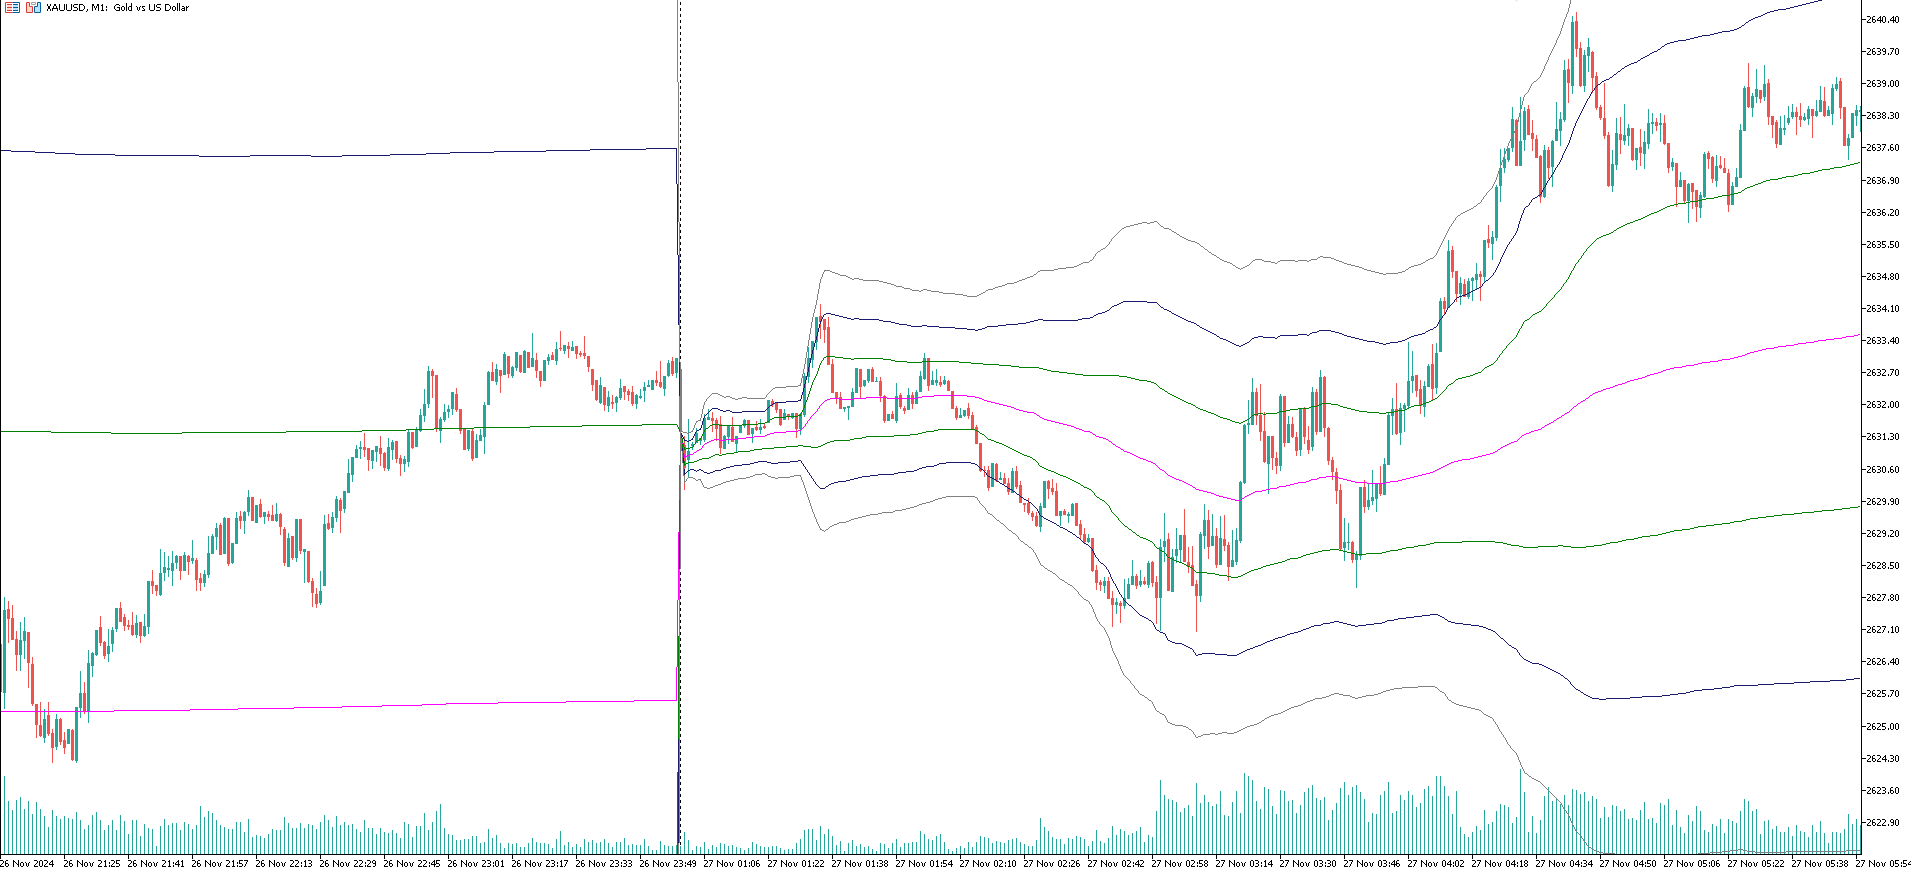
  2. VWAP Bands:

    • Adds dynamic bands around VWAP using standard deviation to reflect price volatility. These bands can help identify overbought/oversold conditions and potential reversal zones.
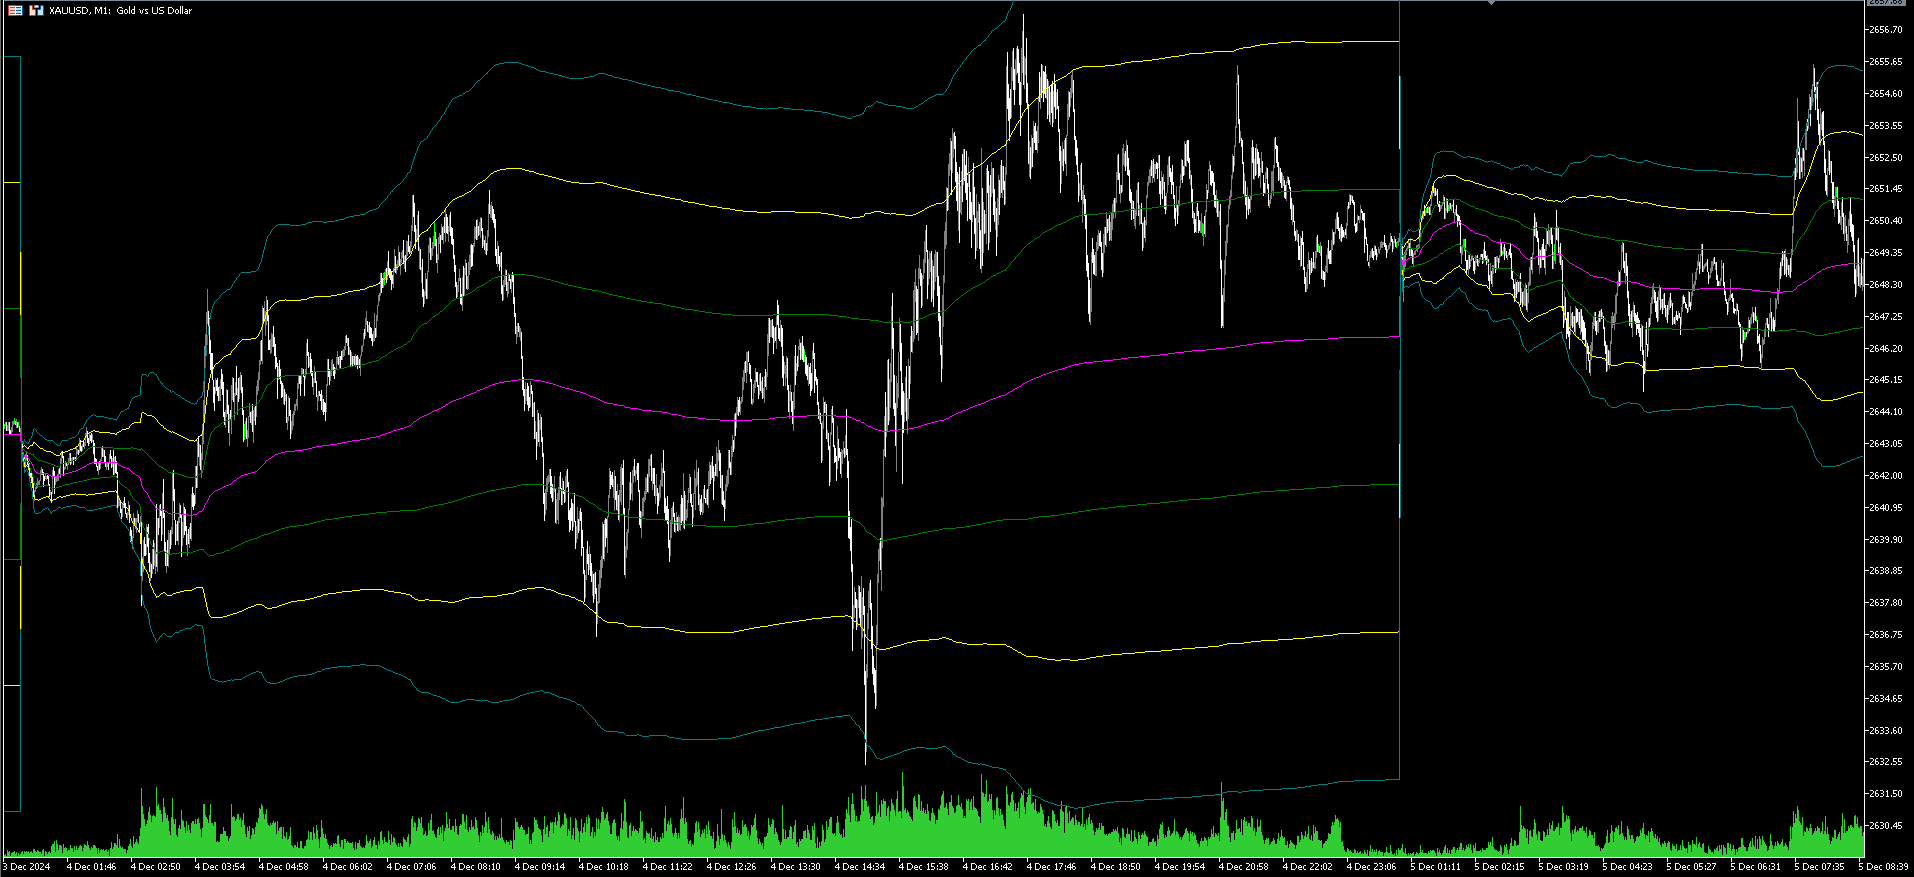
  3. Multi-Level Standard Deviation Bands:

    • The bands at ±1, ±2, and ±3 standard deviations provide insights into price extremes and strength of price moves.
  4. Customizable Visuals:

    • Users can personalize colors for VWAP and each band to suit their charting preferences.

How Anchored VWAP PRO Works

  • VWAP Calculation: VWAP is derived by dividing the cumulative total of (price × volume) by cumulative volume:

    VWAP = ∑ ( Price × Volume ) ∑ Volume \text{VWAP} = \frac{\sum{(\text{Price} \times \text{Volume})}}{\sum{\text{Volume}}} VWAP=Volume(Price×Volume)
  • Bands: Bands are calculated using standard deviation:

    Upper Band = VWAP + n × StdDev \text{Upper Band} = \text{VWAP} + n \times \text{StdDev} Upper Band=VWAP+n×StdDev Lower Band = VWAP − n × StdDev \text{Lower Band} = \text{VWAP} - n \times \text{StdDev} Lower Band=VWAPn×StdDev

    Where n n n is 1, 2, or 3 for different levels.

Advantages for Traders

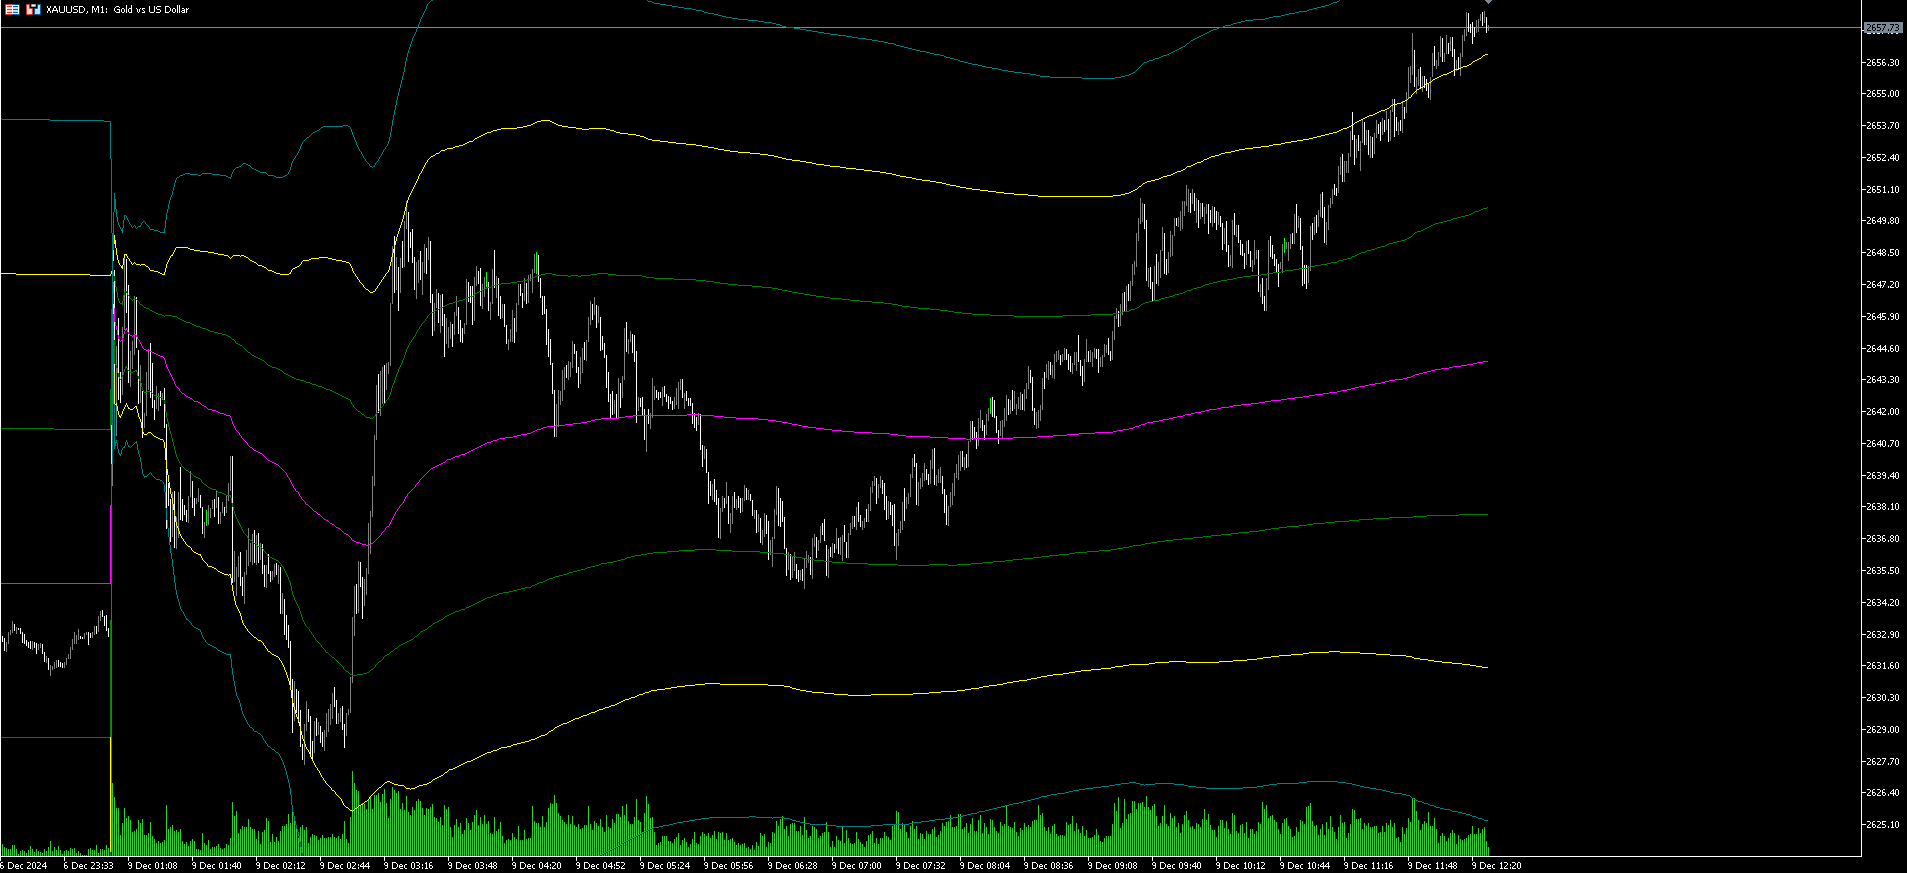
  1. Trend Identification:

    • VWAP serves as a dynamic support/resistance level. When prices are above VWAP, they are considered bullish; below VWAP, they are bearish.
  2. Mean Reversion Strategy:

    • Traders can use the bands to identify potential mean-reversion trades when price deviates significantly from VWAP.
  3. Institutional Relevance:

    • Institutions often use VWAP as a benchmark for trade execution. Understanding price in relation to VWAP can provide a competitive edge.
  4. Custom Anchoring:

    • The ability to anchor VWAP to key points allows traders to analyze price action around significant events or time periods.

Potential Use Cases

  1. Intraday Trading:

    • Ideal for scalpers and day traders to gauge intraday price levels and volatility.
  2. Swing Trading:

    • Swing traders can anchor VWAP to weekly or monthly highs/lows to monitor price trends over time.
  3. Breakout Strategies:

    • Use the VWAP bands to identify breakout points and target zones.

おすすめのプロダクト
The Market Structures Pro indicator finds and displays 5 (five) patterns of the Smart Money Concepts (SMC) system on the chart, namely: Break Of Structures (BoS)       Change of character (CHoCH) Equal Highs & Lows Premium, Equilibrium and Discount zones with Fibo grid High-high, Low-low, High-low and Low-high extremes Patterns are displayed for two modes - Swing and Internal and are easily distinguished by color on the chart. Internal mode features higher contrast colors, finer lines, and smal
The   DailyWeeklyMarkers   indicator helps traders visualize trading weeks by clearly marking the start of each day and week on the chart. It draws vertical separator lines for each day (including weekends if enabled) and highlights the beginning of new trading weeks with double lines for better clarity. This makes it easier to analyze price action within daily and weekly contexts. Who Is This Indicator For? Swing Traders   – Helps identify weekly opening gaps and key levels. Day Traders   – Vis
FREE
O Indicador identifica relação do Índice com a soma dos principais ativos, funciona para qualquer mercado do mund o, possui um oscilador WPR com a soma dos principais ativos escolhidos, indicando a antecipação do movimento em relação ao Índice. Características WPR com a soma dos papéis escolhidos - branco WPR do papel atual - vermelho Canal de Tendência O indicador pode indicar movimento de entradas, sendo: cruzamento das linhas cruzamento da linha Multi Symbols no -50 cruzamento entre os canai
FREE
Quantum Crypto PRO リアルなクジラデータを活用したマルチコイン AI トレーディング ローンチ価格。 購入 10 件ごとに価格が 200 ドル上昇します。 ライブシグナル: [ シグナルリンク ] 重要! 購入後、プライベートメッセージをお送りください。 whalehunt プラットフォームの 45 コイン分析 1 ヶ月無料プレミアムサブスクリプション(任意)とアドバイザーの設定手順をお届けします。ご質問があればお気軽にどうぞ。   重要! アドバイザーは取引所から得られたREAL-Timeデータを使用しているため、完全なバックテストは不可能です。有効性の唯一の真の確認は、Live Signal、アドバイザーが取引する戦略の取引結果です。アドバイザーの平均収益は月間約20〜25%で、標準的なリスクが推奨され、Live Signalで設定されています トレーダーの皆さん、こんにちは。   ほとんどのクリプト EA は標準的なテクニカル指標に依存しています。 Quantum Crypto PRO は 独自の分析プラットフォーム に接続し、分散型取引所における実際のト
Win43 Scalper
Eadvisors Software Inc.
O novo s43 Scalper para Mini-Índice (WIN-IND) faz operações de curto prazo no timeframe 1min buscando pequenas variações do mercado, utiliza nova tecnologia de trade, os resultados no intraday são íncríveis, confira:      Após a instalação adicione no gráfico dos instrumentos win para visualizar os resultados no backteste. Recomendamos o timeframe de 1min.
Trend Battle Indicator Overview The Trend Battle Indicator is a professional technical analysis tool that reveals the battle between buyers (Bulls) and sellers (Bears) in the market through a comprehensive dashboard. Using an intuitive visual interface, the indicator offers a unique perspective on market power dynamics by analyzing the last twenty bars to provide precise insights into momentum and directional strength. Additionally, the panel provides automatic real-time updates for bars in for
ProxyFootprint — 概要 ProxyFootprint Advanced は、MetaTrader 5 向けのオーダーフロー可視化インジケーターで、異なる価格レベルにおける買い圧力と売り圧力を分析・表示します。 これは何か(そして何ではないか) 重要: これは本物の フットプリントチャート ではありません。 本物のフットプリントチャートには、各価格レベルでの実際の注文板データ(買い/売りボリューム)へのアクセスが必要であり、それは取引所や専門データプロバイダーから提供されます。 本インジケーターは、公開されているティックデータを利用し、フットプリントチャートを 模倣した視覚的な近似表現 を作成します。 動作の仕組み このインジケーターは、ティックごとの価格変動を分析して買い/売り圧力を推定します: 価格が上昇したティックは「買い圧力」として分類 価格が下落したティックは「売り圧力」として分類 各ローソク足内の複数の価格レベルで、デルタ(買い量 − 売り量)を計算・表示 主な機能 多層価格分析: 各ローソク足に最大8つのカスタマイズ可能な価格レベルでデルタを表示 ネットデル
Vwap Freeze
Ricardo Almeida Branco
5 (1)
The previous day's vwap is used by some traders as a support and resistance point, after all it is one of the ways to consider the fair price of that asset or that pair the day before. Possible defenses can occur in this region indicating a reversal, or triggering stops starting a new, more directional movement. It is a matter of analyzing how it will add to your operational. To avoid manually drawing the previous day's vwaps and saving time for your analysis, use the Vwap Freeze indicator, as
Detailed Description: The   Pivot Point Classic Indicator   is designed for traders who rely on classic pivot points and midpoints levels for their trading strategies. By automatically calculating and plotting these levels, the indicator provides a clear, visual representation of critical price areas where the market may reverse or break out. Key Features: Automatic Pivot Point Calculations : Automatically calculates pivot points, three support (S1, S2, S3) and resistance (R1, R2, R3) levels bas
FREE
アンカードVWAP アンカードVWAPは、従来のVWAPの変形版であり、指標の計算が取引セッションの開始時や固定された時間間隔ではなく、特定の時点(アンカー)から開始されます。これは、重要なニュース、トレンドの開始、サポートラインやレジスタンスラインの突破などのテクニカルイベントなど、特定のイベントを起点として、出来高と価格の関係を評価したいトレーダーに有用です。 この指標は、外国為替、株式、指数で機能します。 同一のチャートに複数のインスタンスを追加でき、各VWAPのアンカーをクリック一つで変更することが可能です。 価格がVWAPに到達した際にアラートを有効にします。 VWAPは「磁石的」な性質を持っています:ローソク足の上にマウスを置くとHIGHに、中央でTYPICALに、ローソク足の下でLOWに自動設定されます。
シンプルだが効果的。 反転インジケーター - それは何か? スーパートレンドのロジックと指数曲線技術を組み合わせたトレンドフォロー型オーバーレイインジケーターです。トレンドの方向を検知し、チャート上に動的なチャネルを描画し、トレンドが反転した際にリアルタイムでアラートを送信します。 仕組み ATRとスーパートレンド係数を用いて指数ベースラインを算出。価格がこのベースラインを上抜け/下抜けした時点でトレンド反転を確認。緑矢印は買いトレンド開始、赤矢印は売りトレンド開始を示す。 特徴: ATRベースの動的チャネル付き指数トレンドベースライン 緑/赤で色分けされたトレンドラインと塗りつぶしチャネル トレンド反転時の買い/売り矢印シグナル 内蔵アラート:ポップアップ、プッシュ通知、メール、サウンド 重複アラート防止(1バーあたり1アラート) 完全カスタマイズ可能:色、線幅、矢印サイズ、チャネル幅 遅延のないクリーンなチャートオーバーレイ 入力パラメータ: 指数係数、スーパートレンド係数、ATR期間、チャネル幅 オン/オフ切り替え:チャネル塗りつぶし、矢印、各アラートタイプ 全視覚
FREE
このインジケーターを使用すると、フィボナッチレベルのラベルを大きなフォントサイズで表示できます。 。 最大 25 のフィボナッチレベルをサポートします - フィボナッチを描画するとすぐに、入力パラメータとして追加したレベルが、選択した色とフォントの大きなフォント サイズで表示されます。 カスタマイズ可能なオプション: 1.フィボテキストフォント 2.フィボテキストサイズ 3.フィボテキストの色 3. 各レベルに説明を追加します 4. アンカーや度数などのその他のオプション このインジケーターを使用すると、フィボナッチレベルのラベルを大きなフォントサイズで表示できます。 。 最大 20 のフィボナッチレベルをサポートします - フィボナッチを描画するとすぐに、入力パラメータとして追加したレベルが、選択した色とフォントの大きなフォント サイズで表示されます。 カスタマイズ可能なオプション: 1.フィボテキストフォント 2.フィボテキストサイズ 3.フィボテキストの色 3. 各レベルに説明を追加します 4. アンカーや度数などのその他のオプション
The   Pivot Point indicator   automatically calculates and displays the pivot point line and support and resistance levels. Pivot can be calculated according to the Classic, Floor, Fibonacci, Woodie, Camarilla or DeMark formula. It is also possible to select the period for calculating the indicator. A trader can choose from daily, weekly, monthly, or user-defined periods. Types of pivots Classic Floor Fibonacci Woodie Camarilla DeMark Main features The indicator shows the current and historic
FREE
The   Visual Volatility Clustering   indicator clusters the market based on volatility. The indicator does not redraw and gives accurate data, does not use closing prices. Uses the opening prices or the highs or lows of the previous completed bar. Therefore, all information will be clear and unambiguous. The essence of the indicator is to divide the price market into certain areas according to a similar type of volatility. This can be done in any way. In this example, the indicator is configure
VWAP Fibo Bands RSJ is an indicator that traces the lines of the daily VWAP and from it creates bands using Fibonacci proportions. This spectacular indicator creates 10 band levels through the selected VWAP period using Fibonacci ratios. It is fantastic how the prices respect each level of the bands, where it is possible to realize that almost every time the price closes above / below a level of the bands he will seek the next one. If close above will seek to reach the level above and if close
FREE
Zone vwap auto band
Anizio Donizete Dias De Moraes
It is an indicator used to identify support and resistance points from the daily VWAP and you can use it to check the best entry and exit points. The calculated value of the channel distance can be calculated in several ways: - Manual   Defining the value to be projected to calculate the distance of the channels. - Automatic   Select the timeframe to be used.   Regardless of the graphic time that is on the screen, if the parameter is changed to      H1(One hour candles), the system will calc
Timezone display
Muhamad Syafiq Bin Khairuddin
English: Institutional Timezone Sync & Subwindow Timeline Overview The MT5 timezone mismatch is a classic data-alignment headache for algorithmic and manual traders alike. This professional-grade indicator bridges the gap between broker server time and your local system time. Engineered specifically to have a near-zero CPU footprint, it is the perfect visual companion for quantitative traders running external machine learning models or Python bridges who cannot afford UI lag or execution slippa
FREE
Auto Fib Retracements
Ross Adam Langlands Nelson
4.2 (5)
Automatic Fibonacci Retracement Line Indicator. This indicator takes the current trend and if possible draws Fibonacci retracement lines from the swing until the current price. The Fibonacci levels used are: 0%, 23.6%, 38.2%, 50%, 61.8%, 76.4%, 100%. This indicator works for all charts over all timeframes. The Fibonacci levels are also recorded in buffers for use by other trading bots. Any comments, concerns or additional feature requirements are welcome and will be addressed promptly. 
FREE
This Indicator draws Fibonacci Extension levels in two different ways. You can select whether to draw Fibonacci Extension levels based on your favourite ZigZag settings or you can let the indicator to draw Fibonacci Extension  level based on given number of Bars or Candles.  You can also set Mobile and Email notification for your favourite Extension  levels individually. With this indicator you will not have to feel lonely as the it can generate Voice alerts, which will keep you focused on your
Sequential Lock Fibo (v19) For sensitivity:Default is level is 80/20 make 65/35,65/40 Sequential Lock Fibo is a precision trend-trading tool designed for the MetaTrader 5 platform. It solves the two most common problems in Fibonacci trading: "repainting" (signals that disappear) and "freezing" (missing re-entry opportunities in long trends). This indicator combines a strict Trend Filter , a mechanical Setup Identifier , and a unique Sequential Logic engine to provide high-probability, non-repain
Price Retest MT5
Suvashish Halder
4.83 (6)
Introducing our exciting new Price Retest indicator! Get instant alerts when the price retests, giving you a powerful edge in your trading strategy. Remember to do your own analysis before making any moves in the market. MT4 Version -  https://www.mql5.com/en/market/product/118031 Join To Learn Market Depth -   https://www.mql5.com/en/channels/suvashishfx Here’s a detailed explanation of how the Price Retest indicator works, its components, and how you can incorporate it into your trading strat
FREE
NeoBull Breakout Indicator - プロフェッショナルなブレイクアウト取引を簡単に NeoBull Breakout Indicatorは、ブレイクアウトトレーダー専用に設計されたMetaTrader 5の強力なテクニカル指標です。実証済みのHighest High/Lowest Lowレベルと200SMAトレンドフィルターを組み合わせて、高確率のブレイクアウトセットアップを特定します。 主な機能: * ステップ式Highest High(20)ライン - 過去20期間の最高値を明確な水平線として表示(TradingViewのように) * ステップ式Lowest Low(20)ライン - 過去20期間の最安値を明確な水平線として表示 * 200SMAトレンドフィルター - より正確なシグナルのためにメイントレンドを識別 * インテリジェントなブレイクアウトアラート: HHブレイクアウトアラート :価格がHighest Highを上抜け、かつ200SMAより上にある場合に発動(上昇トレンド) LLブレイクダウンアラート :価格がLowest Lowを下抜け、かつ2
Supertrend Pro MTF Dashboard: Trade with Confidence Stop missing high-probability trades. The Supertrend Pro MTF Dashboard is the professional-grade tool designed to cut through market noise and instantly identify powerful, aligned trends across 8 timeframes (M1 to W1). Built for serious traders, this indicator delivers no-repaint signals and a clean, actionable dashboard, making multi-timeframe confirmation effortless. KEY FEATURES FOR PROFESSIONAL TRADERS 1. Multi-Timeframe Trend Alignment
Special offer : ALL TOOLS , just $35 each! New tools   will be   $30   for the   first week   or the   first 3 purchases !  Trading Tools Channel on MQL5 : Join my MQL5 channel to update the latest news from me Zero Lag MA Trend Levels MT5 with Scanner インジケーターは、ゼロ遅延移動平均(ZLMA)と標準的な指数移動平均(EMA)を組み合わせて、トレーダーに市場のモメンタムと主要な価格レベルの全体像を提供します。さらに、スキャナーとアラート機能により、トレーダーは複数の通貨ペアやタイムフレームでシグナルを簡単に追跡でき、トレードチャンスを見つける能力が向上します。 See more MT4 version at:     Zero Lag MA Trend Levels MT4 with Scanner See more product
EMAs Mago Trader
Flavio Javier Jarabeck
5 (2)
For those traders and students who follow the famous brazilian trader Igor Rodrigues (Mago Trader) here it is his famous 2 EMAs - based on Phi ratios - and packed with a twist: a Filling Area , to easily and visually spot the corresponding trend on the chart. You can turn On and Off this filling. If you don't know Igor Rodrigues and you are a brazilian trader and student, just google for him... Very simple and useful indicator. If you are looking also for the MACD -based indicator of this trade
FREE
Rush Point Histogram Continuity force indicator. Operation: After a breach of support or resistance of an asset, the trader can understand by reading the histogram if such a move tends to continue, thus filtering false breaks or short breaks without trend formation. Through a simple, level-based reading, the trader can make a decision based on the histogram, where: Below 21: No trend formation 21 to 34: Weak trend 34 to 55: Strong Trend 55 to 89: Strong tendency Suggested Reading: Observed disru
Rejection Zones
Paulo Henrique Faquineli Garcia
Este poderoso indicador analisa o gráfico e mostra zonas de Rejeição de Preços! Isto é, locais onde o preço foi, mas não foi aceito pelo mercado! A visualização desta zona de Rejeição, facilita o entendimento do trader na tomada de decisões de onde operar e como operar! O indicador é composto por 4 linhas, sendo classificadas em 2 grupos: Linhas Vermelha e Amarela: Denotam os extremos onde o preço conseguiu chegar, mas não foi aceito! Linhas Laranja e Azul: A partir delas, denotam o Início da z
FREE
範囲の枯渇は、価格が現在の期間の予想される範囲を満たすか超えると発生します。これらのレベルでは、価格は期間の初期に比べて勢いを失い始めるため、新しいポジションをとっていないことを確認するのに良いポイントです. このインジケーターは、チャート上でこれが発生する可能性が高い場所を示し、日次、週次、月次の期間のレベルを示します。 価格がこれらの枯渇レベルを超えている場合は、動きの背後にある勢いが非常に強く、より高い時間枠レベルに向かっている可能性が高いことを示しています. インジケーターは、好みに応じて、Average True Range (ATR) または Average Range (ADR) 計算を使用できます。デフォルトでは、外国為替チャートでよりうまく機能することがわかっているため、ATR を使用しますが、ADR は株式ベースのインデックスとシンボルで優位に立っています。 インジケーターには、以下で説明するいくつかの描画モードがあり、ニーズに合わせて調整できます。 設定 計算モード レベルの計算には、AverageTrueRange (ATR) または AverageDaily
This z-score indicator shows the correct z-score of an asset, as it uses the normalized price data for calculation, which is the only correct way. Z-score is only applicable for normal distributed data, therefore not the actual price is considered, but the normalised returns, which were assumed to follow a normal distribution. Returns are mean reverting and assumed to follow a normal distribution, therefore z-score calculation of returns is more reliable than z-score on price, as price is NOT m
The indicator highlights the points that a professional trader sees in ordinary indicators. VisualVol visually displays different volatility indicators on a single scale and a common align. Highlights the excess of volume indicators in color. At the same time, Tick and Real Volume, Actual range, ATR, candle size and return (open-close difference) can be displayed. Thanks to VisualVol, you will see the market periods and the right time for different trading operations. This version is intended f
FREE
このプロダクトを購入した人は以下も購入しています
ARIPoint is a powerful trading companion designed to generate high-probability entry signals with dynamic TP/SL/DP levels based on volatility. Built-in performance tracking shows win/loss stats, PP1/PP2 hits, and success rates all updated live. Key Features: Buy/Sell signals with adaptive volatility bands Real-time TP/SL/DP levels based on ATR Built-in MA Filter with optional ATR/StdDev volatility Performance stats panel (Success, Profit/Loss, PP1/PP2) Alerts via popup, sound, push, or email Cu
SuperScalp Pro
Van Minh Nguyen
4.57 (21)
SuperScalp Pro – 高度なマルチフィルタースキャルピングインジケーターシステム SuperScalp Pro は、クラシックな Supertrend と複数のインテリジェント確認フィルターを組み合わせた高度なスキャルピングインジケーターです。M1 から H4 まで複数の時間足で効率的に動作し、XAUUSD、BTCUSD、主要 Forex 通貨ペア向けに最適化されています。 このインジケーターは明確な Buy / Sell シグナルを提供し、ATR に基づいてエントリー価格、Stop Loss、Take Profit を自動計算します。Fibonacci Take Profit 機能により、重要な価格帯で早期決済し、到達時に通知を送信します。 初期設定では Fibonacci Take Profit が有効化されており、より安定した取引体験を重視しています。チャートに適用するだけですぐ利用可能です。上級者向けに、すべてのパラメータは自由にカスタマイズできます。 EMA、RSI、ADX、Volume、VWAP、Bollinger Bands、MACD Divergence な
このインジケーターを購入された方には、以下の特典を 無料 で提供しています: 各トレードを自動で管理し、ストップロスとテイクプロフィットを設定し、戦略ルールに基づいてポジションを決済する補助ツール 「Bomber Utility」 様々な銘柄に合わせたインジケーターの設定ファイル(セットファイル) 「最小リスク」、「バランスリスク」、「待機戦略」 の3つのモードで使用できる Bomber Utility 用の設定ファイル このトレーディング戦略をすぐに導入・設定・開始できる ステップバイステップのビデオマニュアル ご注意: 上記の特典を受け取るには、MQL5のプライベートメッセージシステムを通じて販売者にご連絡ください。 オリジナルのカスタムインジケーター 「Divergence Bomber(ダイバージェンス・ボンバー)」 をご紹介します。これは、MACDのダイバージェンス(乖離)戦略に基づいた 「オールインワン」型のトレーディングシステム です。 このテクニカルインジケーターの主な目的は、価格とMACDインジケーターの間に発生するダイバージェンスを検出 し、将来の価格の動きを示す
Entry In The Zone and SMC Multi Timeframe is a real-time 2-in-1 market analysis tool that combines market structure analysis and a No Repaint BUY / SELL signal system into a single indicator, built on Smart Money Concepts (SMC) — a widely adopted framework used by professional traders to understand market structure. This indicator helps you see the market more clearly, make decisions based on structure rather than guesswork, and focus on high-probability zones where price is more likely to react
Quantum TrendPulse を ご紹介します。これは、   SuperTrend   、   RSI   、および Stochastic のパワーを 1 つの包括的なインジケーターに組み合わせて、取引の可能性を最大限に引き出す究極の取引ツールです。精度と効率を求めるトレーダー向けに設計されたこのインジケーターは、市場のトレンド、勢いの変化、最適なエントリー ポイントとエグジット ポイントを自信を持って特定するのに役立ちます。 主な特徴: SuperTrend 統合: 現在の市場動向に簡単に追従し、収益性の波に乗ることができます。 RSI精度: 買われすぎと売られすぎのレベルを検出し、市場の反転のタイミングに最適で、SuperTrendのフィルターとして使用されます。 確率的精度: 確率的振動を活用して、変動の激しい市場で隠れたチャンスを見つけます。SuperTrend のフィルターとして使用されます。 マルチタイムフレーム分析:   M5 から H1 または H4 まで、さまざまなタイムフレームで市場を常に把握します。 カスタマイズ可能なアラート: カスタム取引条件が満たされ
このインジケーターを購入すると、プロ仕様のトレードマネージャーを無料で差し上げます。 まず第一に、このトレーディングシステムがノンリペイント、ノンリドロー、ノンラグのインジケーターであることを強調する価値がある。これにより、手動取引とロボット取引の両方に理想的なものになっています。 オンラインコース、マニュアル、プリセットのダウンロード。 「スマートトレンドトレーディングシステム MT5」は、新規および経験豊富なトレーダー向けにカスタマイズされた包括的なトレーディングソリューションです。10以上のプレミアムインジケーターを組み合わせ、7つ以上の堅実なトレーディング戦略を備えており、多様な市場状況に対応する多目的な選択肢となっています。 トレンドフォロー戦略:トレンドを効果的に乗り越えるための正確なエントリーとストップロス管理を提供します。 リバーサル戦略:潜在的なトレンドの反転を特定し、トレーダーがレンジ相場を活用できるようにします。 スキャルピング戦略:高速で正確なデイトレードおよび短期取引のために設計されています。 安定性:すべてのインジケーターはノンリペイント、ノンリドロー、ノ
Power Candles – あらゆる市場に対応した強度ベースのエントリーシグナル Power Candles は、Stein Investments が長年培ってきた強度分析を価格チャート上に直接反映します。価格だけに反応するのではなく、各ローソク足は実際の市場の強さに基づいて色分けされ、モメンタムの蓄積、強度の加速、明確なトレンド転換を瞬時に把握できます。 すべての市場に共通する単一ロジック Power Candles は すべての取引シンボル で自動的に動作します。現在のシンボルが Forex か非 Forex 市場かを自動判別し、内部で適切な強度モデルを適用します。 Forex および Gold :FX Power のデルタ値を使用(絶対値レンジ最大 100) 指数、暗号資産、CFD :IX Power の強度値を使用(絶対値レンジ最大 50) 必要な強度計算は Power Candles に直接組み込まれています。ローソク足のカラーリングやシグナルロジックに、追加のインジケーターは不要です。 価格ノイズではなく「強度状態」 各ローソク足は、以下の 9 つの明確に定義された強
Azimuth Pro
Ottaviano De Cicco
5 (7)
Azimuth Pro V2:MT5向けシンセティック・フラクタル構造分析と確認済みエントリー 概要 Azimuth Pro は Merkava Labs によるマルチレベルスイング構造インジケーターです。4つのネストされたスイングレイヤー、スイングアンカーVWAP、ABCパターン検出、3タイムフレーム構造フィルタリング、そして確定バーでの確認済みエントリー — 1つのチャートで、ミクロスイングからマクロサイクルまでを網羅するワークフロー。 これはブラインドシグナル製品ではありません。ロケーション、コンテキスト、タイミングを重視するトレーダーのための構造ファーストワークフローです。 V2発売記念オファー — Azimuth Pro V2をUSD 399で(次の100本)。最終価格:USD 499。 1. V2での変更点 シンセティック・マルチタイムフレームエンジン 上位タイムフレーム分析をMeridian Proと同じ独自のシンセティックアーキテクチャで一から再構築。よりクリーンなHTFコンテキスト、安定したライブ動作、従来のMTF同期問題なし。シンセティックエンジンは 固定比率タ
Gann Made Easy   は、ミスター・ギャンの理論を使用した取引の最良の原則に基づいた、プロフェッショナルで使いやすい外国為替取引システムです。 W・D・ガン。このインジケーターは、ストップロスとテイクプロフィットレベルを含む正確な買いと売りのシグナルを提供します。 PUSH通知を利用して外出先でも取引可能です。 ご購入後、取引方法の説明と優れた追加インジケーターを無料で入手するには、私にご連絡ください! おそらく、ギャンの取引手法についてはすでに何度も聞いたことがあるでしょう。通常、ギャンの理論は初心者のトレーダーだけでなく、すでにある程度の取引経験がある人にとっても非常に複雑なものです。なぜなら、ギャンの取引手法は理論的にはそれほど簡単に適用できるものではないからです。私はその知識を磨き、最良の原則を私の外国為替インジケーターに組み込むために数年を費やしました。 このインジケーターは非常に簡単に適用できます。必要なのは、それをチャートに添付し、簡単な取引推奨事項に従うだけです。このインジケーターは常に市場分析の仕事を行い、取引の機会を探します。適切なエントリーポイントを検
FX Trend NG:次世代マルチマーケット・トレンドインテリジェンス 概要 FX Trend NG は、複数の時間足に対応したプロフェッショナル向けトレンド分析およびマーケット監視ツールです。 市場全体の構造を数秒で把握することができます。 複数のチャートを切り替える必要はありません。どの銘柄がトレンド中なのか、どこでモメンタムが弱まっているのか、そしてどの時間足で強い整合性があるのかを瞬時に確認できます。 ローンチ特別オファー – FX Trend NG を $30(6ヶ月) または $80 永久ライセンス でご利用いただけます。 すでに Stein Investments のユーザーですか? -> メッセージを送信 して、プライベートグループへアクセスしてください。 セットアップや詳細情報が必要ですか? -> Stein Investments 公式ページ をご覧ください。 1. FX Trend NG が他と異なる理由 3ステート・トレンドロジック ― Buy と Sell だけではない • 多くのインジケーターは Buy または Sell の2状態のみを表示します。
SignalTech MT5 is a trading system for EURUSD, USDCHF, USDJPY, AUDUSD, NZDUSD, EURJPY, AUDJPY, NZDJPY, CADJPY H2 and H3 Timeframe.  It can generate signals with Buy/Sell Arrows and Pop-Up/Sound Alerts. Each signal has clear Entry and Stop Loss levels, which should be automatically flagged on the chart, as well as potential Targets 1, 2, and 3. The Entry and TP levels are fixed after the trade is taken. The exit level is dynamic. If there are signs of a potential short-term trend reversal, the
優れたテクニカルインジケーター「Grabber」をご紹介します。これは、すぐに使える「オールインワン」トレーディング戦略として機能します。 ひとつのコードに、市場のテクニカル分析ツール、取引シグナル(矢印)、アラート機能、プッシュ通知が強力に統合されています。 このインジケーターを購入された方には、以下の特典を無料で提供します: Grabberユーティリティ:オープンポジションを自動で管理するツール ステップバイステップのビデオマニュアル:インジケーターのインストール、設定、取引方法を解説 カスタムセットファイル:インジケーターをすばやく自動設定し、最大限の成果を出すための設定ファイル 他の戦略はもう忘れてください!Grabberだけが、あなたを新たなトレードの高みへと導いてくれるのです。 Grabber戦略の主な特徴: 推奨タイムフレーム:M5〜H4 対応通貨ペア・資産:どれでも使用可能ですが、私が実際に検証した以下を推奨します(GBPUSD、GBPCAD、GBPCHF、AUDCAD、AUDUSD、AUDSGD、AUDCHF、NZDUSD、NZDCAD、EURCAD、EURUSD、E
マーケットメーカーのためのツール。 Meravith は次の機能を提供します: すべての時間足を分析し、現在有効なトレンドを表示します。 強気と弱気の出来高が等しくなる流動性ゾーン(出来高均衡)を強調表示します。 異なる時間足のすべての流動性レベルをチャート上に直接表示します。 テキスト形式の市場分析を生成し、参考情報として表示します。 現在のトレンドに基づいて目標値、サポートレベル、ストップロスを計算します。 取引のリスクリワード比を算出します。 口座残高に基づいてポジションサイズを計算し、潜在的な利益を推定します。 また、市場に大きな変化があった場合には警告を表示します。 インジケーターの主要ライン: 強気/弱気の出来高エグゾーストライン ― 目標値として機能します。 市場のトレンドを示すライン。市場が強気か弱気かによって色が変わり、トレンドのサポートとして機能します。主にその色が市場センチメントを示します。 出来高均衡ライン(Eq)。Eq(Volume Equilibrium)ラインはシステムの中核です。これは買い手と売り手の出来高のバランスポイントを表します。市場の流動性を示し
トレンド スクリーナー インジケーターでトレンド取引の力を解き放ちます。ファジー ロジックと複数通貨システムを活用した究極のトレンド取引ソリューションです。 ファジー ロジックを活用した革新的なトレンド インジケーターである Trend Screener を使用して、トレンド取引を向上させます。 これは、13 を超えるプレミアム ツールと機能、および 3 つの取引戦略を組み合わせた強力なトレンド追跡インジケーターであり、Metatrader をトレンド アナライザーにする多用途の選択肢となります。 期間限定オファー : トレンド スクリーナー インジケーターは、わずか 100 ドルで生涯ご利用いただけます。 (元の価格 50$ ) (オファー延長) Trend Screener の 100% 非再描画精度の揺るぎない精度を体験して、取引の決定が過去の価格変動の影響を受けないようにしてください。 マルチタイムフレームおよびマルチ通貨機能の多用途性を解放し、比類のない自信を持って外国為替、商品、暗号通貨、インデックスの世界を取引できるようにします。 Trend Screener の包括的な
まず正直に言いましょう。 どんなインジケーターも、それ単体であなたを利益化させることはできません。もしそう言う人がいるなら、それは夢を売っているだけです。完璧な売買シグナル(矢印)を表示するインジケーターは、いくらでも“完璧に見せる”ことができます。正しい過去の区間を拡大して、勝ちトレードだけを切り取ればいいだけです。私たちはそれをしません。 SMC Intraday Formula はツールです。 市場構造を読み取り、最も高い確率の価格ゾーンを特定し、今この瞬間のスマートマネーの痕跡をシンプルな言葉で正確に示します。最終判断はあなたが行います。トレードを実行するのもあなたです。しかし今は「希望」ではなく「精度」でエントリーできます。 私たちはこのインジケーターを、ゴールド(XAUUSD)および主要FX通貨ペアで約3年間、日々のスキャルピングに使用してきました。M1、M5、M15、M30の主要ツールです。これは未来を予測しようとするのではなく、今まさに形成されている高確率セットアップを示し、その理由を説明します。 他のすべてのインジケーターと何が違うのか? ほとんどのトレーディングイ
あなたのシンボルでどの戦略が実際に機能するか確認しましょう - リアルマネーをリスクにさらす前に。 Power Barは、あらゆるシンボルとあらゆるタイムフレームで 極端な価格バー を検出し、3つの異なるトレード戦略を即座にバックテストします。勝率、プロフィットファクター、損益を並べて比較できます。すべてが1つのインタラクティブなパネルに集約されています。 推測なし。カーブフィッティングなし。データだけです。 Power Barが特別な理由 ほとんどのインジケーターはシグナルを出すだけで、それが機能するかどうかは推測に任されます。Power Barはさらに先を行きます - すべてのシグナルを 3つの戦略 に対してテストし、統計を表示します。FlipFlop、Momentum、Reversalをワンクリックで切り替え、数値が即座に変化するのを確認できます。 FlipFlop - 常にポジションを保有。シグナルでエントリーし、反対シグナルでイグジット。当社のリサーチでは、US30、US500、DAXなどのトレンドのあるインデックスで最も効果的です。 Momentum - シグナルの方向に
まず第一に、この取引インジケーターは再描画されず、再描画されず、遅延しないことを強調する価値があります。これにより、手動取引とロボット取引の両方に理想的なものになります。 ユーザーマニュアル:設定、入力、戦略。 アトミックアナリストは、価格の強さとモメンタムを利用して市場でより良いエッジを見つけるためのPA価格アクションインジケーターです。ノイズや誤ったシグナルを除去し、取引ポテンシャルを高めるための高度なフィルターを備えています。複雑なインジケーターの複数のレイヤーを使用して、アトミックアナリストはチャートをスキャンし、複雑な数学的計算をシンプルなシグナルと色に変換します。これにより、どのような初心者トレーダーでも理解して使用し、一貫した取引の決定を行うことができます。 「アトミックアナリスト」は、新規および経験豊富なトレーダー向けにカスタマイズされた包括的な取引ソリューションです。プレミアムインジケーターとトップノッチの機能を1つの取引戦略に組み合わせ、すべてのタイプのトレーダーにとって汎用性のある選択肢にします。 デイリートレーディングとスキャルピング戦略:高速で正確なデイ
BTMM State Engine Pro is a MetaTrader 5 indicator for traders who use the Beat The Market Maker approach: Asian session context, kill zone timing, level progression, peak formation detection, and a multi-pair scanner from a single chart. It combines cycle state logic with a built-in scanner dashboard so you do not need the same tool on many charts at once. What it does Draws the Asian session range; session times can follow broker server offset or be set in inputs. Tracks level progression (L
これはMT5のインジケーターで、再描画なしで取引に参入するための正確なシグナルを提供します。 外国為替、暗号通貨、金属、株式、インデックスなど、あらゆる金融資産に適用できます。かなり正確な見積もりを提供し、取引を開始して終了するのに最適な時期を教えてくれます。1つのシグナルを処理しただけでインジケーターの元が取れた例の 動画 (6:22)をご覧ください。Entry PointsPro インジケーターの助けを借りたほとんどのトレーダーの最初の1週間の結果が改善しています。 Telegramグループ に登録してください。Entry Points Proインジケーターのメリットは次の通りです。 再描画のないエントリーシグナル 再描画されるインジケーターでは一度表示されたシグナルが削除されて大きな金銭的損失につながることがありますが、これと異なり、表示されて確認されたシグナルは消えることがありません。 エラーなしの取引開始 インジケーターアルゴリズムによって取引を開始する(資産を売買する)理想的な瞬間を見つけることができます。それを使用するすべてのトレーダーの成功率が向上します。 あら
ご紹介     Quantum Breakout PRO は 、ブレイクアウト ゾーンの取引方法を変革する画期的な MQL5 インジケーターです。 13年以上の取引経験を持つ経験豊富なトレーダーのチームによって開発されました。     クォンタム ブレイクアウト プロ   は、革新的でダイナミックなブレイクアウト ゾーン戦略により、あなたのトレーディングの旅を新たな高みに押し上げるように設計されています。 クォンタム ブレイクアウト インジケーターは、5 つの利益ターゲット ゾーンを備えたブレイクアウト ゾーン上のシグナル矢印と、ブレイクアウト ボックスに基づいたストップロスの提案を提供します。 初心者トレーダーにもプロのトレーダーにも適しています。 量子EAチャネル:       ここをクリック 重要!購入後、インストールマニュアルを受け取るためにプライベートメッセージを送ってください。 推奨事項: 時間枠: M15 通貨ペア: GBPJPY、EURJPY、USDJPY、NZDUSD、XAUUSD アカウントの種類: ECN、Raw、またはスプレッドが非常に低い R
FX Power: 通貨の強弱を分析して、より賢い取引を実現 概要 FX Power は主要通貨と金の実際の強弱をあらゆる市場状況で理解するための必須ツールです。強い通貨を買い、弱い通貨を売ることで、 FX Power は取引の意思決定を簡素化し、高い確率の取引機会を見出します。トレンドを追従する場合でも、極端なデルタ値を使用して反転を予測する場合でも、このツールはあなたの取引スタイルに完全に適応します。ただ取引するだけではなく、 FX Power で賢く取引をしましょう。 1. なぜ FX Power がトレーダーにとって非常に有益なのか 通貨と金のリアルタイム強弱分析 • FX Power は主要通貨と金の相対的な強弱を計算し、マーケットダイナミクスに関する明確な洞察を提供します。 • どの資産がリードしているか、または後れを取っているかを監視して、取引するペアを賢く選びましょう。 マルチタイムフレームの包括的なビュー • 短期、中期、長期のタイムフレームで通貨と金の強弱を追跡し、マーケットトレンドに基づいて取引戦略を調整できます。 • スキャルピングからスイングトレード
OmniSync Projection
Antonio-alin Teculescu
5 (1)
Chronos Fractal Engine is an innovative price projection indicator for MetaTrader 5, designed to transform your technical analysis by intelligently identifying and projecting historical price patterns. Built upon an advanced correlation algorithm and the fractal principles of the market, this powerful tool visualizes potential future price movements, giving you a unique edge in your trading decisions. What is Chronos Fractal Engine? At its core, the Chronos Fractal Engine employs a sophisticat
Bill Williams Advanced is designed for automatic chart analysis using Bill Williams' "Profitunity" system. The indicator analyzes four timeframes at once. Manual (Be sure to read before purchasing) Advantages 1. Analyzes the chart using Bill Williams' "Profitunity" system. Signals are displayed in a table in the corner of the screen and on the price chart. 2. Finds all known AO and AC signals, as well as zone signals. Equipped with a trend filter based on the Alligator. 3. Finds "Divergence Bar
Berma Bands
Muhammad Elbermawi
5 (8)
Berma Bands (BBs) インジケーターは、市場のトレンドを特定して活用したいトレーダーにとって貴重なツールです。価格と BBs の関係を分析することで、トレーダーは市場がトレンド段階にあるか、レンジ段階にあるかを判断できます。 詳細については、[ Berma Home Blog ] をご覧ください。 バーマ バンドは、上部バーマ バンド、中部バーマ バンド、下部バーマ バンドの 3 つの異なる線で構成されています。これらの線は価格の周りにプロットされ、全体的な傾向に対する価格の動きを視覚的に表します。これらのバンド間の距離から、ボラティリティや潜在的な傾向の反転についての洞察を得ることができます。 バーマ バンドの線がそれぞれ離れると、市場が横ばいまたはレンジ相場の期間に入っていることを示すことがよくあります。これは、明確な方向性の偏りがないことを示しています。トレーダーは、これらの期間中にトレンドを特定するのが難しいと感じる可能性があり、より明確なトレンドが出現するまで待つ場合があります。 バーマ バンドの線が 1 本の線に収束すると、強いトレンド環境の兆候となること
Crystal Heikin Ashi Signals - Professional Trend & Signal Detection Indicator Advanced Heikin Ashi Visualization with Intelligent Signal System for Manual & Automated Trading Final Price: $149 ---------> Price goes up $10 after every 10 sales . Limited slots available — act fast . Overview Crystal Heikin Ashi Signals is a professional-grade MetaTrader 5 indicator that combines pure Heikin Ashi candle visualization with an advanced momentum-shift detection system. Designed for both manual traders
Market Structure Order Block Dashboard MT5 は、市場構造と主要な価格反応ゾーンをチャート上で直接読み取りたいトレーダー向けに設計された MT5 インジケーターです。BOS、ChoCH、オーダーブロック、Fair Value Gap (FVG)、流動性、Kill Zones、Volume Profile、そして素早い分析のためのコンパクトなダッシュボードを組み合わせています。 本インジケーターは、市場構造、ICT、Smart Money の概念を意思決定の枠組みとして使用するトレーダーを対象としています。トレンド継続、反転の可能性、価格の不均衡、流動性ターゲット、注目ゾーンをより構造的に特定する助けとなります。 購入者向けの付属リソース 購入後、MQL5 のプライベートメッセージにてご依頼いただくと、完全な PDF ユーザーガイドとパラメータ設定のヒントを提供いたします。MQL5 のプライベートメッセージによる直接的な技術サポート。 バージョン 1.20 では 2 つの重要な追加機能があります: Pending BOS / Pending Cho
Auto Optimized Parabolic RSI: 高度な3Dモメンタムエンジン ほとんどのリテール向けインジケーターは、市場のボラティリティが変化した瞬間に破綻する静的な入力値に依存しているため、失敗に終わります。Auto Optimized Parabolic RSIは、自らの数学的優位性を継続的に再計算することで「インジケーターの陳腐化」問題を解決し、機関投資家レベルの定量的適応力をMT5ターミナルに直接もたらします。 最大の強み: カスタムインメモリ3D最適化 標準的な自動最適化ツールは、インジケーターの呼び出しで端末に過負荷をかけるため、頻繁にMT5プラットフォームをフリーズさせます。本ツールは、このボトルネックを完全に回避しています。RAMベースのカスタムネイティブ計算機を内蔵した内部エンジンは、チャートを読み込んだりタイムフレームを変更したりするたびに、超高速の3Dグリッド探索を実行します。RSI期間(頻度)、SARステップ(加速度)、SAR最大値(制限速度)を同時にスイープし、プラットフォームを遅延させることなく、数万通りものパラメーターの組み合わせを絶対的なミ
Meridian Pro
Ottaviano De Cicco
5 (1)
Meridian Pro:MT5用プロフェッショナル・マルチタイムフレーム・トレンドマトリックス 概要 Meridian Pro は Merkava Labs が開発したマルチタイムフレーム・トレンドマトリックスで、方向性の状態、強度、モメンタムの状況、マトリックスの合意をひとつのコンパクトなパネルに集約します。ひとつのアダプティブエンジンがM1からW1まで一貫して適用されます。シンボルごとの調整は不要。インジケーターの積み重ねも不要。すべてのアセットとすべてのタイムフレームをカバーするひとつの構造化された読み取りです。 発売キャンペーン — Meridian Proを USD 99 (導入価格)で入手。通常価格:USD 149 。 1. Meridian Proが他と異なる理由 ひとつのエンジン、バラバラなインジケーターのダッシュボードではない 多くのMTFダッシュボードは、タイムフレームごとに生のインジケーター値を繰り返すだけです。Meridian Proはマトリックス全体でひとつのアダプティブ・トレンドエンジンを使用するため、パネルの各行が同じ構造化フレームワークから導出されます
IX Power MT5
Daniel Stein
4.92 (13)
IX Power: 指数、商品、暗号資産、外国為替市場の洞察を発見 概要 IX Power は、指数、商品、暗号資産、外国為替市場の強弱を分析するための多用途ツールです。 FX Power が全ての利用可能な通貨ペアデータを活用して外為ペアで最高の精度を提供する一方、 IX Power は基礎資産の市場データにのみ焦点を当てています。この特性により、 IX Power は非外為市場に最適であり、単純な外為分析にも信頼性の高いツールです。どのチャートでもスムーズに機能し、取引判断を向上させるための明確で実行可能な洞察を提供します。 1. IX Power がトレーダーにとって価値がある理由 複数市場での強弱分析 • IX Power は指数、商品、暗号資産、外為シンボルの強弱を計算し、それぞれの市場に合わせた洞察を提供します。 • US30、WTI、ゴールド、ビットコイン、または通貨ペアなどの資産を監視して取引機会を発見できます。 幅広い市場に適応 • 外為取引では、 FX Power が関連する全ての通貨ペアを分析することで比類のない精度を提供します。 • IX Power
FX Volume MT5
Daniel Stein
4.79 (24)
FX Volume:ブローカー視点で捉える本物の市場センチメント クイック概要 トレード手法をさらに高めたいとお考えですか? FX Volume は、リテールトレーダーやブローカーのポジション状況をリアルタイムで提供します。これは、COTのような遅延レポートよりもはるかに早く知ることができます。安定した利益を目指す方も、さらなる優位性を求める方も、 FX Volume は大きな不均衡を見極め、ブレイクアウトを確認し、リスク管理を洗練させるのに役立ちます。今すぐ始めて、実際の出来高データがどのように意思決定を変革するかを体感してください! 1. FX Volume がトレーダーにとって非常に有益な理由 高精度の早期警戒シグナル • 各通貨ペアを売買しているトレーダー数を、他者よりも早く、ほぼリアルタイムで把握できます。 • FX Volume は、複数のリテールブローカーから得られる本物の出来高データを収集し、分かりやすい形式で提供する 唯一 のツールです。 強力なリスク管理 • ロングやショートの大きな偏り(インバランス)を特定し、潜在的なトレンド転換を見逃しません。ストップ
作者のその他のプロダクト
Cumulative Delta Volume (CDV) Swing Level - Absorption & Exhaustion Detector Full Documentation: [ Download PDF ] CDV Swing Aggressive Score Guide : [ Download PDF ] Free Professional Education Course: After purchasing, contact me to receive access to the complete CDV Professional Training Video Course. Professional CDV Analysis for Market Reversals This indicator identifies CDV absorption and exhaustion patterns to detect precise market turning points. It analyzes cumulative delta vo
ORDERFLOW SCALPER EA 4.5 [Real time high accurate absorption/exhaustion detection] Advanced Delta Merge Trading System for Professional Traders Full Documentation: [ Download PDF ] Instrument : US30 [DJ30] Time Frame : 15Min Myfxbook Chart: [myfxbook.com/members/DeltaMerge/] Recommended Brokers : icmarkets, fpmarkets [This EA is fully optimized for ICMARKETS US30 conditions] ️ Original Price: $2,399 Limited-Time Offer: $899 Revolutionary Order Flow Analysis Technology with Sma
Orderflow Scalp Pro v2.4   delivers institutional-grade trading intelligence through advanced volume analysis, dynamic VWAP calculations, real-time aggressive score monitoring, and precision arrow signals. This complete trading system transforms complex market data into clear, actionable signals for consistent profitability on 3-4 minute timeframes. Full Documentation: [Download PDF] Four Powerful Components in One System Volume Profile HeatMap with POC/VAH/VAL Transform your charts into inst
Max Min Delta Indicator - Market Volume Imbalance Analysis Gain Deeper Insights into Market Volume Imbalance with Delta Analysis What is the Max Min Delta Indicator? The Max Min Delta Indicator is a powerful market volume analysis tool that visually represents maximum and minimum delta values using a histogram. It helps traders identify market strength, weakness, absorption, and aggressive buying/selling activity with precision. Key Features Histogram Visualization: Displays Max Delta (Green) an
Risk Management EA - Advanced Trading Tool with Visual Controls Description: This comprehensive Risk Management EA transforms your trading experience with an intuitive visual interface directly on your chart. Take full control of your trades with precise risk calculation, customizable entry/exit points, and one-click order execution. Key Features: Visual Trade Management : Drag-and-drop SL/TP lines with real-time profit/loss calculations Automated Risk-Based Position Sizing : Instantly calculate
Advanced Market Analysis Tool. Full Documentation: Download Free Professional Education Course: After purchasing, contact me to receive access to the complete CDV Professional Training Video Course. — It will help you master CDV , Aggressive Buyer & Seller dynamics , and Volume Microstructure concepts through a clear, step-by-step learning process. Overview The Professional CDV with Aggressive Score is a comprehensive volume analysis tool that combines visual Cumulative Delta Volume (CDV)
The Absorption & Exhaustion Detector Professional indicator is a sophisticated volume analysis tool designed to identify critical market turning points by analyzing the relationship between price movement and cumulative volume delta (CVD). This indicator helps traders spot when price movements lack volume confirmation, indicating potential absorption or exhaustion zones. KEY FEATURES Real-time Cumulative Volume Delta (CVD) calculation and normalization Price-volume divergence gap measurement dis
Professional VWAP Trading System with Advanced Signal Detection Transform your trading with the most comprehensive VWAP indicator available for MetaTrader 5. Magic VWAP Key Levels Pro combines multiple timeframe analysis, intelligent signal detection, and professional-grade visualization to give you the edge in modern markets. CORE FEATURES: Multi-Timeframe VWAP Analysis Session, Weekly, and Monthly VWAP calculations Previous 10-day VWAP support/resistance Dynamic anchor periods (Session/Week/Mo
Aurum VWAP EA - Professional Gold Trading System Institutional-Grade VWAP Analysis for XAUUSD H4 ️ XAUUSD 4 H Set File : [ Download ] Limited-Time Discount! Get this powerful tool now for only $699 — price will increase at the end of this month! Don’t miss your chance to lock in the discount before the price goes up. Aurum VWAP EA is a sophisticated automated trading system designed specifically for Gold (XAUUSD) on the H4 timeframe. Built on proven institutional trading principles, this Exp
Professional Institutional Trading System Symbol: XAUUSD Recommended Timeframe: M30 Minimum Capital Requirement: 300 USD (or equivalent in other currencies) Broker Compatibility: Fully compatible with all MT5 brokers Delta Wave v1.2 is an advanced algorithmic trading system that integrates Volume Weighted Average Price (VWAP) analytics with Cumulative Delta Volume (CDV) to identify high-probability trading opportunities. It is designed for traders seeking professional execution, objective signa
Gold Liquidity Engine v1.7 — AI-Powered Institutional Order Flow Scalper for XAUUSD Gold Liquidity Engine is an advanced algorithmic trading system built on institutional Smart Money Concepts, designed exclusively for XAUUSD (Gold). It identifies and exploits liquidity sweeps, order blocks, and fair value gaps the way professional traders operate — fully automated on the M15 timeframe. EA Checking Account. Login : 52744271 Password : GLE_Pass #2026 Server : ICMarketsSC-Demo Core Strategy The EA
フィルタ:
レビューなし
レビューに返信