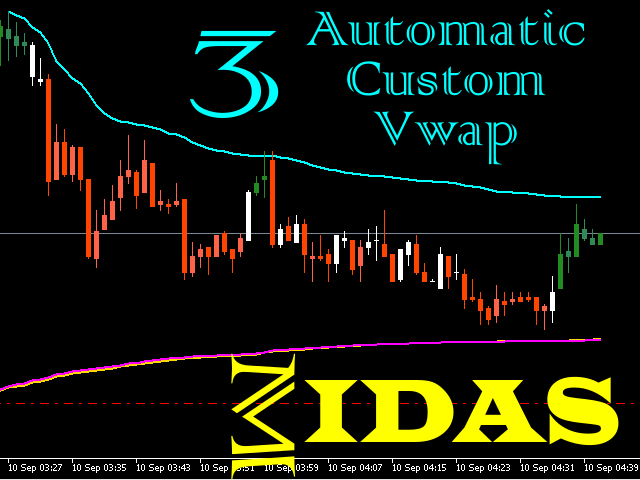
Automatic Vwap Midas
- インディケータ
- バージョン: 1.6
- アップデート済み: 22 5月 2022
- アクティベーション: 5

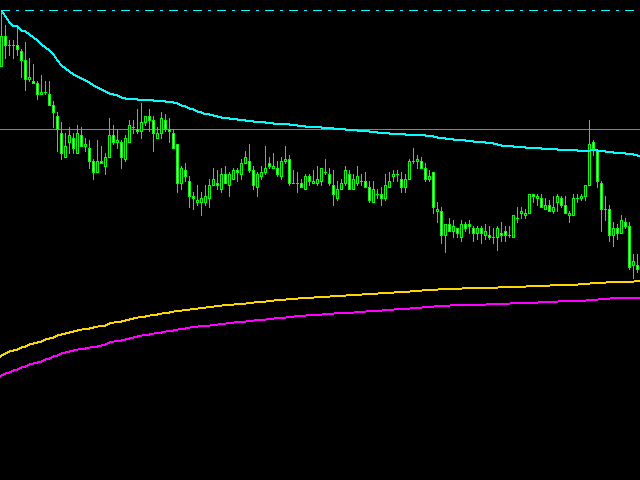
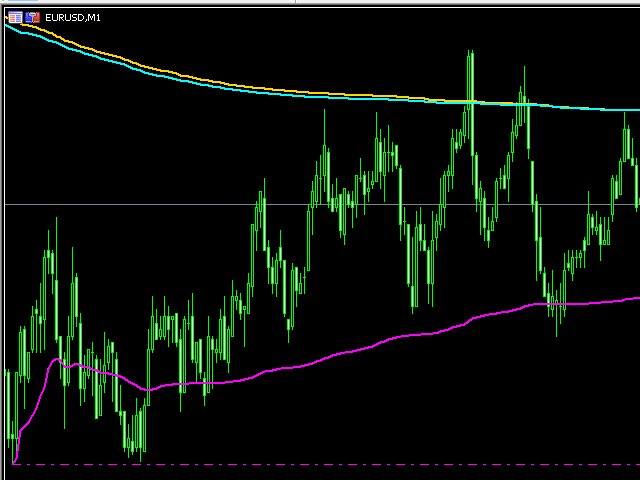
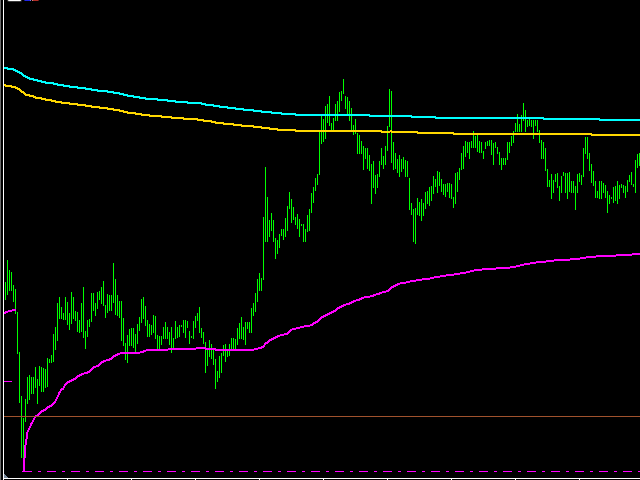
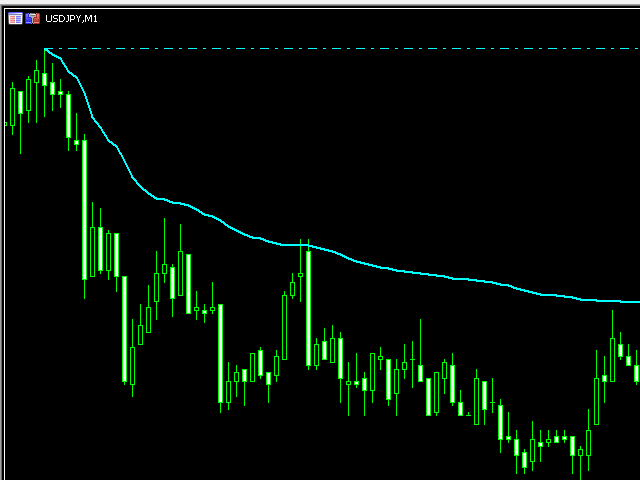
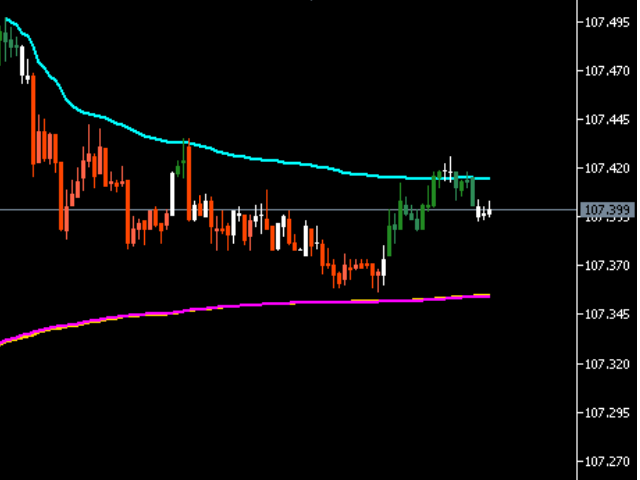
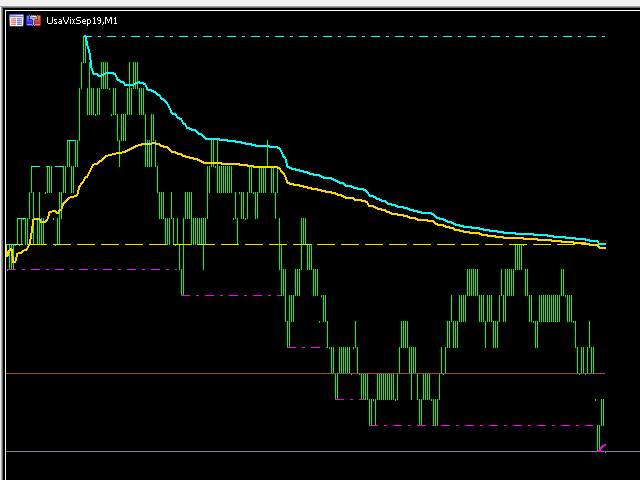
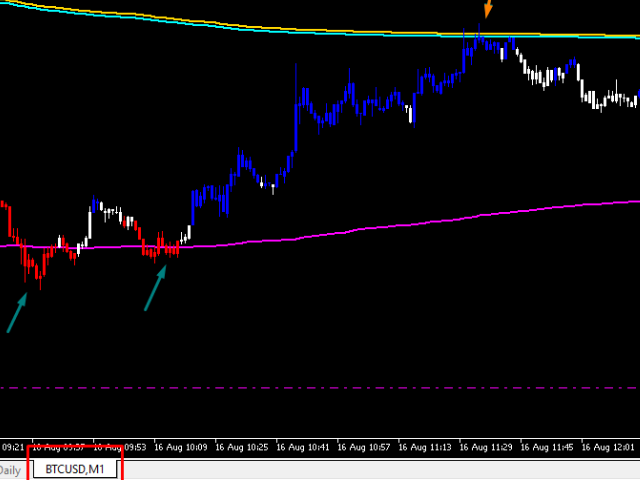
The 3 Automatic Vwap (Midas) Indicator can be used for Price and Volume studyers to map the movement of market drivers. It automatically plots 3 Vwaps, two of which are dynamic and will be updated throughout the day if new highs or new lows emerge. The third Vwap is daily and can help if the trend is up or down. Also, an auxiliary indicator that plots (also dynamic) points of interest with OHLC prices (Open, High and Low of the current day and Close of the previous day) was inserted. Success and good trades!


Very nice one. Run smoothly.