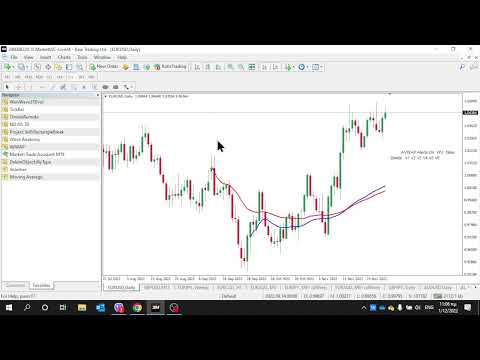
Anchored VWAP with Alert MT5

5


What is the Volume Weighted Average Price (VWAP)?

The volume weighted average price (VWAP) is a trading benchmark used by traders that gives the average price an instrument has traded at throughout the day, based on both volume and price. 
It is important because it provides traders with insight into both the trend and value of the instrument.

What is the Difference between VWAP and AVWAP?
While VWAP is having as starting point the beggining of the day,week,month etc. in the AVWAP you can place it anywhere you like in your chart.

Description of indicator

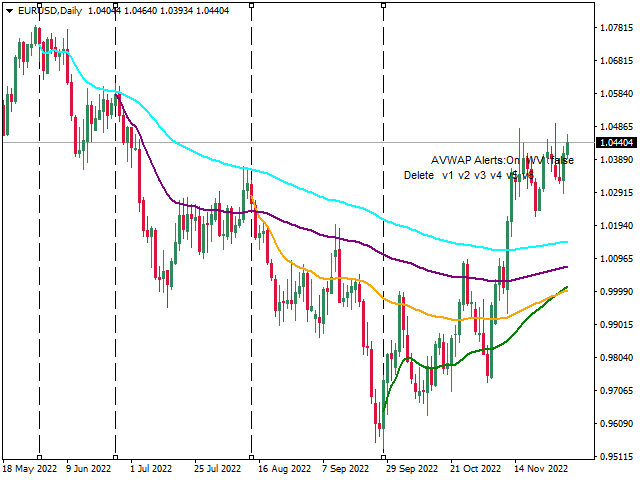
This indicator provides 6 AVWAP lines. Once loaded into the chart a Label will appear on your screen "No Vertical Lines".
By clicking on the label "No Vertical Lines" the indicator creates 6 dashed vertical lines at the beginning of your chart separated by three bars each and draw the VWAP lines named v1,v2,v3, v4, v5, v6 in six different colors. By moving a vertical line the VWAP line with get automatically updated. By clicking "Delete" all lines will be deleted. By clicking "v1" will delete v1 line only, etc. You can also create the vertical lines one by one by key pressing on the top of your keyboards numbers 1,2,3,4,5 or 6. Press number 1 will create "v1", number 2 will create "v2", etc.. (vertical lines will not be created if they already exist on your chart).
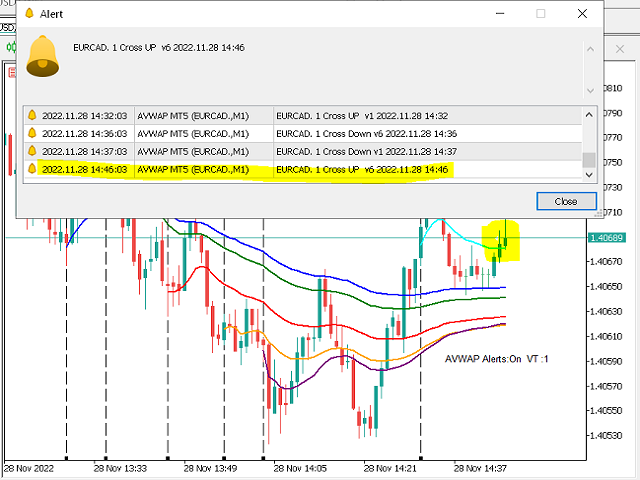
Furthermore, the indicator provides four types of Alerts every time a AVWAP line is crossed.

Every time you click the label the indicator create the 6 vertical lines and/or repositions them at the beginning of the chart if they already exist. 

What If:
  • You do not need 6 VWAP lines: just delete the vertical lines you do not need by clicking on v1 to v6 text
  • You erase by accident a vertical line: just create it manually by pressing the top keyboard keys from 1-6
  • You would like to hide AVWAP lines just click on the "Hide AWVAP" text and to display them again just click on the "Show"  text
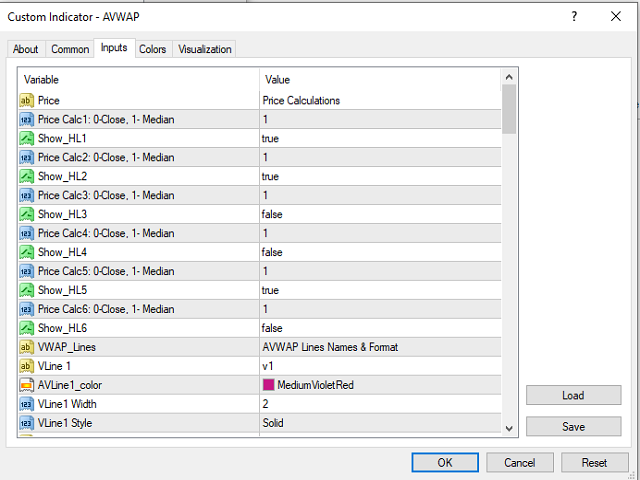

Parameters

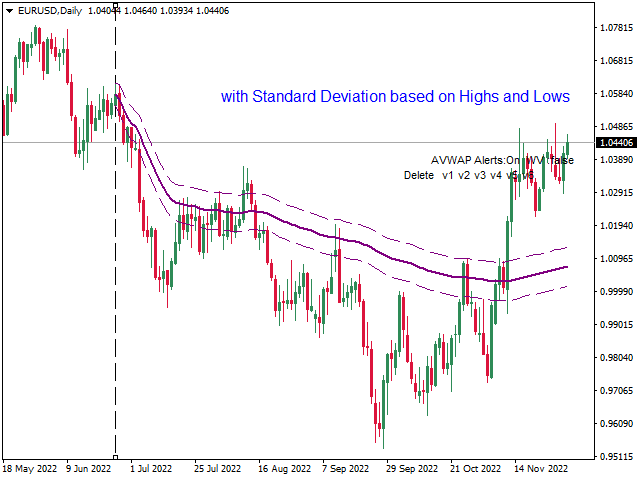
Price Close1-6: 0 Close, 1 Median. You can decide is VWAP will be calculated using price close or price median (High+Low)/2.

Show_HL1-6 : true/false Display or not the High and Low of each AVWAP line which acts a standard deviation

AVWAP Lines Name and Format
  • Format each AVWAP lines and their Highs and Lows name,color, style and width

Vertical and Format

  • You can format Vertical lines color, style and width
 Volume type: if true the indicator uses Tick Volume, if false the indicator uses Real Volume (if available from your broker)

Alerts on AVWAP cross

  • Set Alert on AWAP cross up or down on each AVWAP lines and their Highs and Lows.


Alert Type

  • TriggerCandle = 1: The candle number that the alert will be triggered (0 is the forming candle, 1 is the one before the forming-closed)
  • EnableNativeAlerts = true/false : Pop-up
  • EnableSoundAlerts  = true/false: Sound
  • EnableEmailAlerts  = false: Email
  • EnablePushAlerts  =true: Push Notification
  • SoundFileName = "alert.wav": Sound File

Placement and Format of AVWAP Label
  • Corner=1 : Corner of window indicator name will be displayed
  • Top_Offset = 150; // Top Offset Display
  • Right_Offset  = 20;// Right Offset Display
  • Text_Font_Size = 8;// Font Size Display
  • Text_Color = Black;//Txt Color Display


Enjoy!


レビュー 1
Kda001
196
Kda001 2024.05.16 08:51 
 

The indicator is great. Thank you for sharing.

おすすめのプロダクト
Mahdad Candle Timer は軽量かつ高精度な MetaTrader 5 用インジケーターで、現在のローソク足がクローズするまでの残り時間を、最新のバーのすぐ横に表示します。スキャルピング、デイトレード、あるいはスイングトレードでローソク足の確定を待つトレーダーなど、正確なタイミングを重視する方に最適です。 主な機能 正確なカウントダウン – 残り時間を HH:MM:SS 形式で表示(ミリ秒もオプションで対応) ダイナミックな配置 – ズームやスケールに関係なく常に最新ローソク足に揃えて表示 スマートなカラー適応 – 背景色やローソク足の方向(上昇/下降)に応じて自動的に文字色を調整 カスタムアラート – ローソク足クローズの数秒前にサウンドまたはポップアップで通知 完全カスタマイズ可能 – フォント、サイズ、色、更新速度、アラーム設定を自由に調整可能 軽量で効率的 – CPU使用率は最小限、他のインジケーターやEAに干渉しない設計 ️ 入力パラメータ Show Milliseconds (true/false) Update Interval (ms) Bull
FREE
VWAP Fibo Bands RSJ is an indicator that traces the lines of the daily VWAP and from it creates bands using Fibonacci proportions. This spectacular indicator creates 10 band levels through the selected VWAP period using Fibonacci ratios. It is fantastic how the prices respect each level of the bands, where it is possible to realize that almost every time the price closes above / below a level of the bands he will seek the next one. If close above will seek to reach the level above and if close
FREE
The   Visual Volatility Clustering   indicator clusters the market based on volatility. The indicator does not redraw and gives accurate data, does not use closing prices. Uses the opening prices or the highs or lows of the previous completed bar. Therefore, all information will be clear and unambiguous. The essence of the indicator is to divide the price market into certain areas according to a similar type of volatility. This can be done in any way. In this example, the indicator is configure
アンカードVWAP アンカードVWAPは、従来のVWAPの変形版であり、指標の計算が取引セッションの開始時や固定された時間間隔ではなく、特定の時点(アンカー)から開始されます。これは、重要なニュース、トレンドの開始、サポートラインやレジスタンスラインの突破などのテクニカルイベントなど、特定のイベントを起点として、出来高と価格の関係を評価したいトレーダーに有用です。 この指標は、外国為替、株式、指数で機能します。 同一のチャートに複数のインスタンスを追加でき、各VWAPのアンカーをクリック一つで変更することが可能です。 価格がVWAPに到達した際にアラートを有効にします。 VWAPは「磁石的」な性質を持っています:ローソク足の上にマウスを置くとHIGHに、中央でTYPICALに、ローソク足の下でLOWに自動設定されます。
VWAP and MVWAP
Flavio Javier Jarabeck
3.88 (8)
Volume Weighted Average Price (VWAP) is a trading benchmark commonly used by Big Players that gives the average price a Symbol has traded throughout the day. It is based on both Volume and price. Additionally we put in this indicator the MVWAP (Moving Volume Weighted Average Price). For those who do not know the usage and the importance od this indicator I recommend a great article about this subject at Investopedia ( https://www.investopedia.com/articles/trading/11/trading-with-vwap-mvwap.asp )
FREE
VWAP Anchor Tool
Jackson Mukurani Wanguthi
Anchored VWAP is a lightweight, interactive volume-weighted average price indicator designed for traders who need precision without clutter. Unlike standard VWAP that resets every session, this tool lets you drop up to five custom anchors directly on any candle. Each anchor calculates VWAP from that exact point forward, complete with standard deviation bands to highlight where price may find support or resistance relative to volume. Key Features: • Up to 5 simultaneous anchors — compare multi
FREE
Swiss VWAPsimple
Terence Gronowski
4.8 (5)
Swiss VWAPsimple Motivation Did not find free VWAP that works, the one that I found craseh. So I created a VWAP which calculates values only for the actual day. So computer resouces are not over stressed. What is VWAP, how is it used?  VWAP stands for Volume Weighed Average Price, it calculates the running sum of tick volume and the runnung sum of price times tickvolume. The division of these sums result in a weighed price (Sum P*V/Sum V). The calculation starts normally at midnight. The values
FREE
インジケーター技術仕様 – Delta Profile for MetaTrader 5 Delta Profile は MetaTrader 5 用に開発されたインジケーターで、指定されたローソク足範囲内の出来高フローを詳細に分析するためのものです。異なる価格レベルにおける正の出来高(上昇に関連)と負の出来高(下降に関連)の不均衡を構造化し、可視化します。その結果、ユーザーは最も多くの取引が集中する価格帯や実際の市場不均衡が形成される領域を明確に把握できます。 以下に、本インジケーターの主要な技術特性と設定パラメータを示します。 基本コンセプト インジケーターは 価格レベル を識別し、それらを正の出来高、負の出来高、および純 Delta(正負の出来高差)に分類します。 各価格レベルは 水平バー としてチャートに表示され、市場の活動ゾーンや不均衡領域を視覚的に確認できます。 ユーザーは 分析対象ローソク足数 、 価格の丸め精度 、 最大表示レベル数 、および 表示スタイル を自由に設定できます。 主要機能 価格レベルのマッピング :設定された精度に基づき価格を丸め、対応するローソク足の
Stackable VWAP
Flavio Javier Jarabeck
3.5 (4)
Volume Weighted Average Price (VWAP) is a trading benchmark commonly used by Big Players that gives the average price a Symbol has traded throughout the day. It is based on both Volume and price. Additionally we put in this indicator the MVWAP (Moving Volume Weighted Average Price). For those who do not know the usage and the importance od this indicator I recommend a great article about this subject at Investopedia ( https://www.investopedia.com/articles/trading/11/trading-with-vwap-mvwap.asp
FREE
Time and Sales Tick
Pablo Filipe Soares De Almeida
Time & Sales Tick Indicator は、MetaTrader 5チャート上でリアルタイムのティック情報を表示するインジケーターです。 価格、ティック出来高、時刻を視覚的に確認でき、市場の動きを細かく分析することが可能です。 機能 価格、出来高、時間を含むティックデータをチャート上の専用パネルにリアルタイム表示します。 ティックをユーザーが設定した間隔でグループ化し、上昇ティックは緑色、下降ティックは赤色で色分け表示します。 パネルはチャートの4隅の任意の位置に配置でき、サイズや透明度の調整も可能です。 MetaTrader 5のすべてのシンボルおよびタイムフレームで使用可能で、軽量かつ安定した動作を実現しています。 このインジケーターは、スキャルピングや短期分析に特に適しています。
Weis Wave Double Side
Eduardo Da Costa Custodio Santos
The Weis Wave Bouble Side Indicator for MT5 is part of the toolkit (Wyckoff Academy Wave Market) The Weis Wave Bouble side Indicator for MT5 was created based on the already established Weis Wave created by David Weis. The Weis Wave Double Side indicator reads the market in waves as it was done by R. Wyckoff in 1900. It helps in the identification of effort x result, cause and effect, and Supply and demand Its differential is that it can be used below the zero axis, further improving plus operat
White Weis Volume This indicator shows the sum of the volume in each wave, bulish or bearish, as idealized by David Weis , but it brings an important addition , which is the marking of the bar with the highest volume of the wave (White Bar)! In coding the indicator, it was sought to optimize the code to require minimal processing during use and not to overload mt5. The indicator can be used for pre-trading analysis and study, where the trader analyzes possible points of support and resistance
MIDAS Super VWAP
Flavio Javier Jarabeck
4.27 (11)
Imagine VWAP, MVWAP and MIDAS in one place... Well, you found it! Now you can track the movement of Big Players in various ways, as they in general pursue the benchmarks related to this measuring, gauging if they had good execution or poor execution on their orders. Traders and analysts use the VWAP to eliminate the noise that occurs throughout the day, so they can measure what prices buyers and sellers are really trading. VWAP gives traders insight into how a stock trades for that day and deter
FREE
Midas VWAP
Paulo Henrique Faquineli Garcia
4 (2)
Volume Weighted Average Price (VWAP) is a trading benchmark commonly used by Big Players that gives the average price a Symbol has traded throughout the day. It is based on both Volume and price. This indicator contains Daily VWAP and MIDAS' VWAP, which means you are able to anchor the beggining of MIDAS' calculations and, therefore you will be able to use this methodology to study price versus volume moves after anchor point. You will be able to anchor up to 3 HIGH MIDAS VWAP's and 3 LOW. Wish
FREE
A Média Móvel é um indicador que faz parte da Análise Técnica. Com ela, é possível identificar o equilíbrio dos preços no mercado, observando tendências de alta, neutra ou baixa. Este indicador customizado traz opções extras pera definir o método de cálculo podendo-se esclolher entre SMA,EMA,SSMA,LWMA,JJMA,JurX,ParMA,T3,Vidya,AMA,HULL MA. Também conta com varias opções para escolher o método de cálculo para o preço base a ser usado no cáculo da média.
Wave Box Market Frenquency
Jean Jacques Huve Ribeiro
4.75 (4)
Totally linked to the result of a movement and the duration he had. Its height records how many ticks the asset walked during a given movement, its width shows us the duration that movement had. Its configuration must be in line with the Weis Wave Indicator configuration to observe the movement force and can indicate a possible accumulation or distribution of the movement;
FREE
RENKO PRICE ACTION ATRは、レンコチャートの作成を通じて開発された「エキスパートアドバイザー」であり、各BRICKは、ユーザーが選択した期間のATRによって計算されたサイズを持ちます。 レンコチャートは、マイナーな価格変動を除外するように設計されているため、トレーダーは重要なトレンドに集中しやすくなります。 価格動向の検出効率が高いため、支持と抵抗、および上下の相違を明確に識別して、取引機会をより有効に活用することもできます。 手術 RENKO PRICE ACTION ATRは、どの通貨ペアでも機能します。 RENKO PRICE ACTION ATRは、優れたリアルタイム更新パフォーマンスを備えています。 設定 ATR計算時間枠:ATRの平均を適用し、各BRICKのサイズを計算/再計算するためのRENKO PRICE ACTIONATRのユーザー選択期間。 ATR計算平均化期間:各BRICKのサイズ計算を実行するためのRENKO PRICE ACTIONATRのATR平均化のユーザー選択期間。 ATRサイズのパーセンテージ:各BRICKの形成に使用される計
Value Chart Candlesticks
Flavio Javier Jarabeck
4.57 (14)
The idea of a Value Chart indicator was presented in the very good book I read back in 2020 , " Dynamic Trading Indicators: Winning with Value Charts and Price Action Profile ", from the authors Mark Helweg and David Stendahl. The idea is simple and the result is pure genius: Present candlestick Price analysis in a detrended way! HOW TO READ THIS INDICATOR Look for Overbought and Oversold levels. Of course, you will need to test the settings a lot to find the "correct" one for your approach. It
FREE
HLC bar MT5 Wyckoff
Eduardo Da Costa Custodio Santos
MT5のインジケーター「HLC_bar_MT5Wyckoff」は、取引時の分析を容易にするために作成されました。 HLCバーはRichardWyckoffによって使用され、現在「VSA」操作で広く使用されています。 Wyckoffは、High、Low、およびCloseを使用すると、グラフがはるかにクリーンになり、分析が容易になることを発見しました。 区分 "HLC_bar_MT5 Wyckoff"により、以下が可能になります。 #バーの幅を変更します。 #バーを同じ色のままにします。 #そして、同じ価格で開閉したバーを強調表示します。 色と幅は設定で簡単に変更できます インジケーターを使用するには、インジケーターをチャートにドラッグするだけです。
VWAP Indicator
LUC JACOBUS A VERHEECKE
4.11 (27)
Volume Weighted Average Price (VWAP) The volume weighted average price (VWAP) is a  trading   benchmark  used by traders that gives the average price a security has traded at throughout the day, based on both volume and price. It is important because it provides traders with insight into both the trend and value of a security. This indicator VWAP V2 is free and is the manual version of the extended Easy VWAP indicator (30 Euro), where the date and time properties are automatically entered. With
FREE
Breakout Boxes with Volume Pressure This indicator automates the identification of key consolidation zones (Supply and Demand) based on Market Pivots and Volatility (ATR). Unlike standard support/resistance tools, this indicator provides a unique   Volume Pressure Analysis   inside every box, giving you insight into the battle between Buyers and Sellers before a breakout occurs. Key Features Automated Supply & Demand Zones:   Automatically detects significant Pivot Highs and Lows to draw dyna
The VWAP indicator is our version of the popular Volume-Weighted Average Price indicator. The VWAP is the ratio between the value traded (price multiplied by the number of volume traded) and the total volume traded over a specific time period. As a result, it measures the average price of the instrument much better than the simple moving average. Although there are many ways to use the VWAP, most investors use it to calculate the daily average.  The indicator works in five modes: Moving  - In
The indicator highlights the points that a professional trader sees in ordinary indicators. VisualVol visually displays different volatility indicators on a single scale and a common align. Highlights the excess of volume indicators in color. At the same time, Tick and Real Volume, Actual range, ATR, candle size and return (open-close difference) can be displayed. Thanks to VisualVol, you will see the market periods and the right time for different trading operations. This version is intended f
FREE
Delta + CVD & CVD Candles Order-flow indicator combining Delta (Ask–Bid), Cumulative Volume Delta (CVD), and a unique CVD-based synthetic candle system. Shows buy/sell pressure, volume aggressiveness, and momentum shifts with optional Delta histogram, CVD line, and CVD+Delta combined candles. Useful for scalping, intraday trading, divergence detection, and understanding buyer/seller dominance. Overview The Delta + CVD & CVD Candles Indicator combines multiple order-flow tools into one clean
The "MR Volume Profile 5" indicator is a charting tool that displays trading volume at different price levels rather than time intervals. A key concept in volume profile is the point of control (POC)—the price level with the highest volume traded during the session or time range. While tools like VWAP or OBV provide volume trends, the "MR Volume Profile 5" indicator offers granular detail about where the most market activity occurs at specific price levels. This makes it a more precise tool for
Indicador Regressão Linear – Par de Ativos - INTRADAY Indicador é um oscilador que faz o plot do Resíduo resultado da regressão linear entre os dois ativos inseridos como input do indicador, representado pela fórmula: Y = aX + b + R Onde Y é o valor do ativo dependente, X é o valor do ativo independente, a é a inclinação da reta entre os dois ativos, b é a intersecção da reta e R é o resíduo. O resíduo representa a quantidade da variabilidade que Y que o modelo ajustado não consegue explicar. E
FREE
オーダーブロック&ダイナミックフィボナッチプロ 自動化された高精度なトレーディングで、機関投資家レベルの取引をマスターしましょう。 Smart Money Concepts(SMC)のトレーディングは、かつてないほど簡単かつ正確になりました。オーダーブロック&フィボナッチは、高確率の市場構造の検出を完全に自動化するために設計された最先端の分析ツールです。機関投資家向けの需給ゾーンと高度なダイナミックリトレースメントを組み合わせることで、このインジケーターは推測を排除し、プロレベルの分析をチャートに直接表示します。 ダイナミックフィボナッチ:ゴールデンゾーン&レッドゾーン フィボナッチレベルを手動で描画する必要はもうありません。当社のアルゴリズムは、リアルタイムの市場の動きを積極的に追跡し、最も重要な取引エリアを動的にマッピングすることで、圧倒的な優位性をもたらします。 ゴールデンゾーン(0.50~0.618):市場の押し目に最適な「スイートスポット」。チャート上に直接ハイライト表示されるこのゾーンは、価格の急騰やスナイパーエントリーの確率が最も高いゾーンです。価格があなた
Advanced CRT Indicator MT5 — Candle Range Theory Tool Advanced CRT Indicator MT5 is a professional analysis tool that automates Candle Range Theory. It identifies consolidation ranges, breakout levels, Fair Value Gaps (FVG), and profit targets, with a real-time dashboard and alerts. Overview - Multi-timeframe candle range detection   - Automatic breakout levels with buffer settings   - Fair Value Gap identification and tracking   - Up to three customizable target levels (Risk:Reward ratios)  
Volume Weighted Average Price or VWAP is an indicator wich shows different average prices on chart. This is very useful to find strong negotiation price areas and as trend following. Configurations: Day, Week and Month - Show different VWAPs according to the period. You can change each line style on "colors" tab. Any doubt or suggestion please contact us. Enjoy! This is a free indicator, but it took hours to develop. If you want to pay me a coffee, I appreciate a lot   <3 PayPal, Skrill, Nete
FREE
このプロダクトを購入した人は以下も購入しています
Neuro Poseidon is a new indicator by Daria Rezueva. It combines precise trading signals with adaptive TP/SL levels - creating best possible trades as a result! Message me and get  Neuro Poseidon Assistant  as a gift to automize your trading process! What makes it stand out? 1. Proven profitability on all assets and timeframes 2. Only confirmed BUY and SELL signals present on the chart 3. Adaptive TP & SL levels generated by the software for each trade 4. Easy to understand - suitable for al
PrimeScalping is a powerful trading companion designed to generate high-probability entry signals with dynamic TP/SL/DP levels based on volatility. Built-in performance tracking shows win/loss stats, PP1/PP2 hits, and success rates — all updated live. Key Features: Buy/Sell signals with adaptive volatility bands Real-time TP/SL/DP levels based on ATR Built-in MA Filter with optional ATR/StdDev volatility Performance stats panel (Success, Profit/Loss, PP1/PP2) Alerts via popup, sound, push, or e
SuperScalp Pro
Van Minh Nguyen
4.65 (26)
SuperScalp Pro – 高度なマルチフィルタースキャルピングインジケーターシステム SuperScalp Pro は、クラシックな Supertrend と複数のインテリジェント確認フィルターを組み合わせた高度なスキャルピングインジケーターです。M1 から H4 まで複数の時間足で効率的に動作し、XAUUSD、BTCUSD、主要 Forex 通貨ペア向けに最適化されています。 このインジケーターは明確な Buy / Sell シグナルを提供し、ATR に基づいてエントリー価格、Stop Loss、Take Profit を自動計算します。Fibonacci Take Profit 機能により、重要な価格帯で早期決済し、到達時に通知を送信します。 初期設定では Fibonacci Take Profit が有効化されており、より安定した取引体験を重視しています。チャートに適用するだけですぐ利用可能です。上級者向けに、すべてのパラメータは自由にカスタマイズできます。 完全なドキュメントは製品ブログにあります: [User Guide] SuperScalp Pro Auto T
このインジケーターを購入された方には、以下の特典を 無料 で提供しています: 各トレードを自動で管理し、ストップロスとテイクプロフィットを設定し、戦略ルールに基づいてポジションを決済する補助ツール 「Bomber Utility」 様々な銘柄に合わせたインジケーターの設定ファイル(セットファイル) 「最小リスク」、「バランスリスク」、「待機戦略」 の3つのモードで使用できる Bomber Utility 用の設定ファイル このトレーディング戦略をすぐに導入・設定・開始できる ステップバイステップのビデオマニュアル ご注意: 上記の特典を受け取るには、MQL5のプライベートメッセージシステムを通じて販売者にご連絡ください。 オリジナルのカスタムインジケーター 「Divergence Bomber(ダイバージェンス・ボンバー)」 をご紹介します。これは、MACDのダイバージェンス(乖離)戦略に基づいた 「オールインワン」型のトレーディングシステム です。 このテクニカルインジケーターの主な目的は、価格とMACDインジケーターの間に発生するダイバージェンスを検出 し、将来の価格の動きを示す
まず正直に言いましょう。 どんなインジケーターも、それ単体であなたを利益化させることはできません。もしそう言う人がいるなら、それは夢を売っているだけです。完璧な売買シグナル(矢印)を表示するインジケーターは、いくらでも“完璧に見せる”ことができます。正しい過去の区間を拡大して、勝ちトレードだけを切り取ればいいだけです。私たちはそれをしません。 SMC Intraday Formula はツールです。 市場構造を読み取り、最も高い確率の価格ゾーンを特定し、今この瞬間のスマートマネーの痕跡をシンプルな言葉で正確に示します。最終判断はあなたが行います。トレードを実行するのもあなたです。しかし今は「希望」ではなく「精度」でエントリーできます。 私たちはこのインジケーターを、ゴールド(XAUUSD)および主要FX通貨ペアで約3年間、日々のスキャルピングに使用してきました。M1、M5、M15、M30の主要ツールです。これは未来を予測しようとするのではなく、今まさに形成されている高確率セットアップを示し、その理由を説明します。 他のすべてのインジケーターと何が違うのか? ほとんどのトレーディングイ
Entry In The Zone and SMC Multi Timeframe is a real-time 2-in-1 market analysis tool that combines market structure analysis and a No Repaint BUY / SELL signal system into a single indicator, built on Smart Money Concepts (SMC) — a widely adopted framework used by professional traders to understand market structure. This indicator helps you see the market more clearly, make decisions based on structure rather than guesswork, and focus on high-probability zones where price is more likely to react
ご紹介     Quantum Breakout PRO は 、ブレイクアウト ゾーンの取引方法を変革する画期的な MQL5 インジケーターです。 13年以上の取引経験を持つ経験豊富なトレーダーのチームによって開発されました。     クォンタム ブレイクアウト プロ   は、革新的でダイナミックなブレイクアウト ゾーン戦略により、あなたのトレーディングの旅を新たな高みに押し上げるように設計されています。 クォンタム ブレイクアウト インジケーターは、5 つの利益ターゲット ゾーンを備えたブレイクアウト ゾーン上のシグナル矢印と、ブレイクアウト ボックスに基づいたストップロスの提案を提供します。 初心者トレーダーにもプロのトレーダーにも適しています。 量子EAチャネル:       ここをクリック 重要!購入後、インストールマニュアルを受け取るためにプライベートメッセージを送ってください。 推奨事項: 時間枠: M15 通貨ペア: GBPJPY、EURJPY、USDJPY、NZDUSD、XAUUSD アカウントの種類: ECN、Raw、またはスプレッドが非常に低い R
この製品は 2026 年の市場向けに更新され、最新の MT5 ビルドに最適化されています。 価格更新のお知らせ: Smart Trend Trading System は現在 $99 で提供されています。 次の 30 件の購入 後、価格は $199 に上がります。 特別オファー: Smart Trend Trading System を購入後、私にプライベートメッセージを送ることで、 Smart Universal EA を無料 で受け取り、Smart Trend のシグナルを自動売買に変えることができます。 Smart Trend Trading System は、リペイントなし、再描画なし、遅延なしの完全なトレーディングシステムです。よりクリーンなシグナル、より明確なトレンド方向、そしてより整理された取引方法を求めるトレーダー向けに作られています。 Online course , manual and download presets . このシステムは、トレンド検出、反転ゾーン、Smart Cloud、トレーリングストップロジック、サポートとレジスタンス、ローソク足の色分け、ア
Power Candles V3 - 自己最適化型強弱インジケーター Power Candles V3は 、通貨や銘柄の強さを、適用されたすべてのチャート上で実行可能なトレードプランに変換します。単にローソク足を色分けするだけでなく、バックグラウンドでリアルタイムの自動最適化を実行し、目の前の銘柄に対して最適なストップロス、テイクプロフィット、およびシグナルの閾値を提示します。ワンクリックで実取引に適用でき、エントリーポイント、ストップロス、テイクプロフィットのラインが正確な価格位置にチャート上に表示され、方向性を示すアラートがリアルタイムで発動します。 このツールは、Stein Investmentsのエコシステムの一部です。  18種類以上のツールをすべて閲覧し、AIを活用したセットアップの推奨事項を入手し、  https://stein.investments でコミュニティに参加しましょう クローズしたバーごとに3,000回以上のトレードシミュレーション。9つの強さの状態。2つの戦略を並行してテスト。勝率の高い設定をワンクリックで適用。 なぜこれが必要なのか ほとんどの強
SignalTech MT5 is an unique fully rule based trading system for EURUSD, USDCHF, USDJPY, AUDUSD, NZDUSD, EURJPY, AUDJPY, NZDJPY, CADJPY.  All the winning trades with chart setups are published on the comments page. 2026-05 4107 Pips (Until 05-29 NY Closed) 2026-04 2243 Pips 2026-03 2165 Pips 2026-02 2937 Pips 2026-01 2624 Pips 2025-12 1174 Pips It can generate signals with Buy/Sell Arrows and Pop-Up/Sound Alerts. Each signal has clear Entry and Stop Loss levels, which should be automatically flag
FX Trend NG:次世代マルチマーケット・トレンドインテリジェンス 概要 FX Trend NG は、複数の時間足に対応したプロフェッショナル向けトレンド分析およびマーケット監視ツールです。 市場全体の構造を数秒で把握することができます。 複数のチャートを切り替える必要はありません。どの銘柄がトレンド中なのか、どこでモメンタムが弱まっているのか、そしてどの時間足で強い整合性があるのかを瞬時に確認できます。 ローンチ特別オファー – FX Trend NG を $30(6ヶ月) または $80 永久ライセンス でご利用いただけます。 すでに Stein Investments のユーザーですか? -> メッセージを送信 して、プライベートグループへアクセスしてください。 セットアップや詳細情報が必要ですか? -> Stein Investments 公式ページ をご覧ください。 1. FX Trend NG が他と異なる理由 3ステート・トレンドロジック ― Buy と Sell だけではない • 多くのインジケーターは Buy または Sell の2状態のみを表示します。
トレンドキャッチャーインジケーター トレンドキャッチャーインジケーターは、開発者独自の適応型トレンド分析指標を組み合わせることで、市場価格の動きを分析します。短期的なノイズを除去し、根底にあるモメンタムの強さ、ボラティリティの拡大、価格構造の挙動に焦点を当てることで、真の市場方向性を特定します。また、移動平均線、RSI、ボラティリティフィルターなどの平滑化およびトレンドフィルタリング機能を備えたカスタマイズ指標も使用します。 実際の運用状況のモニタリングやその他の製品については、こちらをご覧ください: https://www.mql5.com/en/users/mechanic/seller ご注意ください。私はTelegramでEAや設定を販売していません。詐欺です。すべての設定はブログで無料で公開しています。 重要!ご購入後すぐにご連絡ください。手順とボーナスをお送りします!
Azimuth Pro
Ottaviano De Cicco
5 (7)
Azimuth Pro V2:MT5向けシンセティック・フラクタル構造分析と確認済みエントリー 概要 Azimuth Pro は Merkava Labs によるマルチレベルスイング構造インジケーターです。4つのネストされたスイングレイヤー、スイングアンカーVWAP、ABCパターン検出、3タイムフレーム構造フィルタリング、そして確定バーでの確認済みエントリー — 1つのチャートで、ミクロスイングからマクロサイクルまでを網羅するワークフロー。 これはブラインドシグナル製品ではありません。ロケーション、コンテキスト、タイミングを重視するトレーダーのための構造ファーストワークフローです。 V2発売記念オファー — Azimuth Pro V2をUSD 399で(次の100本)。最終価格:USD 499。 1. V2での変更点 シンセティック・マルチタイムフレームエンジン 上位タイムフレーム分析をMeridian Proと同じ独自のシンセティックアーキテクチャで一から再構築。よりクリーンなHTFコンテキスト、安定したライブ動作、従来のMTF同期問題なし。シンセティックエンジンは 固定比率タ
Quantum TrendPulse を ご紹介します。これは、   SuperTrend   、   RSI   、および Stochastic のパワーを 1 つの包括的なインジケーターに組み合わせて、取引の可能性を最大限に引き出す究極の取引ツールです。精度と効率を求めるトレーダー向けに設計されたこのインジケーターは、市場のトレンド、勢いの変化、最適なエントリー ポイントとエグジット ポイントを自信を持って特定するのに役立ちます。 主な特徴: SuperTrend 統合: 現在の市場動向に簡単に追従し、収益性の波に乗ることができます。 RSI精度: 買われすぎと売られすぎのレベルを検出し、市場の反転のタイミングに最適で、SuperTrendのフィルターとして使用されます。 確率的精度: 確率的振動を活用して、変動の激しい市場で隠れたチャンスを見つけます。SuperTrend のフィルターとして使用されます。 マルチタイムフレーム分析:   M5 から H1 または H4 まで、さまざまなタイムフレームで市場を常に把握します。 カスタマイズ可能なアラート: カスタム取引条件が満たされ
M30/H1/H4スイング版もあります M5/M15では取りきれない大きな波を狙いたい方へ。 Gold Signal Swing Pro(M30/H1/H4対応)を販売中。 1トレードで$20〜$80+の値幅を狙う。 https://www.mql5.com/en/market/product/177643 KURAMA GOLD SIGNAL PRO(MT5版)— 7層フィルター搭載 XAUUSD完全トレードシステム リペイントなし。リドローなし。ラグなし。すべてのサインは確定後に変わりません。 購入者限定特典:買い切りライセンスをご購入いただいた方に、AI Zone Radar($59相当)+PDFマニュアルを無料プレゼント。購入後にMQL5でメッセージをお送りください。 AI Zone Radar: https://www.mql5.com/en/market/product/175834 ゴールドトレーダーのコミュニティで実際に使用され、精度と使いやすさで高評価。 あなたの問題
Gann Made Easy   は、ミスター・ギャンの理論を使用した取引の最良の原則に基づいた、プロフェッショナルで使いやすい外国為替取引システムです。 W・D・ガン。このインジケーターは、ストップロスとテイクプロフィットレベルを含む正確な買いと売りのシグナルを提供します。 PUSH通知を利用して外出先でも取引可能です。 ご購入後、取引方法の説明と優れた追加インジケーターを無料で入手するには、私にご連絡ください! おそらく、ギャンの取引手法についてはすでに何度も聞いたことがあるでしょう。通常、ギャンの理論は初心者のトレーダーだけでなく、すでにある程度の取引経験がある人にとっても非常に複雑なものです。なぜなら、ギャンの取引手法は理論的にはそれほど簡単に適用できるものではないからです。私はその知識を磨き、最良の原則を私の外国為替インジケーターに組み込むために数年を費やしました。 このインジケーターは非常に簡単に適用できます。必要なのは、それをチャートに添付し、簡単な取引推奨事項に従うだけです。このインジケーターは常に市場分析の仕事を行い、取引の機会を探します。適切なエントリーポイントを検
RelicusRoad Pro: 定量的市場オペレーティングシステム 【期間限定】無制限アクセス 70% OFF - 2,000人超のトレーダーと共に なぜ多くのトレーダーは「完璧な」インジケーターを使っても失敗するのでしょうか? それは、文脈を無視して 単一の概念 だけでトレードしているからです。文脈のないシグナルは単なるギャンブルです。勝ち続けるには、 根拠の重なり(コンフルエンス) が必要です。 RelicusRoad Proは単なる矢印インジケーターではありません。完全な 定量的市場エコシステム です。独自のボラティリティモデリングを用いて、価格が推移する「適正価値の道(Fair Value Road)」をマッピングし、ノイズと真の構造的ブレイクを判別します。 推測はやめましょう。機関投資家レベルの「ロード・ロジック」でトレードを。 コアエンジン:「Road」アルゴリズム システムの中心となる Road Algo は、市場環境にリアルタイムで適応するダイナミックなボラティリティチャネルです。 安全ライン(平衡点) と、価格が数学的に反転しやすい 拡張レベル を投影します。 Si
この製品は 2026 年の市場向けに更新され、最新の MT5 ビルドに最適化されています。 価格更新のお知らせ: Smart Price Action Concepts は現在 $200 で提供されています。 次の 30 件の購入 後、価格は $299 に上がります。 特別オファー: 購入後、私にプライベートメッセージを送ることで、 無料ボーナス + ギフト を受け取ることができます。 まず、このトレーディングツールはリペイントなし、再描画なし、遅延なしのインジケーターであり、プロフェッショナルな取引に最適であることを強調しておきます。 Online course , and manual Smart Price Action Concepts Indicator は、初心者から経験豊富なトレーダーまで使える非常に強力なツールです。20 種類以上の便利なインジケーターを 1 つにまとめ、Inner Circle Trader Analysis や Smart Money Concepts Trading Strategies などの高度な取引アイデアを組み合わせています。このインジケ
ARIPoint
Temirlan Kdyrkhan
1 (1)
ARIPoint is a powerful trading companion designed to generate high-probability entry signals with dynamic TP/SL/DP levels based on volatility. Built-in performance tracking shows win/loss stats, PP1/PP2 hits, and success rates all updated live. Key Features: Buy/Sell signals with adaptive volatility bands Real-time TP/SL/DP levels based on ATR Built-in MA Filter with optional ATR/StdDev volatility Performance stats panel (Success, Profit/Loss, PP1/PP2) Alerts via popup, sound, push, or email Cu
メタトレンドプロ   これは、トレードにおける推測を排除し、市場が既に決定を下したポイントを示すトレンドフォローツールです。この指標は、トレンド、動向、構造が変化する重要なポイントを特定し、主要プレーヤーがポジションを取るべき価格の戻り領域を強調表示します。 単に値動きを見るだけでなく、その背後にある論理を理解できます。すべてのシグナルはローソク足が確定した後に記録され、再描画されることなくチャートに保存されるため、自信を持って状況を分析し、意思決定を行うことができます。トレード目標(利益確定)も表示されます。 この指標の有効性について完全に確信を持っていただくために、自動統計機能をご利用いただけます。 方向転換のたびに、インジケーターはストップロスレベルとそのインテリジェントな段階的移動(Move SL)も表示します。これは非常に重要です。     削減   リスク   ポジション別。 損切り/利益確定/リスクリワード 右側の内蔵パネルには、現在の世界的なトレンドの方向における市場参入ポイントが表示され、過去のデータからもこれらのシグナルが確認できます。 任意の時間枠/ツール この指
Reversion King Indicator
Eugen-alexandru Zibileanu
5 (4)
新たな王者が登場 - インジケーター + 注文管理表示(TP1 + TP2 + TP3)+ オプションのTelegramシグナル送信機能付き(無料) (完全なトレード&シグナルシステム) ゴールド向け最高のEA: Gold Slayer このインジケーターには、高度な戦略、カスタマイズ可能な注文管理システム、そしてエンベロープ拡張を組み合わせた平均回帰システムが搭載されています。さらに、RSIなど複数のインテリジェントな確認フィルターによって、高確率の反転エントリーをBUY・SELLシグナルとして検出します。 単にトレードを学ぶだけでなく、複数ポジションを効果的に管理し、過去に利益を出しているオープンポジションで損失トレードをカバーする方法も学べます。 M5向けに構築・最適化されており、流動性が高くシグナルの精度が安定しているBTCUSDとXAUUSDで優れたパフォーマンスを発揮します。 このインジケーターは、ATRを基に自動計算されたエントリー、ストップロス、テイクプロフィットレベルを備えた明確なLong・Shortシグナルを提供するため、リスク管理が最初から組み込まれています。 マ
この製品は 2026 年の市場向けに更新され、最新の MT5 ビルドに最適化されています。 価格更新のお知らせ: Atomic Analyst は現在 $99 で提供されています。 次の 30 件の購入 後、価格は $199 に上がります。 特別オファー: Atomic Analyst を購入後、私にプライベートメッセージを送ることで、 Smart Universal EA を無料 で受け取り、Atomic Analyst のシグナルを自動売買に変えることができます。 Atomic Analyst は、リペイントなし、再描画なし、遅延なしの Price Action トレーディングインジケーターで、手動取引、シグナルの明確化、EA 自動化のために設計されています。 User manual: settings, inputs and strategy. 価格行動、強さ、モメンタム、マルチタイムフレーム方向、高度なフィルターを分析し、トレーダーがノイズを減らし、弱いセットアップを避け、より構造化された取引判断を行えるようにします。 このインジケーターは、複雑な市場計算をシンプルな視覚シ
Crystal Heikin Ashi Signals - Professional Trend & Signal Detection Indicator Advanced Heikin Ashi Visualization with Intelligent Signal System for Manual & Automated Trading Final Price: $149 ---------> Price goes up $10 after every 10 sales . Limited slots available — act fast . Overview Crystal Heikin Ashi Signals is a professional-grade MetaTrader 5 indicator that combines pure Heikin Ashi candle visualization with an advanced momentum-shift detection system. Designed for both manual traders
Smart Structure Concepts MT5
Cristhian Alexander Gaibor Cuasquer
5 (1)
これは、ゾーンを描いてあなたに推測させる、もう一つの構造インジケーターではありません。 Smart Structure Concepts はあなたのために市場を読み取ります — XAUUSD(ゴールド)、外国為替、株価指数、暗号通貨、その他あらゆる市場 で Smart Money Concepts (SMC / ICT) 構造をリアルタイムでマーキングします。各ゾーンを設定するためにインプットに入る必要はもうありません: チャート上のインタラクティブなダッシュボードパネル で、ワンクリックで何を表示、非表示、調整するかを決定できます — プロパティを開く必要も、インジケーターを再起動する必要もありません。 このツールは MetaTrader 5 用の成長中のインジケーターとパネルのセットの一部です — すべて 11 言語の教育的なツールチップと、すべてのチャートに組み込まれたビジュアルメンターを備えています。 各ツールはあなたがトレードする間に教えます:任意のゾーン、シグナル、レベルにマウスを置くと、説明がチャートに直接表示されます。ブラックボックスなし、盲目的な注文なし。あなたはトレ
Meridian Pro
Ottaviano De Cicco
5 (2)
Meridian Pro 2.00:MT5向けプロ仕様マルチタイムフレーム・トレンドマトリクス Meridian Pro 2.00 は、MetaTrader 5 向けのプロ仕様の適応型トレンドマトリクスです。オリジナルの Meridian トレンドエンジン、クリーンなチャート ribbon、確定足ベースのシグナル矢印、8時間足 dashboard、Fuel momentum、weighted consensus、synthetic HTF processing、そしてチャート上に直接表示される上位足コンテキストラインを統合します。 目的はシンプルです。現在のトレンド、マルチタイムフレーム構造、強度、momentum、EA-ready 状態を、複数チャートに無関係なインジケータを重ねるのではなく、1つの整理された workflow で読むことです。 Meridian Pro の違い 1つの適応型エンジン - 同じ volatility-aware Meridian ロジックを M1 から W1 まで適用します。 Synthetic HTF architecture - 上位足行は下位足デ
Gold Stuff mt5
Vasiliy Strukov
4.9 (192)
Gold Stuff mt5 は、金専用に設計されたトレンド指標であり、あらゆる金融商品にも使用できます。 インジケーターは再描画せず、遅れません。 推奨時間枠 H1. 設定と個人的なボーナスを得るために、購入後すぐに私に連絡してください!  トレンド スキャナーの強力なサポートを利用して、無料のインジケーターを入手し、プライバシーを守ります。あーみー!   設定 矢印を描く - オンオフ。 チャートに矢印を描く。 アラート - 可聴アラートのオンオフ。 メール通知 - オンオフ。 電子メール通知。 プチ通知 - オンオフ。 プッシュ通知。 次に、色域を調整します。 Gold Stuff mt5 は、金専用に設計されたトレンド指標であり、あらゆる金融商品にも使用できます。 インジケーターは再描画せず、遅れません。 推奨時間枠 H1. 設定と個人的なボーナスを得るために、購入後すぐに私に連絡してください!   設定 矢印を描く - オンオフ。 チャートに矢印を描く。 アラート - 可聴アラートのオンオフ。 メール通知 - オンオフ。 電子メール通知。 プチ通知 - オンオ
Trend Forecaster – Since 2023. The Trend Forecaster indicator utilizes a unique proprietary algorithm to determine entry points for a breakout trading strategy. The indicator identifies price clusters, analyzes price movement near levels, and provides a signal when the price breaks through a level. The Trend Forecaster indicator is suitable for all financial assets, including currencies (Forex), metals, stocks, indices, and cryptocurrencies. You can also adjust the indicator to work on any time
トレンド スクリーナー インジケーターでトレンド取引の力を解き放ちます。ファジー ロジックと複数通貨システムを活用した究極のトレンド取引ソリューションです。 ファジー ロジックを活用した革新的なトレンド インジケーターである Trend Screener を使用して、トレンド取引を向上させます。 これは、13 を超えるプレミアム ツールと機能、および 3 つの取引戦略を組み合わせた強力なトレンド追跡インジケーターであり、Metatrader をトレンド アナライザーにする多用途の選択肢となります。 期間限定オファー : トレンド スクリーナー インジケーターは、わずか 65 ドルで生涯ご利用いただけます。 (元の価格 50$ ) (オファー延長) Trend Screener の 100% 非再描画精度の揺るぎない精度を体験して、取引の決定が過去の価格変動の影響を受けないようにしてください。 マルチタイムフレームおよびマルチ通貨機能の多用途性を解放し、比類のない自信を持って外国為替、商品、暗号通貨、インデックスの世界を取引できるようにします。 Trend Screener の包括的な戦
多くの矢印インジケーターは、シグナルだけを表示して、その後の判断をすべてトレーダーに任せてしまいます。KT Alpha Hunter Arrows は、完整なトレードプランをチャート上に提示します。 各シグナル矢印が表示されるたびに、エントリーライン、ストップロス、4つのテイクプロフィット水準、そして現在の銘柄と時間足が今トレードに値するかどうかを示すリアルタイムのエッジ判定が、すでに描画された状態で表示されます。付属の Trade Manager EA は、あなたが手動でエントリーした後の実行管理を担当し、相場が荒れて判断がぶれやすい場面でも規律あるトレードを保ちやすくします。リペイントなし。確定足シグナルのみ。Forex、ゴールド、指数、その他あなたが取引するあらゆる銘柄に対応します。 主な機能 リペイントしない買い矢印と売り矢印を、足の確定後にのみ表示。 各シグナルに、エントリーライン、構造的ストップロス、4つのテイクプロフィット水準を表示。 Edge Dashboard が、現在のチャートで買いセットアップと売りセットアップを別々に評価。 判定システム:No Edge、Mar
このダッシュボードは、選択されたシンボルの最新の利用可能なハーモニックパターンを表示するので、時間を節約し、より効率的に /   MT4バージョン 。 無料インジケーター:   Basic Harmonic Pattern インジケーター列 Symbol : 選択したシンボルが表示されます。 Trend :   強気または弱気 Pattern : パターンの種類(ガートレー、バタフライ、バット、カニ、サメ、サイファー、ABCD) Entry : エントリー価格 SL: ストップロス価格 TP1: 1回目の利食い価格 TP2: 2回目の利食い価格 TP3:   3回目の利食い価格 Current price :   現在値 Age (in bars):    最後に描画されたパターンの年齢 主な入力項目 Symbols:   "28 Major Currency Pairs "または "Selected Symbols "から選択。 Selected Symbols:   カンマで区切られた監視したいシンボル("EURUSD,GBPUSD,XAUUSD")。ブローカーがペアに接
作者のその他のプロダクト
Weis Wave with Alert
Trade The Volume Waves Single Member P.C.
4.82 (22)
Rental/Lifetime Package Options and Privileges' Rent Monthly Six Months   Yearly/Lifetime Weis Wave with Speed with Alert+Speed Index x x x Manual  x x x Quick Set up Video x x x Blog x x x Lifetime Updates x x x Setup and Training Material x x Rectangle Break Alert Tool      x Discord Access Channel "The SI traders" x   How to trade info visit:    http://www.tradethevolumewaves.com   ** If you purchase please contact me to setup your  : training Room and  complete manual access.  This is
Trend Lines MT5 with Alert
Trade The Volume Waves Single Member P.C.
Trend Lines Cross  This indicator will alert you on any cross of a Trendline. You can draw up to two trend lines and form a channel, a pennant , a triangle or a simple trend and when the price crosses either trend line the indicator  will provide you with alerts that you define plus an up or down arrow when the cross happened. How to:   Draw the 1st trendline and name it tl1.  Draw the 2nd trendline and name it tl2. Select which type of alerts you would like in the indicator properties and you a
FREE
TrendLines Cross with Alert
Trade The Volume Waves Single Member P.C.
4 (4)
Trend Lines Cross  This indicator will alert you on any cross of a Trendline. You can draw up to two trend lines and form a channel, a pennant , a triangle or a simple trend and when the price crosses either trend line the indicator  will provide you with alerts that you define plus an up or down arrow when the cross happened. How to:   Draw the 1st trendline and name it tl1.  Draw the 2nd trendline and name it tl2. Select which type of alerts you would like in the indicator properties and you a
FREE
Range Volume Hybrid Generator
Trade The Volume Waves Single Member P.C.
1. Introduction Range Volume Hybrid (RVH) is a MetaTrader 5 Expert Advisor that creates custom chart symbols using a unique dual-condition bar formation method. Unlike traditional charts where bars close based on a single criterion (time, range, or volume), RVH bars close only when BOTH a minimum price range AND a minimum volume threshold are met simultaneously.  Download also and install RVH Monito r Indicator - to control the EA from the custom charts (it's Free)  https://www.mql5.com/en/marke
My Chart Control
Trade The Volume Waves Single Member P.C.
Important: Do not download or install My Chart Control unless you already own My Chart Generator service. My Chart Control is not a standalone chart generator. It is designed to work together with the custom charts produced by My Chart Generator. Your Range/Volume chart, optimized for your indicator — automatically.   My Chart Control is the on-chart dashboard and intelligence interface for My Chart Generator. Attach it to your My Chart custom symbol chart and it gives you complete control over
FREE
Constant Volume Calculator MT4
Trade The Volume Waves Single Member P.C.
This is a free helper indicator for MT4 that will help traders setup their constant volume charts depending on their trading style. It will calculate the number of ticks that your constant volume chart should have depending on the following trading styles: Scalper Active Day trader Day trader Swing trader Position trader   Instruction video attached. Enjoy!
FREE
Constant Volume Calculator MT5
Trade The Volume Waves Single Member P.C.
This is a free helper indicator for MT5 that will help traders setup their constant volume charts depending on their trading style. It will calculate the number of ticks that your constant volume chart should have depending on the following trading styles: Scalper Active Day trader Day trader Swing trader Position trader   Instruction video attached. Enjoy!
FREE
Tick Chart Monitor
Trade The Volume Waves Single Member P.C.
DO NOT DOWNLOAD  UNLESS YOU OWN "Tick Chart - Constant Volume Generator EA" - This indicator acts as remote control of the specifc EA. The link for "Tick Chart - Constant Volume Generator EA" : https://www.mql5.com/en/market/product/171018 1. Tick Chart Monitor   1.1 What It Does The Monitor is an indicator that runs directly on the generated tick chart. It provides a graphical control panel that lets you change the EA’s style, volume, start date, or trigger a full rebuild — without touching the
FREE
RVH Monitor MT5
Trade The Volume Waves Single Member P.C.
This is an indicator to control the Parameters of Range Volume Hybrid Generator expert advisor -It does not work as stand alone, it works as a remote control of Range Volume Hybrid Generator and must be applied on the custom chart generated by the EA. To get Range Volume Hybrid Generator expert advisor:  https://www.mql5.com/en/market/product/165557 Parameters that can be adjusted: Trading Style as well as manual setting of Range, Volume and start Date of data collection. What's the video for 
FREE
No Demand No Supply
Trade The Volume Waves Single Member P.C.
4.5 (4)
This indicator identifies No Demand –No Supply candles  to your chart and plots volume bars colored according to the signal. It can be applied to all timeframes or to a specific one only. It can also be used as regular volume indicator but with exceptional future of WEIGHTED VOLUME. Furthermore is has an alert notification, sound and email when a signals occurs. The indicator does not repaint but the alert will come on two candles back due to the definition of No Demand No Supply. The VSA (Volum
Anchored VWAP with Alert
Trade The Volume Waves Single Member P.C.
5 (4)
What is the Volume Weighted Average Price (VWAP)? The volume weighted average price (VWAP) is a trading benchmark used by traders that gives the average price an instrument has traded at throughout the day, based on both volume and price.  It is important because it provides traders with insight into both the trend and value of the instrument. What is the Difference between VWAP and AVWAP? While VWAP is having as starting point the beggining of the day,week,month etc. in the AVWAP you can plac
Wave Anatomy
Trade The Volume Waves Single Member P.C.
5 (1)
Wave Anatomy Visit:   http://www.tradethevolumewaves.com   for more information Construct your own 5 Waves and analyze the price movements stages: Easy Movement Hard time to move Fast move This indicator is based on Wyckoff’s, David’s Weis and my Speed Index Theory. This indicator will you help analyze what is happening in 5 Price Waves that you can construct yourself. This tool is designed for scalpers and swing traders and will help them to analyze any wave on any timeframe at the same time.
Weis Wave with Alert MT5
Trade The Volume Waves Single Member P.C.
4.94 (17)
Rental/Lifetime Package Options and Privileges  Rent Monthly Six Months   Yearly/Lifetime Weis Wave with Speed with Alert+Speed Index x x x Manual  x x x Quick Set up Video x x x Blog x x x Lifetime Updates x x x Setup and Training Material x x Discord Access Channel "The SI traders"          x Rectangle Break Alert Tool      x How to trade with it:    http://www.tradethevolumewaves.com   ** If you purchase please contact me to setup your  : Training Room and  complete manual access.  Wei
No Demand No Supply MT5
Trade The Volume Waves Single Member P.C.
No Demand No Supply   This indicator identifies   No Demand –No Supply candles to your chart and plots volume bars colored according to the signal. It can be applied to all timeframes or to a specific one only. It can also be used as regular volume indicator  with exceptional future of WEIGHTED VOLUME. Furthermore is has an alert notification, sound and email when a signals occurs. The indicator does not repaint but the alert will come on two candles back due to the definition of No Demand No Su
Wave Anatomy MT5
Trade The Volume Waves Single Member P.C.
Wave Anatomy Visit:  http://www.trafethevolumewaves.com  for more information Construct your own 5 Waves and analyze the price movements stages: Easy Movement Hard time to move Fast move This indicator is based on Wyckoff’s, David’s Weis and my Speed Index Theory. This indicator will you help analyze what is happening in 5 Price Waves that you can construct yourself. This tool is designed for scalpers and swing traders and will help them to analyze any wave on any timeframe at the same time. Fur
Tick Chart Constant Volume Generator
Trade The Volume Waves Single Member P.C.
1. Overview   The Tick Chart Toolset is a pair of tightly coupled MQL5 files that generate and control professional Constant Volume charts inside MetaTrader 5 as custom symbols. Unlike time-based charts, each bar closes only when a target volume threshold is reached, giving you a noise-filtered, activity-proportional view of the market. Free "Tick Chart Monitor Indicator" to control the generator EA:  https://www.mql5.com/en/market/product/17104   Component Type Role Tick_Chart_Generator_AI_MT5
My Chart Generator
Trade The Volume Waves Single Member P.C.
What if your chart adapted to the market instead of the clock?   THE PROBLEM IT SOLVES   Instead of trying to find the best indicator that fits your timeframe chart, build a chart and find the most appropriate indicator.   My Chart Generator is a MetaTrader 5 background service that builds a live, fully historical custom Range/Volume chart from any symbol — Forex pairs, crypto, indices, commodities, or anything available in your MT5 terminal. Unlike time-based charts where every bar has an ident
フィルタ:
Kda001
196
Kda001 2024.05.16 08:51 
 

The indicator is great. Thank you for sharing.

Trade The Volume Waves Single Member P.C.
7274
開発者からの返信 Panagiotis Diamantopoulos 2024.05.16 08:52
Thank you for your kind words and review.
レビューに返信