Trend Screener Pro MT5

4.85

トレンド スクリーナー インジケーターでトレンド取引の力を解き放ちます。ファジー ロジックと複数通貨システムを活用した究極のトレンド取引ソリューションです。

ファジー ロジックを活用した革新的なトレンド インジケーターである Trend Screener を使用して、トレンド取引を向上させます。 これは、13 を超えるプレミアム ツールと機能、および 3 つの取引戦略を組み合わせた強力なトレンド追跡インジケーターであり、Metatrader をトレンド アナライザーにする多用途の選択肢となります。

期間限定オファー : トレンド スクリーナー インジケーターは、わずか 65 ドルで生涯ご利用いただけます。 (元の価格 50$ ) (オファー延長)

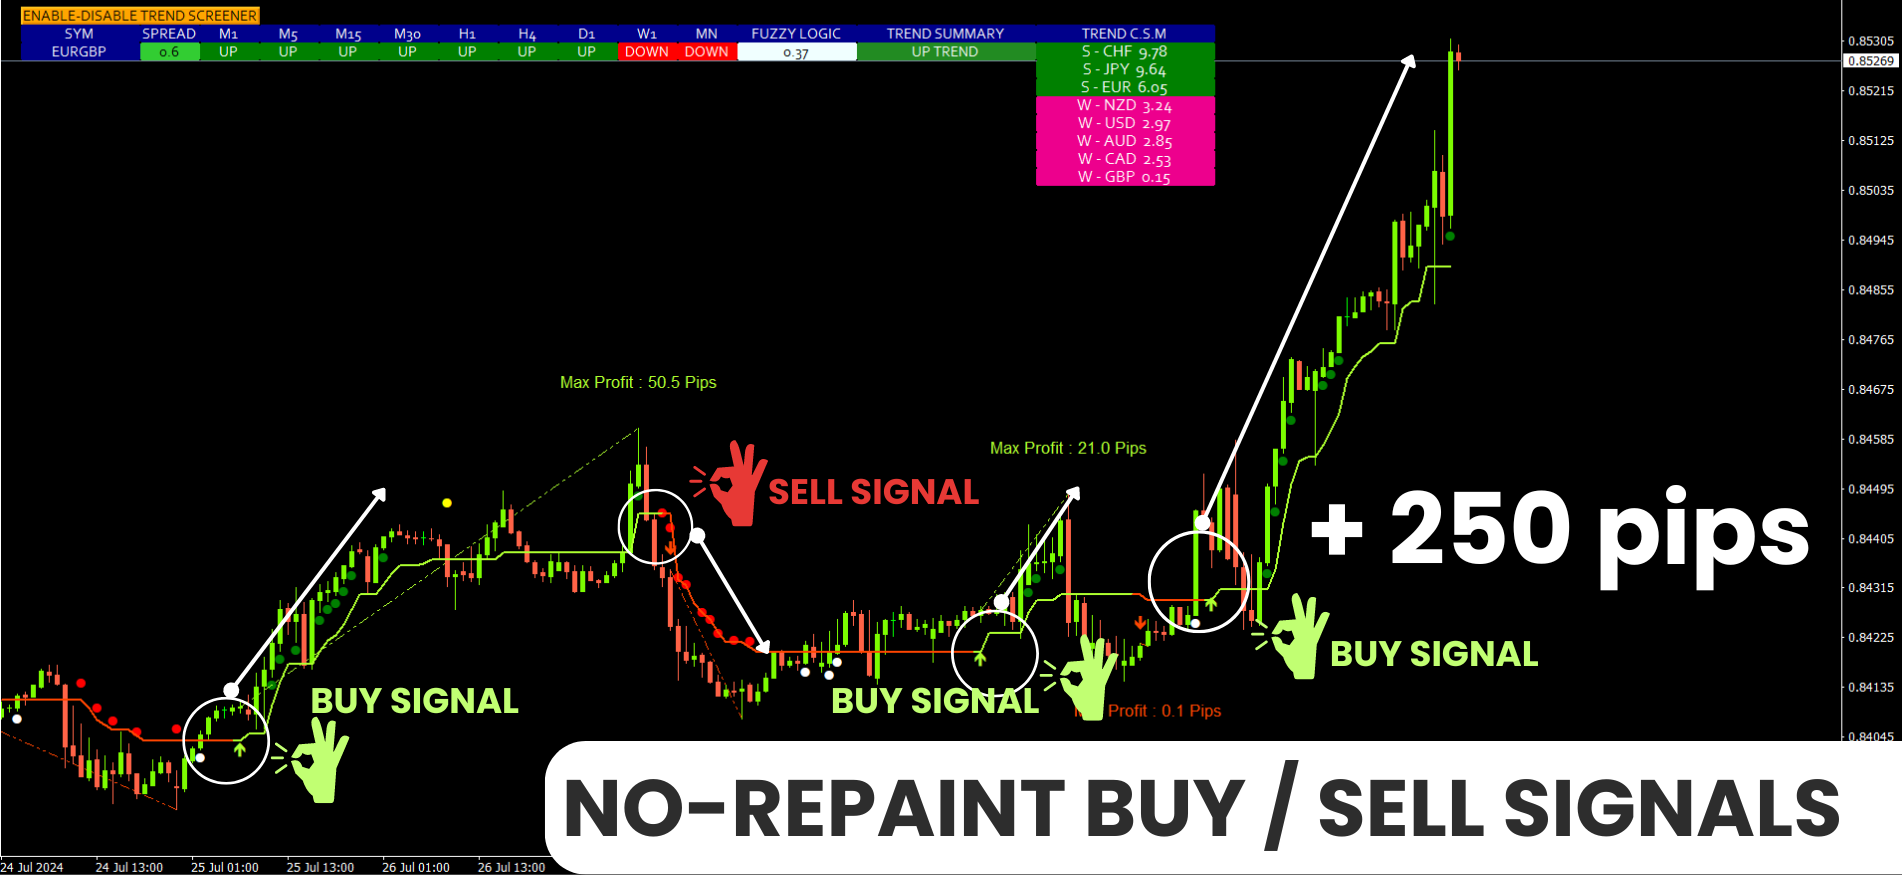
Trend Screener の 100% 非再描画精度の揺るぎない精度を体験して、取引の決定が過去の価格変動の影響を受けないようにしてください。 マルチタイムフレームおよびマルチ通貨機能の多用途性を解放し、比類のない自信を持って外国為替、商品、暗号通貨、インデックスの世界を取引できるようにします。 Trend Screener の包括的な戦略スイートで取引を強化します。


- トレンドフォロー戦略とトレンド継続戦略: トレンドスクリーナーのトレンドフォロー戦略は明確なトレンド継続シグナルを提供し、トレンドの動きを効果的に捉えてリスクを管理することができます。

- リバーサル戦略とアーリーエントリーポイント戦略: トレンドスクリーナーのリバーサル戦略は、市場の方向性の潜在的な変化を検出し、トレンドの反転を予測し、市場の弱いトレンドを利用できるようにします。アーリーエントリーポイントを使用すると、潜在的なトレンドの変化に先んじてポジションを確保でき、潜在的に 大きな利益を獲得しています。

- スキャルピング戦略: Trend Screener のスキャルピング戦略は、ペースの速いデイトレードや短期トレード向けに設計されており、1 取引日内の小さな価格変動を利用できます。
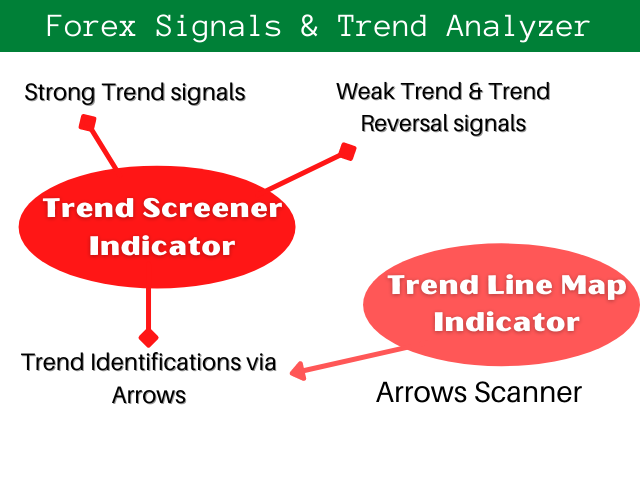

トレンドシステム

私たちのトレンドシステムは 2 つのインジケーターで構成されています。

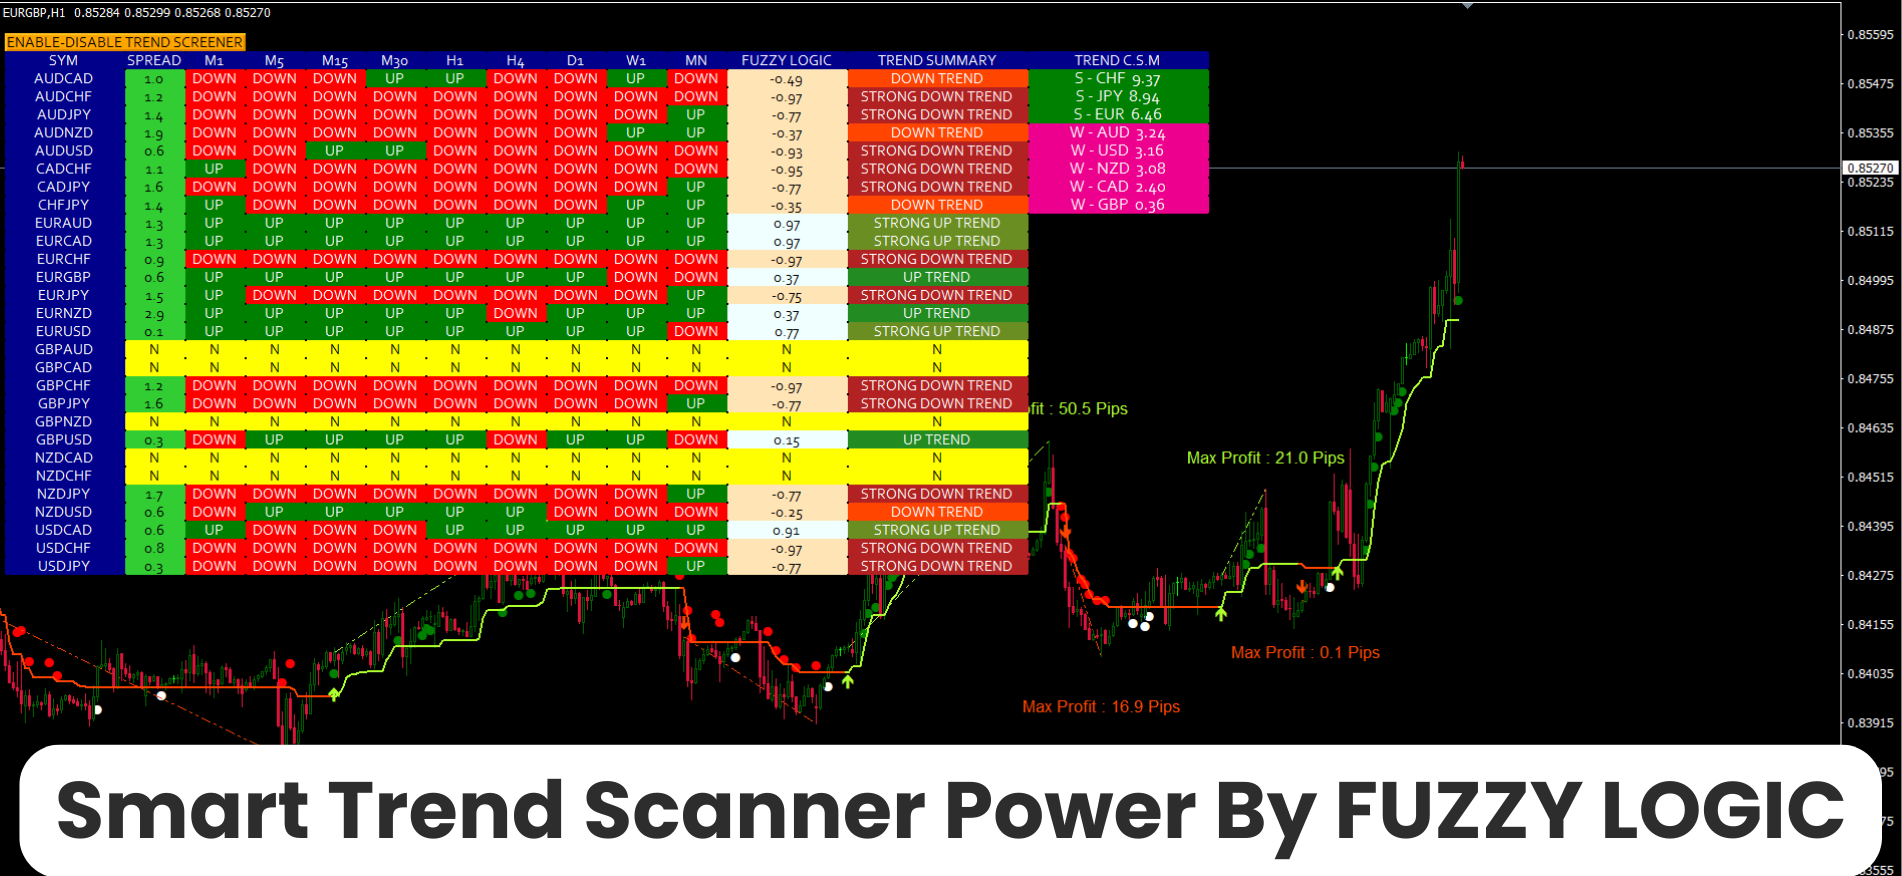
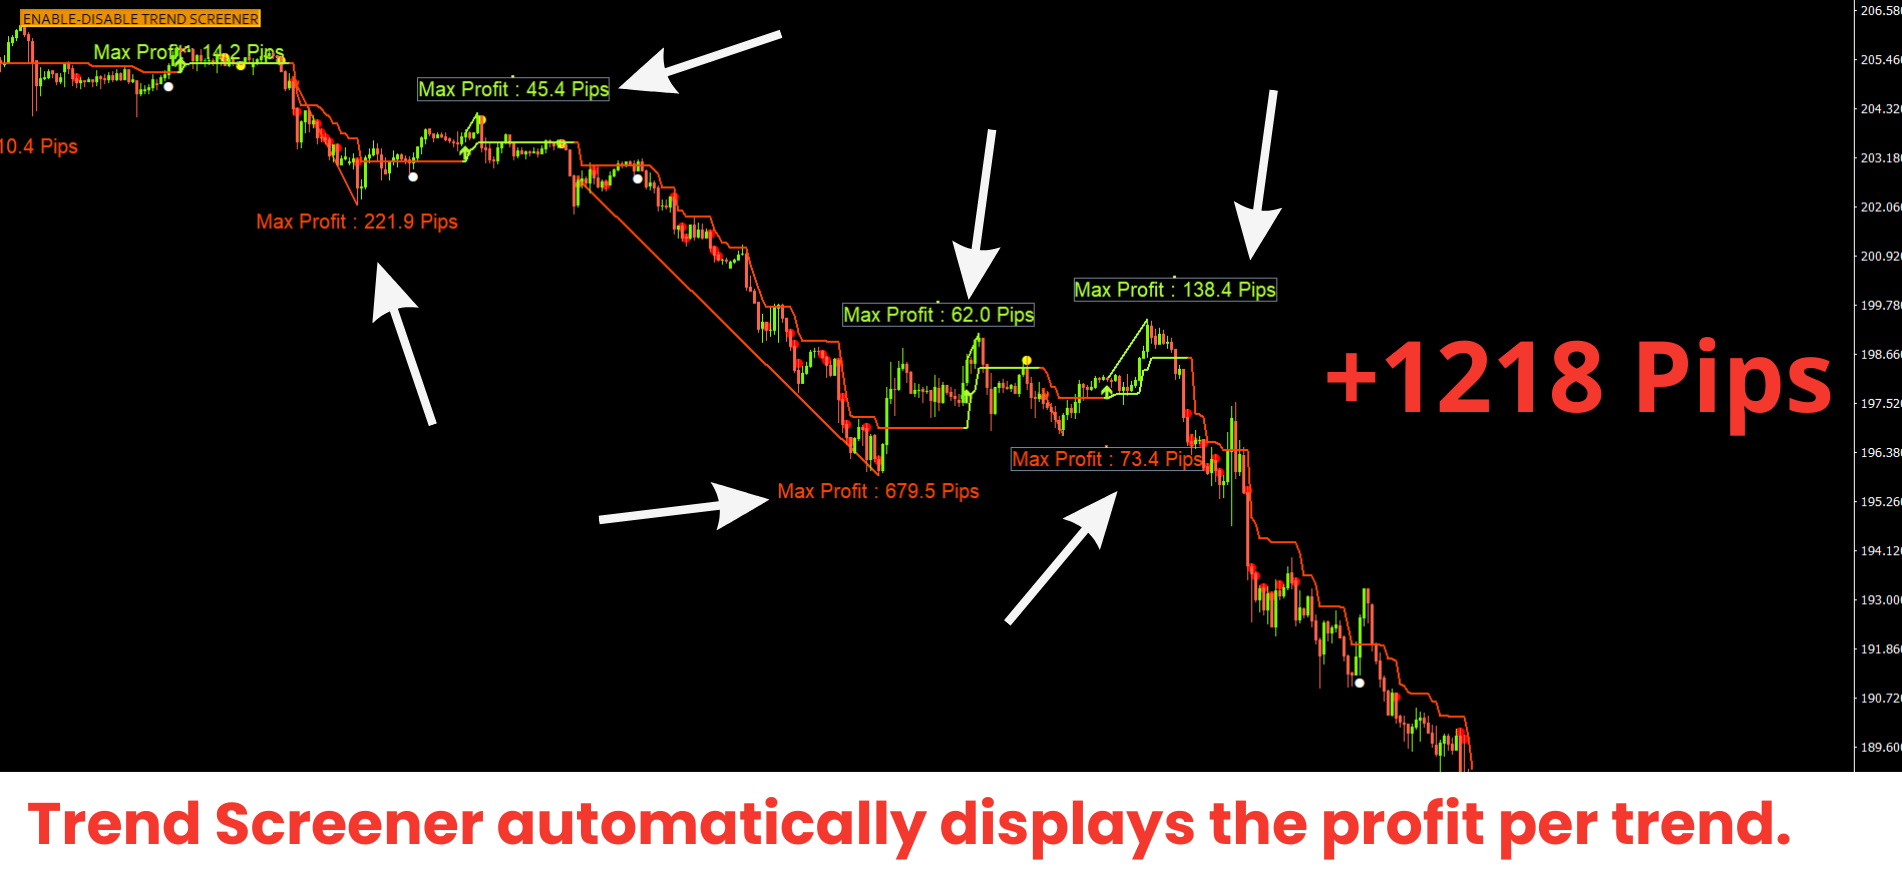
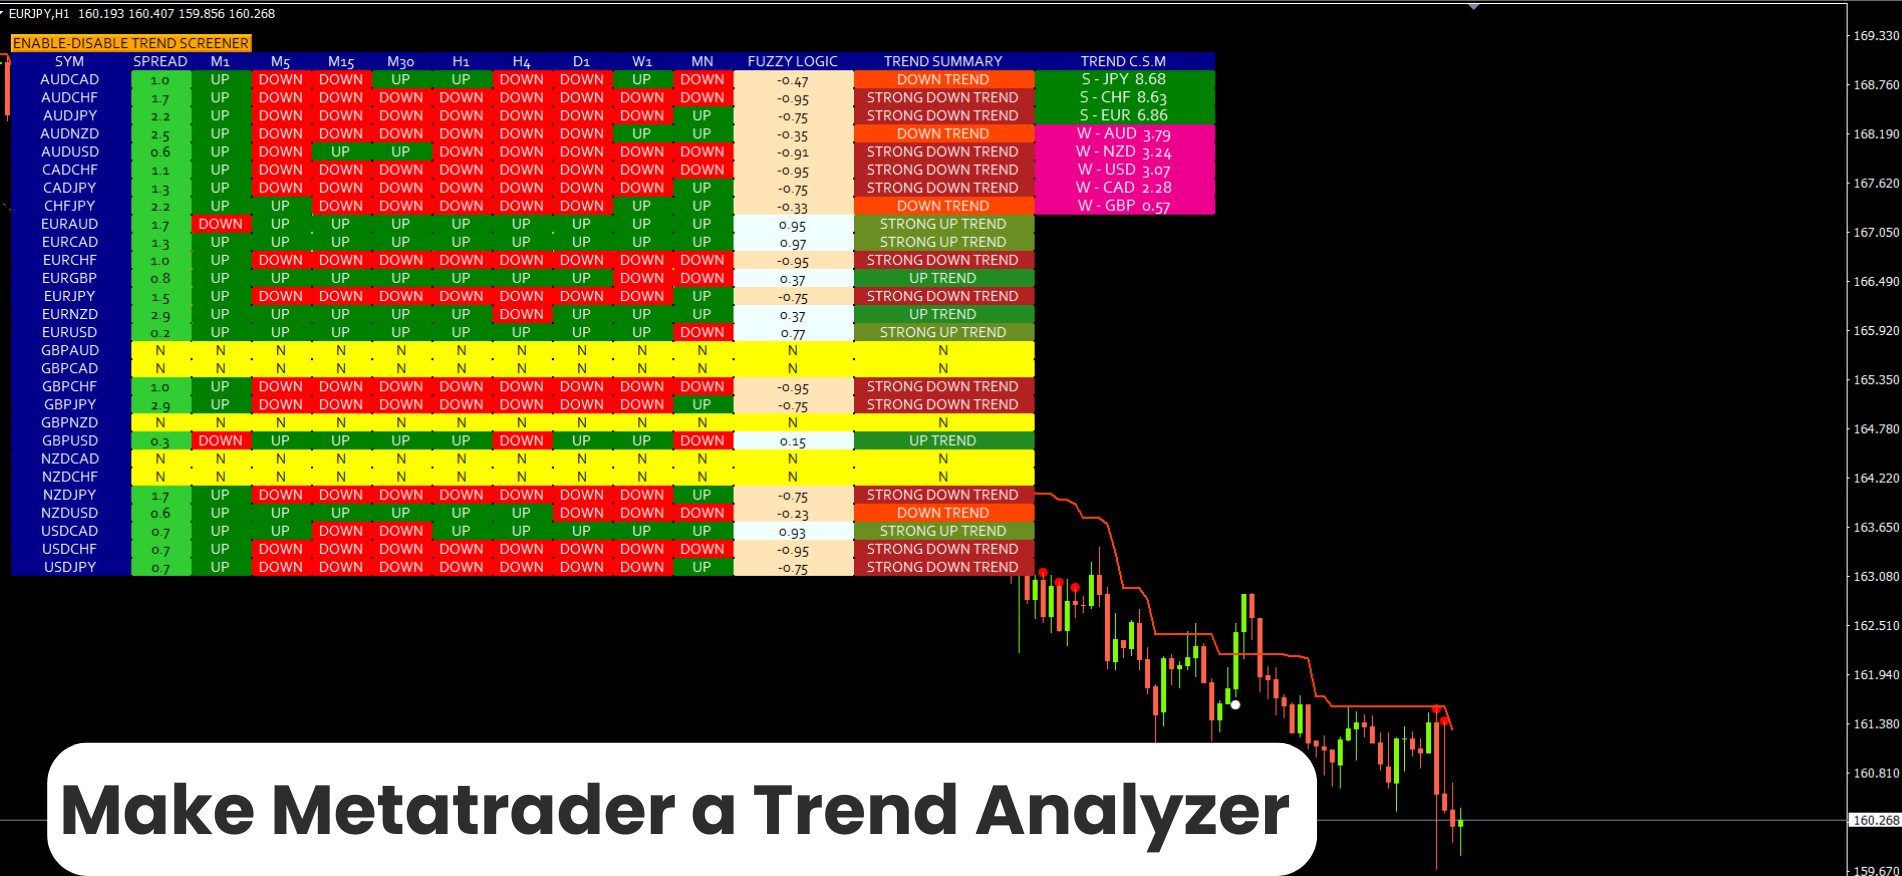
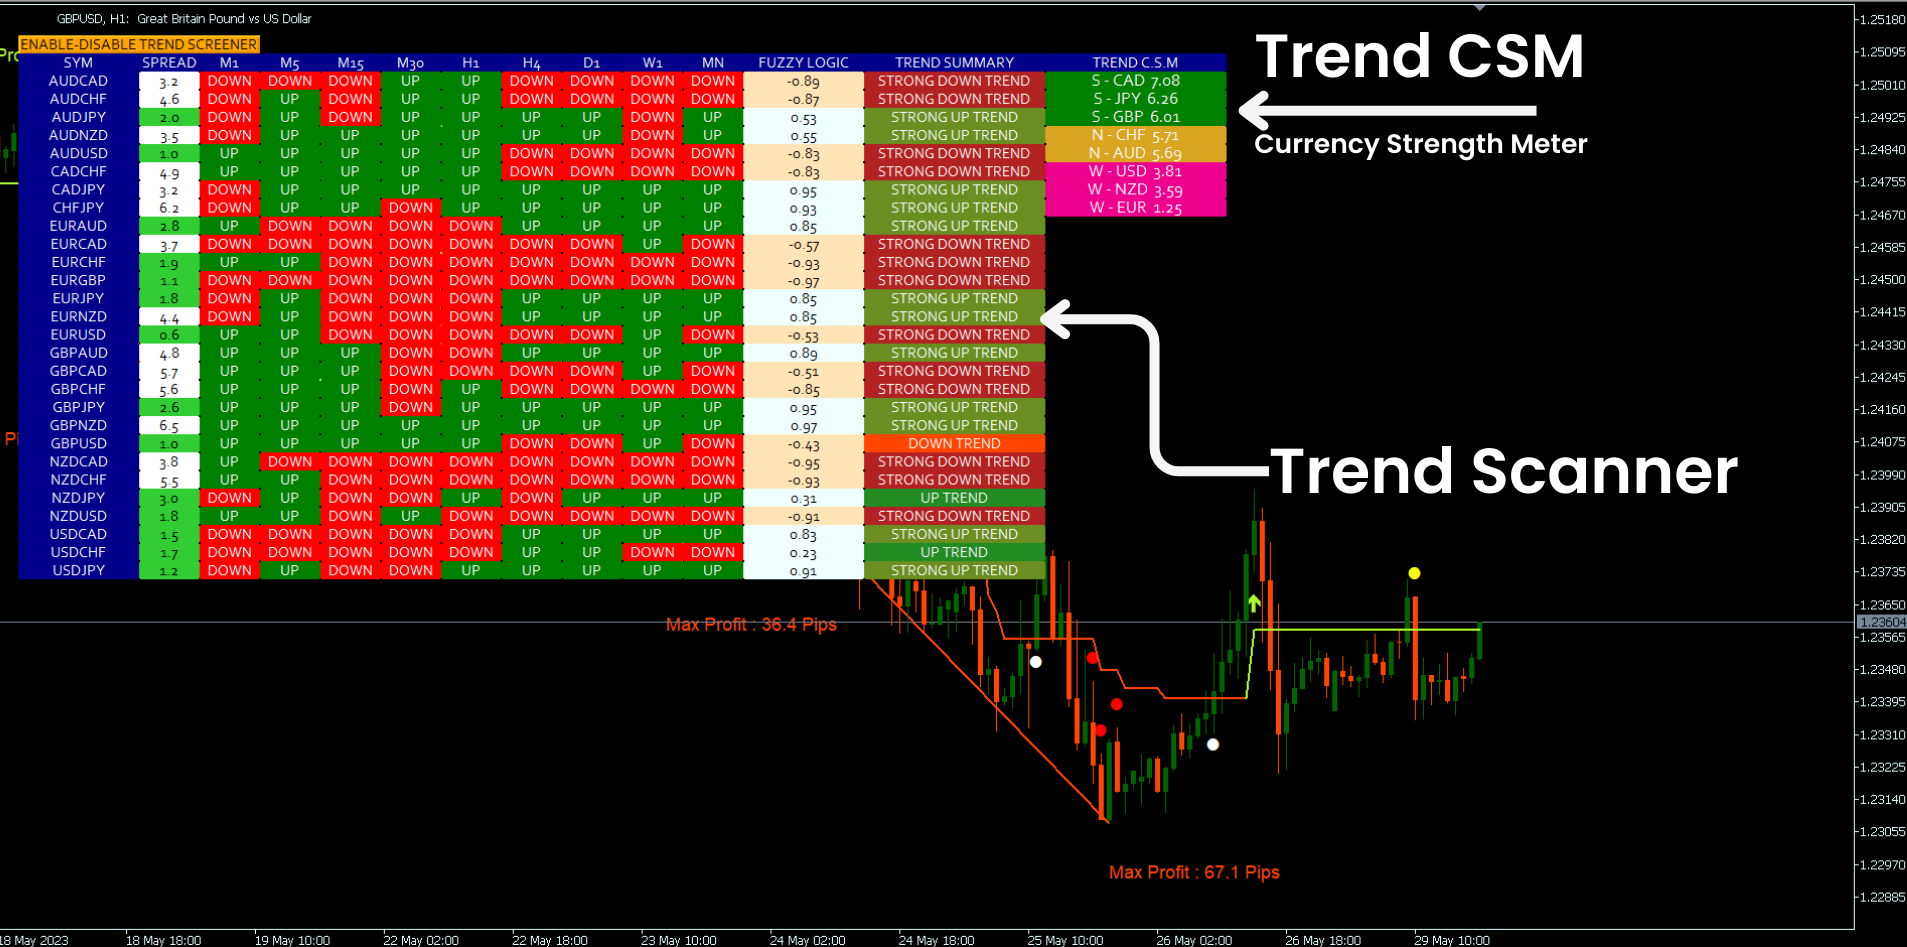
   - トレンド スクリーナー インジケーター: トレンド ダッシュボード、チャートのトレンド ライン、エントリー ポイント、およびすべての主要機能を表示します。

   - トレンドラインマップインジケーター: ダッシュボードとして売買を表示し、複数通貨のアラートを生成し、アクティブなシグナルの損益を表示します...など。
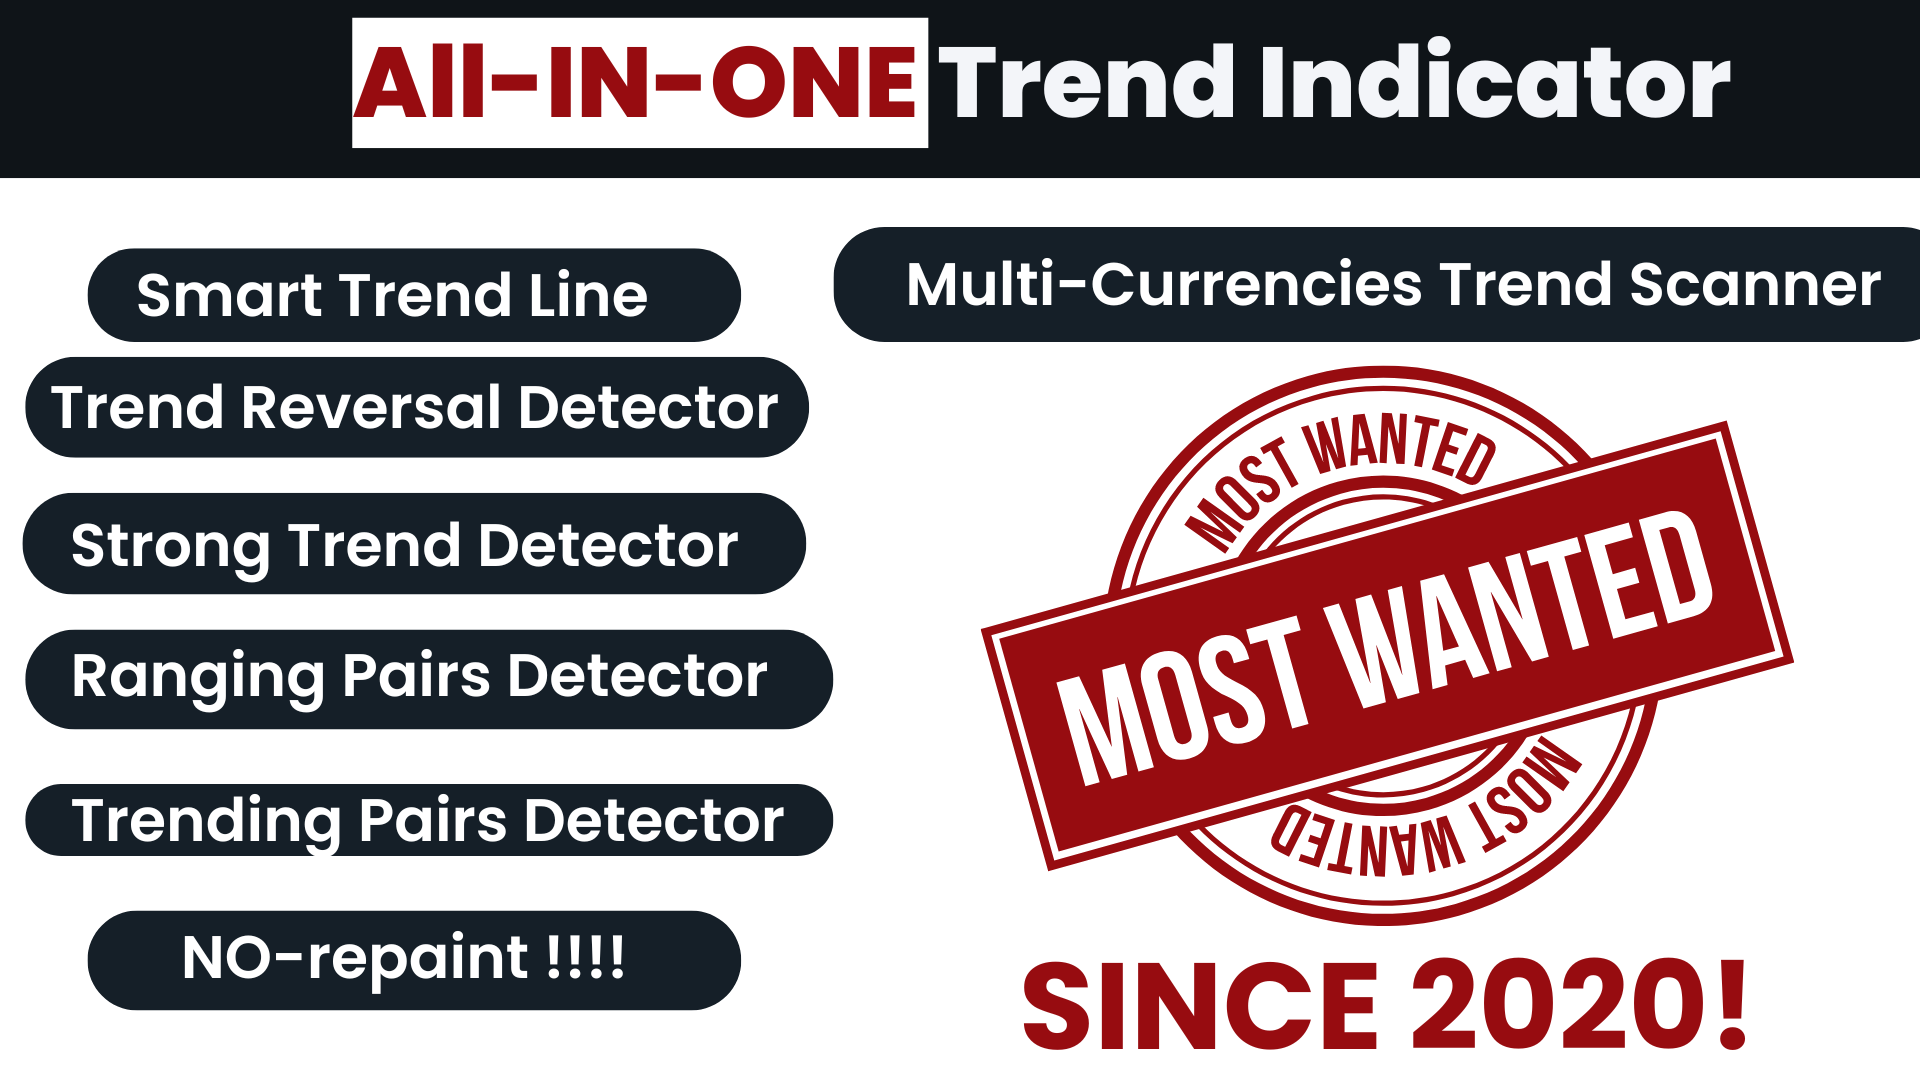
          トレンドラインマップインジケーターをダウンロード


プレミアムツールと機能

1. スマートトレンドラインツール:現在の市場状況に基づいて動的に調整されます。 これは静的な傾向線よりも洗練されており、潜在的な傾向の変化をより正確に特定するために使用できます。 動的に調整される傾向線を使用して、一般的な傾向を視覚化します。

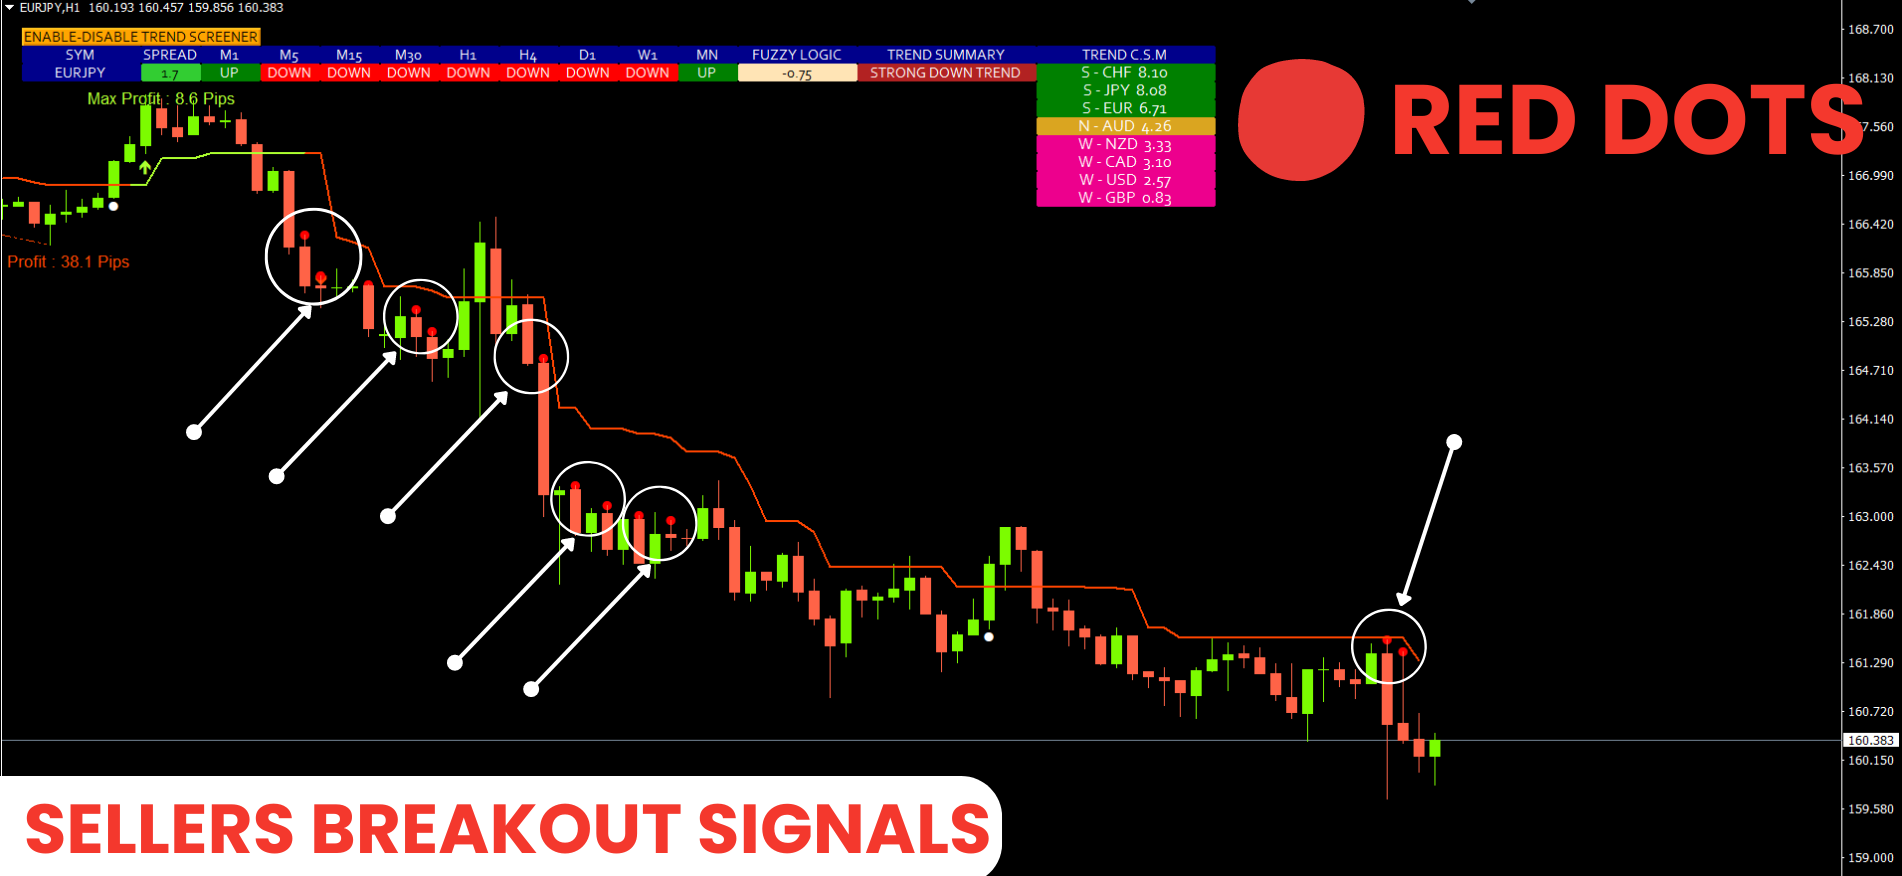
2. 反転ドットを使用したトレンド反転ツール: トレーダーが潜在的な変化を特定するのに役立つツール。 リバーサルドットは、小さなドットを使用して市場の潜在的な転換点や弱いトレンド期間を示すインジケーターの一種です。

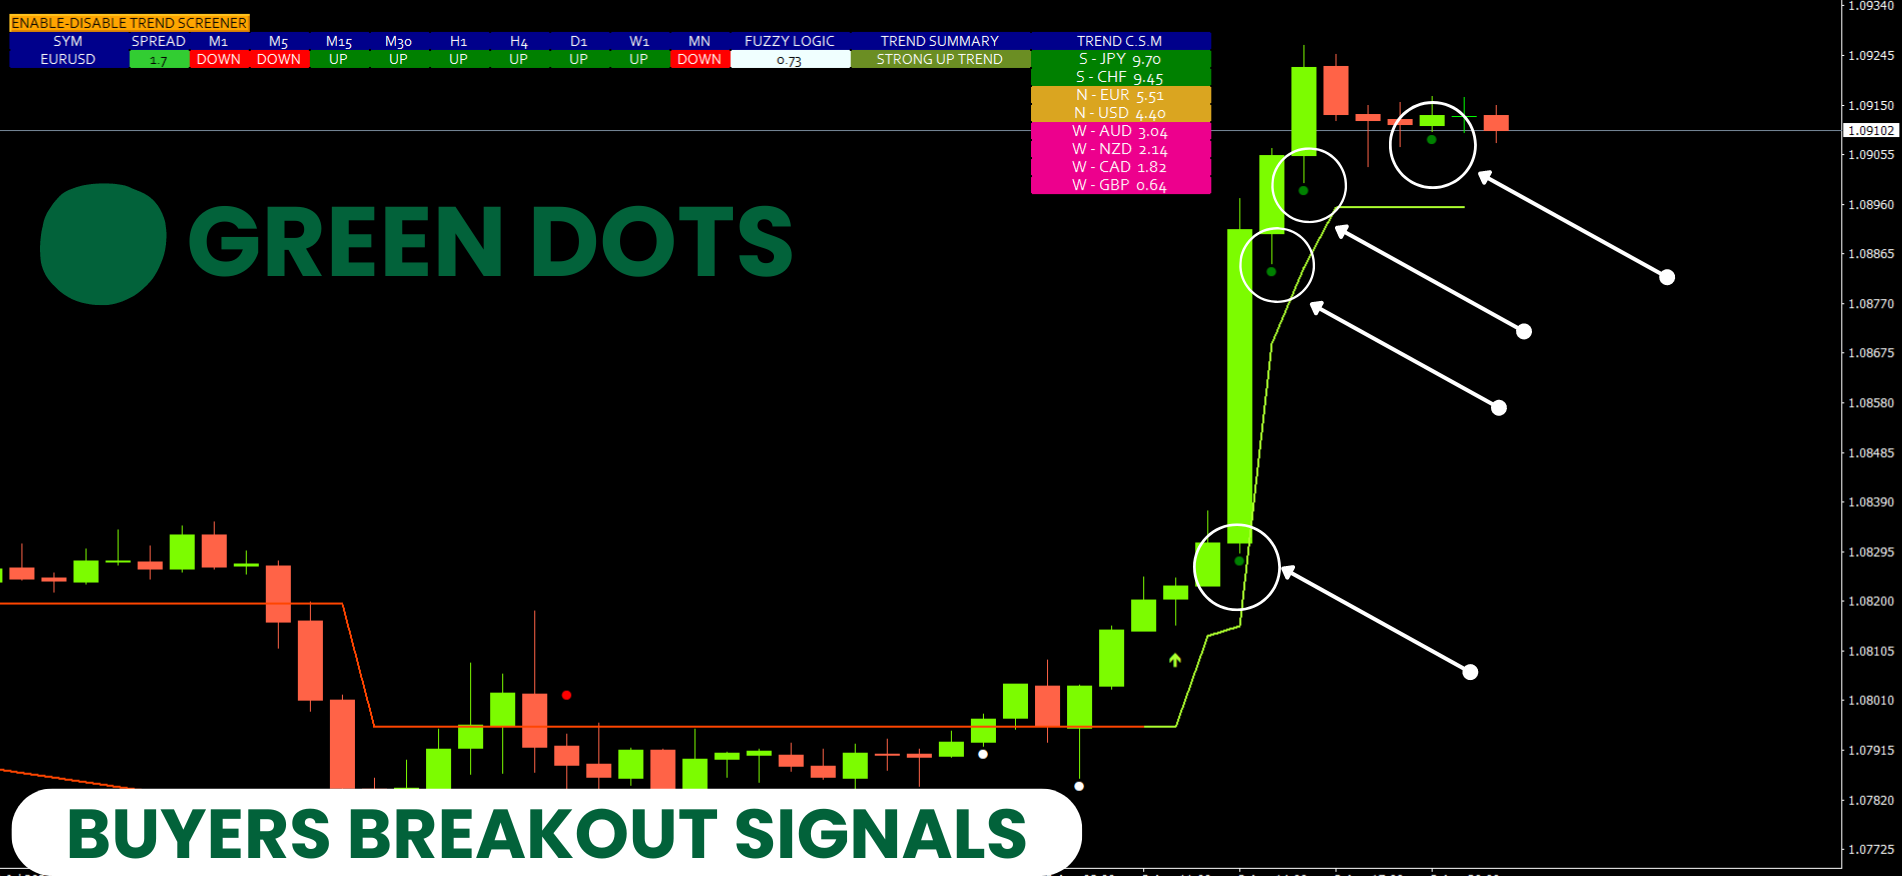
3. 強いトレンドドットを使用したトレンドモメンタムツール:トレーダーが市場の強いトレンドを特定して確認するのに役立つツール。 これは、価格変動が激しい期間を特定し、価格チャート上に点でマークすることで機能します。

4. 矢印を使用したトレンド確認ツール : トレーダーが既存のトレンドを特定し、継続していることを確認するのに役立つツールです。 価格チャート上に矢印を生成して、潜在的なトレンド継続ポイントを示すことで機能します。

5. トレンドベースの通貨強さツール : 時間の経過に伴う通貨の相対的な強さまたは弱さを測定するツール。 これは、価格変動を分析し、通貨ペアの傾向を特定することによって行われます。 次に、インジケーターは、それらのトレンドにおけるパフォーマンスに基づいて各通貨に強さの値を割り当てます。

6. Trend CSM によるレンジング ペア ファインダー: レンジング ペアの識別と Trend CSM ツールのアプリケーションを組み合わせた技術。 このアプローチは、トレーダーが統合段階にあるレンジングペアを特定するのに役立つ可能性があります。

7. Trend CSM によるトレンド ペア ファインダー: ほとんどのトレンド ペアの特定と、Trend CSM ツールのアプリケーションを組み合わせた技術。 このアプローチは、トレーダーがほとんどのトレンドペアを特定するのに役立つ可能性があります。

8. マルチタイムフレームトレンドスキャナーツール : 複数のタイムフレームにわたるトレンドを特定するツール。 これは、長期的に維持される可能性のあるトレンドを特定したいトレーダーにとって役立ちます。

9. 多通貨トレンドスキャナーツール : トレーダーが複数の通貨のトレンドを同時に特定するのに役立つツール。 通貨ペア、主要通貨、およびクロス通貨ペアの傾向を特定するために使用できます。

10. ファジー ロジック ベースの傾向の概要 : ファジー ロジックは、不正確で不確実な情報を扱う非伝統的なロジックの一種です。 それは、単なる真と偽ではなく、真実には段階があるという考えに基づいています。 そのため、不確実性やノイズが多い金融市場の傾向を分析するのに適しています。

11. チャートチェンジャーツール : スキャナーのボタンを使用してペアを切り替えるツール。

12. 多通貨スプレッドスキャナーツール : インジケータースキャナーを介してすべてのペアのスプレッドを監視するツール。

13. スマート トレンド ラインを使用した動的サポートとレジスタンスの検出: トレーダーがチャートの価格変動とトレンド ラインに基づいて短期サポートとレジスタンスを識別するのに役立つ手法。

14. カスタム TP に基づくスキャルパー シミュレーター : 以前の価格変動に基づいてカスタム テイク プロフィット (TP) レベルをシミュレートし、スキャルピングに最適な TP を特定するツール。

15. すべての市場をサポート: 外国為替、指数、金属、暗号通貨など。


ドキュメント

すべての Trend Screener ドキュメント (手順) と戦略の詳細は、MQL5 ブログのこの投稿で参照できます。ここをクリックしてください。


YouTube ビデオのチュートリアル

MQL5 ブログをチェックすると、トレンド スクリーナー インジケーターの使用方法と取引方法を説明する YouTube ビデオ チュートリアルが多数見つかります。 すべてのビデオを見つけるにはここをクリックしてください。


トレンドスクリーナーMT4バージョン

MT4 バージョンはここをクリックして入手できます。


接触

ご質問がある場合、またはサポートが必要な場合は、プライベート メッセージでご連絡ください。


著者

SAYADI ACHREF 、フィンテック ソフトウェア エンジニア、Finansya 創設者。

レビュー 125
nava91
19
nava91 2026.03.18 17:53 
 

It’s a really amazing indicator. I have been using it for the past year, and the high-timeframe signals are very accurate. The author is also very helpful—whenever I have doubts or need clarification, he responds quickly at any time.

Gary
617
Gary 2026.02.22 19:34 
 

Great indicator works very well.

الباشا الباشا
52
الباشا الباشا 2026.01.12 17:41 
 

A very excellent indicator, and there is little talk about it. It has helped me a lot. I hope the developer will add an automated trading feature or create a trading robot with the same accuracy as this indicator and add an option that allows the user to set a target with a specific number of points. Thank you.

おすすめのプロダクト
Free automatic Fibonacci is an indicator that automatically plots a Fibonacci retracement based on the number of bars you select on the BarsToScan setting in the indicator. The Fibonacci is automatically updated in real time as new highest and lowest values appears amongst the selected bars. You can select which level values to be displayed in the indicator settings. You can also select the color of the levels thus enabling the trader to be able to attach the indicator several times with differe
FREE
概要 このインジケーターは、クラシックな ドンチャンチャネル を強化したバージョンで、実践的なトレード機能を追加しています。 標準の3本線(上限、下限、中央線)に加え、 ブレイクアウト を検出し、チャート上に矢印で視覚的に表示します。また、チャートを見やすくするために、 現在のトレンド方向と逆側のラインのみを表示 します。 インジケーターの機能: 視覚的シグナル :ブレイクアウト時にカラフルな矢印を表示 自動通知 :ポップアップ、プッシュ通知、Eメール RSIフィルター :市場の相対的な強弱に基づいてシグナルを検証 カスタマイズ可能 :色、ラインの太さ、矢印コード、RSI閾値など 動作原理 ドンチャンチャネルは次のように計算します: 上限線 :直近N本のクローズ済みローソク足の最高値 下限線 :直近N本のクローズ済みローソク足の最安値 中央線 :最高値と最安値の平均値 上方ブレイクアウト は終値が上限線を超えたときに発生し、 下方ブレイクアウト は終値が下限線を下回ったときに発生します。 インジケーターは以下を行います: 3本のドンチャンラインを描画 方向転換後の最初のブレイクアウト
FREE
FlatBreakout MT5 (Free Version) Flat Range Detector and Breakout Panel for MT5 — GBPUSD Only FlatBreakout MT5   is the free version of the professional FlatBreakoutPro MT5 indicator, specially designed for flat (range) detection and breakout signals on the   GBPUSD   pair only. Perfect for traders who want to experience the unique fractal logic of FlatBreakout MT5 and test breakout signals on a live market without limitations. Who Is This Product For? For traders who prefer to trade breakout of
FREE
ピボットポイントフィボRSJは、フィボナッチレートを使用してその日のサポートラインとレジスタンスラインを追跡するインジケーターです。 この壮大な指標は、フィボナッチレートを使用してピボットポイントを通じて最大7レベルのサポートとレジスタンスを作成します。 価格がこのサポートとレジスタンスの各レベルを尊重する方法は素晴らしいです。そこでは、オペレーションの可能な入口/出口ポイントを認識することができます。 特徴 最大7レベルのサポートと7レベルの抵抗 レベルの色を個別に設定します 入力 ピボットタイプ ピボットフィボRSJ1 =フィボ比1の計算 ピボットフィボRSJ2 =フィボ比2の計算 ピボットフィボRSJ3 =フィボ比3の計算 ピボットフィボクラシック=クラシックピボット計算 最小ピボットレベル ピボット3レベル ピボット4レベル ピボット5レベル ピボット6レベル ピボット7レベル それでも質問がある場合は、ダイレクトメッセージで私に連絡してください: https://www.mql5.com/ja/users/robsjunqueira/
FREE
Hunter’s Scope: ボラティリティおよびトレンド強度インジケーター (MT5) Hunter’s Scopeは、方向性の強さとボラティリティの両方をフィルタリングすることで価格拡大を特定する、MetaTrader 5用の高モメンタムインジケーターです。重要なインパルス(衝動)的なローソク足を検出し、モメンタムトレードのための明確かつ客観的なシグナルを提供します。 コアロジック:二層フィルター 遅行性のクロスオーバーではなく、以下の二段階確認モデルを使用します: トレンド強度 (ADX): ADXがユーザー定義のしきい値を超えた場合のみシグナルが発生し、レンジ相場や低モメンタム市場を除外します。 ボラティリティ拡大 (ATR): 特定のATR倍率を超えたローソク足のみをインパルスと見なし、統計的に有意な動きであることを保証します。 主な特徴 非再描画: ローソク足確定時にシグナルが生成され、固定されます。 モメンタム重視: 反応遅延型のインジケーターではなく、インパルス的な動きを狙います。 統合診断パネル: ADX、ATRしきい値、ローソク足サイズをリアルタイムで表示。 クリ
CosmiCLab SMC FIBO CosmiCLab SMC FIBO is a professional trading indicator designed for traders who use Smart Money Concepts (SMC), market structure analysis and Fibonacci retracement levels. The indicator automatically detects market swings and builds Fibonacci levels based on the latest impulse movement. It also identifies market structure changes such as BOS (Break of Structure) and CHOCH (Change of Character), helping traders understand the current market direction. CosmiCLab SMC FIBO also pr
High Low Open Close
Alexandre Borela
4.98 (44)
このプロジェクトが好きなら、5つ星レビューを残してください。 このインジケータは、指定されたためのオープン、ハイ、ロー、クローズ価格を描画します 特定のタイムゾーンの期間と調整が可能です。 これらは、多くの機関や専門家によって見られた重要なレベルです トレーダーは、彼らがより多くのかもしれない場所を知るために有用であり、 アクティブ。 利用可能な期間は次のとおりです。 前の日。 前週。 前の月。 前の四半期。 前年。 または: 現在の日。 現在の週。 現在の月。 現在の四半期。 現年。
FREE
Main purpose:   "Pin Bars"   is designed to automatically detect pin bars on financial market charts. A pin bar is a candle with a characteristic body and a long tail, which can signal a trend reversal or correction. How it works:   The indicator analyzes each candle on the chart, determining the size of the body, tail and nose of the candle. When a pin bar corresponding to predefined parameters is detected, the indicator marks it on the chart with an up or down arrow, depending on the directi
FREE
Are you tired of drawing trendlines every time you're analyzing charts? Or perhaps you would like more consistency in your technical analysis. Then this is for you. This indicator will draw trend lines automatically when dropped on a chart. How it works Works similar to standard deviation channel found on mt4 and mt5. It has 2 parameters: 1. Starting Bar 2. Number of bars for calculation The   starting bar   is the bar which drawing of the trend lines will begin, while the   number of bars for c
FREE
FX Clock
Abderrahmane Benali
FXClock – Professional Clock Indicator for Traders Please leave a 5 star rating if you like this free tool! Thank you so much :) The FXClock indicator is a practical and simple tool that displays time directly on your trading platform, allowing you to track multiple key pieces of information at the same time. It is specially designed to help traders synchronize their trading with market hours and global sessions. Key Features: Displays the broker server time with precision. Displays your local c
FREE
The Penta-O is a 6-point retracement harmonacci pattern which usually precedes big market movements. Penta-O patterns can expand and repaint quite a bit. To make things easier this indicator implements a twist: it waits for a donchian breakout in the right direction before signaling the trade. The end result is an otherwise repainting indicator with a very reliable trading signal. The donchian breakout period is entered as an input. [ Installation Guide | Update Guide | Troubleshooting | FAQ | A
FREE
PROMETHEUS TECHNICAN VERSION Free | By THE SONS A gift from The Sons — no strings, no trial, no expiry. Every trader deserves access to professional-grade market intelligence. That belief is why Prometheus Technical Version exists, and why it costs nothing. Consider it our handshake to the trading community. What You're Getting This is not a simplified tool dressed up as a gift. Prometheus Technican Version is a fully built, institutional-quality technical analysis indicator running a dual-model
FREE
Easy Correlations Indicator The Easy Correlations Indicator is designed to help traders analyze the relationship between two correlated instruments. By monitoring the distance between their Relative Strength Index (RSI) values, the indicator highlights situations where one instrument has moved significantly further than the other. This creates potential trading opportunities: Sell the stronger instrument (overstretched RSI) Buy the weaker instrument (lagging RSI) Because the positions are opened
FREE
Statistical Arbitrage Spread Generator for Cointegration [MT5] What is Pair Trading? Pair trading is a market-neutral strategy that looks to exploit the relative price movement between two correlated assets — instead of betting on the direction of the market. The idea? When two assets that usually move together diverge beyond a statistically significant threshold, one is likely mispriced. You sell the expensive one, buy the cheap one , and profit when they converge again. It’s a statistica
FREE
MT4 Version Most indicators draw lines. This one draws the battlefield. If you ever bought an EA or indicator based on a perfect equity curve — and then watched it bleed out live — you’re not alone. The problem? Static logic in a dynamic market. Fibonacci Bollinger Bands   adapts. It combines Bollinger structure with customizable Fibonacci levels to mark   zones of control   — where price reacts, pauses, or reverses. No magic. Just logic that follows volatility. Why this tool matters   It
FREE
「Haven Key Levels PDH PDL」   インジケーターは、トレーダーがチャート上の主要なレベルを視覚化するのに役立ちます。次のレベルを自動的にマークします: DO (Daily Open)   — 日足の始値。 NYM (New York Midnight)   — ニューヨーク時間の深夜0時のレベル。 PDH (Previous Day High)   — 前日の高値。 PDL (Previous Day Low)   — 前日の安値。 WO (Weekly Open)   — 週足の始値。 MO (Monthly Open)   — 月足の始値。 PWH (Previous Week High)   — 前週の高値。 PWL (Previous Week Low)   — 前週の安値。 CMH (Current Month High)   — 当月の高値。 CML (Current Month Low)   — 当月の安値。 PMH (Previous Month High)   — 前月の高値。 PML (Previous Month Low)   — 前月の
FREE
DF Fib Trader Pro DF Fib Trader Proは、MetaTrader 5向けに設計された自動取引システムです。 フィボナッチベースの価格水準とトレンドおよびストラクチャー分析を組み合わせ、エントリーポイントとエグジットポイントを決定します。このEAはロングポジションとショートポジションの両方をサポートし、リスク管理パラメータも組み込まれています。 主な機能: • フィボナッチ・リトレースメントとエクステンション・ロジックを用いて、エントリーポイント、SLポイント、TPポイントをプロットします。 • ロットサイズと損切り/利益確定レベルを設定可能 • エントリーポイントは1つまたは2つから選択可能 • 市場状況に応じて、固定または動的な損切り/利益確定をサポート • 複数の時間枠と通貨ペアに対応 • 最大スプレッド、スリッページ、取引頻度の制御オプションを搭載 • 自動取引管理:損益分岐点、トレーリングストップ、部分決済オプション • 希望に応じて成行注文もサポート入力項目の概要: • リスク管理:ロットサイズ、取引ごとのリスク、最大取引回数 • エントリー
FREE
Fvg Edge
Ahmad Meftah Abdulsalam Alawwami
5 (2)
FVG Smart Zones – 無料版 MetaTrader 5 (MT5)用 公正価値ギャップ(FVG)検出インジケーター ただのランダムなインジケーターではなく、 本格的なトレーディングツール をお探しですか? FVG Smart Zones – 無料版 は、公正価値ギャップ(FVG)を自動で検出し、チャート上に 高確率トレーディングゾーン をハイライトして、プロフェッショナルな市場の洞察を提供します。 以下のトレーダー向けに設計されています: スマートマネーコンセプト (SMC) ICTトレーディングコンセプト プライスアクション (Price Action) 需給分析 (Supply & Demand) 機関投資家向けトレーディング戦略 このインジケーターは、 価格が反応しやすいゾーン に集中するのを助けます。 主な機能 スマートゾーン検出 上昇・下降FVGの自動検出 クリーンでプロフェッショナルなビジュアルゾーン 弱い、または関連性の低いギャップを除去するインテリジェントフィルター 高度な確認機能 上位時間軸(HTF)
FREE
This is a buyer and seller aggression indicator that analyzes the shape of each candle and project this data in a histogram form. There are 4 histograms in one. On the front we have two: Upper - Buyer force. Lower - Seller force. At the background we also have two histogram, both with same color. They measure the combined strenght of buyers and sellers. This histograms can be turned off in Input Parameters. It is also possible to have the real or tick volume to help on this force measurement. IN
FREE
Market Profile 3 ForexArby com
Hussien Abdeltwab Hussien Ryad
4 (15)
Market Profile 3 MetaTrader 5 indicator  version 4.70— is a classic Market Profile implementation that can show the price density over time, outlining the most important price levels, value area, and control value of a given trading session. This indicator can be attached to timeframes between M1 and D1 and will show the Market Profile for daily, weekly, monthly, or even intraday sessions. Lower timeframes offer higher precision. Higher timeframes are recommended for better visibility. It is als
FREE
RRtoolbox - Professional Tools: Risk:Reward Trading Tool (SL/TP Horizontals + Pending orders + Diagonals), Alerts set on trend lines (for alerts on diagonal levels), SelfManagement (BE, partials...), close/cancelling by time, Statistics, Info and trading on chart. One-Click Trading with Visual Risk:Reward Management RRtoolbox is a comprehensive trading panel that combines one-click order execution,  statistics and  powerful visual Risk:Reward tools, alerts set with trendlines, on chart butt
Enhanced Volume Profile: The Ultimate Order Flow & Liquidity Analysis Tool Overview Enhanced Volume Profile is an indicator for MetaTrader 5 that displays the traded volume at specific price levels over a defined period. It separates the total volume into buy and sell components, presenting them as a side-by-side histogram on the chart. This allows users to observe the volume distribution and the proportion of buy and sell volumes at each price level. Graphics Rendering The indicator uses the
FREE
MACD Enhanced
Nikita Berdnikov
5 (3)
Introducing the MACD  Enhanced – an advanced MACD (Moving Average Convergence Divergence) indicator that provides traders with extended capabilities for trend and momentum analysis in financial markets. The indicator uses the difference between the fast and slow exponential moving averages to determine momentum, direction, and strength of the trend, creating clear visual signals for potential entry and exit points. Attention! To achieve the best results, it is recommended to adapt the indicator
FREE
インジケーター技術仕様 – Delta Profile for MetaTrader 5 Delta Profile は MetaTrader 5 用に開発されたインジケーターで、指定されたローソク足範囲内の出来高フローを詳細に分析するためのものです。異なる価格レベルにおける正の出来高(上昇に関連)と負の出来高(下降に関連)の不均衡を構造化し、可視化します。その結果、ユーザーは最も多くの取引が集中する価格帯や実際の市場不均衡が形成される領域を明確に把握できます。 以下に、本インジケーターの主要な技術特性と設定パラメータを示します。 基本コンセプト インジケーターは 価格レベル を識別し、それらを正の出来高、負の出来高、および純 Delta(正負の出来高差)に分類します。 各価格レベルは 水平バー としてチャートに表示され、市場の活動ゾーンや不均衡領域を視覚的に確認できます。 ユーザーは 分析対象ローソク足数 、 価格の丸め精度 、 最大表示レベル数 、および 表示スタイル を自由に設定できます。 主要機能 価格レベルのマッピング :設定された精度に基づき価格を丸め、対応するローソク足の
マルチタイムフレーム対応、カスタマイズ可能なビジュアルシグナル、設定可能なアラートシステムを備えたAverage True Range(ATR)インジケーター。 フリーランスプログラミングサービス、アップデート、その他のTrueTL製品は私の MQL5プロフィール でご覧いただけます。 フィードバックとレビューを大変お待ちしております! ATRとは? Average True Range(ATR)は、J. Welles Wilderが開発した市場のボラティリティを測定するテクニカルインジケーターです。指定した期間のTrue Rangeの平均を計算します。True Rangeは以下の中で最大の値です:現在の高値から現在の安値までの距離、前回の終値から現在の高値までの距離、または前回の終値から現在の安値までの距離。 ATRは価格方向を示しません — ボラティリティのみを測定します。ATRが上昇するとボラティリティの増加を示し、ATRが低下するとボラティリティの減少を示します。トレーダーはATRを使用して市場状況を評価し、動的なストップロスを設定し(例:ATRベースのトレーリングストッ
FREE
Value Chart Candlesticks
Flavio Javier Jarabeck
4.57 (14)
The idea of a Value Chart indicator was presented in the very good book I read back in 2020 , " Dynamic Trading Indicators: Winning with Value Charts and Price Action Profile ", from the authors Mark Helweg and David Stendahl. The idea is simple and the result is pure genius: Present candlestick Price analysis in a detrended way! HOW TO READ THIS INDICATOR Look for Overbought and Oversold levels. Of course, you will need to test the settings a lot to find the "correct" one for your approach. It
FREE
Friend of the Trend: Your Trend Tracker Master the market with Friend of the Trend , the indicator that simplifies trend analysis and helps you identify the best moments to buy, sell, or wait. With an intuitive and visually striking design, Friend of the Trend analyzes price movements and delivers signals through a colorful histogram: Green Bars : Signal an uptrend, indicating buying opportunities. Red Bars : Alert to a downtrend, suggesting potential selling points. Orange Bars : Represent cons
FREE
Important Lines
Terence Gronowski
4.88 (24)
This indicator displays Pivot-Lines, preday high and low, preday close and the minimum and maximum of the previous hour. You just have to put this single indicator to the chart to have all these important lines, no need to setup many single indicators. Why certain lines are important Preday high and low : These are watched by traders who trade in a daily chart. Very often, if price climbs over or falls under a preday low/high there is an acceleration in buying/selling. It is a breakout out of a
FREE
The Mirror Chart MT5 is a overlay indicator specifically designed to project a second financial instrument directly onto the main chart window. This tool is invaluable for traders who rely on correlation analysis, as it visualizes the price movements of two different instruments in real time. Unlike traditional overlays, this indicator utilizes intelligent, dynamic centering and scaling logic. It continuously analyzes the visible price range in the current window for both symbols and calculates
FREE
Fair Value Gap Volume Profile Pro This indicator detects price imbalances (Fair Value Gaps) on the chart and displays the volume distribution inside each gap using data from a lower timeframe. It is designed for traders who use institutional price action concepts and want to understand where volume was concentrated during the formation of each gap. What is a Fair Value Gap A Fair Value Gap (FVG) is a three-candle price imbalance where a candle moves so strongly that it leaves a range untouched
このプロダクトを購入した人は以下も購入しています
ARIPoint is a powerful trading companion designed to generate high-probability entry signals with dynamic TP/SL/DP levels based on volatility. Built-in performance tracking shows win/loss stats, PP1/PP2 hits, and success rates all updated live. Key Features: Buy/Sell signals with adaptive volatility bands Real-time TP/SL/DP levels based on ATR Built-in MA Filter with optional ATR/StdDev volatility Performance stats panel (Success, Profit/Loss, PP1/PP2) Alerts via popup, sound, push, or email Cu
SuperScalp Pro
Van Minh Nguyen
4.63 (24)
SuperScalp Pro – 高度なマルチフィルタースキャルピングインジケーターシステム SuperScalp Pro は、クラシックな Supertrend と複数のインテリジェント確認フィルターを組み合わせた高度なスキャルピングインジケーターです。M1 から H4 まで複数の時間足で効率的に動作し、XAUUSD、BTCUSD、主要 Forex 通貨ペア向けに最適化されています。 このインジケーターは明確な Buy / Sell シグナルを提供し、ATR に基づいてエントリー価格、Stop Loss、Take Profit を自動計算します。Fibonacci Take Profit 機能により、重要な価格帯で早期決済し、到達時に通知を送信します。 初期設定では Fibonacci Take Profit が有効化されており、より安定した取引体験を重視しています。チャートに適用するだけですぐ利用可能です。上級者向けに、すべてのパラメータは自由にカスタマイズできます。 EMA、RSI、ADX、Volume、VWAP、Bollinger Bands、MACD Divergence な
Entry In The Zone and SMC Multi Timeframe is a real-time 2-in-1 market analysis tool that combines market structure analysis and a No Repaint BUY / SELL signal system into a single indicator, built on Smart Money Concepts (SMC) — a widely adopted framework used by professional traders to understand market structure. This indicator helps you see the market more clearly, make decisions based on structure rather than guesswork, and focus on high-probability zones where price is more likely to react
このインジケーターを購入された方には、以下の特典を 無料 で提供しています: 各トレードを自動で管理し、ストップロスとテイクプロフィットを設定し、戦略ルールに基づいてポジションを決済する補助ツール 「Bomber Utility」 様々な銘柄に合わせたインジケーターの設定ファイル(セットファイル) 「最小リスク」、「バランスリスク」、「待機戦略」 の3つのモードで使用できる Bomber Utility 用の設定ファイル このトレーディング戦略をすぐに導入・設定・開始できる ステップバイステップのビデオマニュアル ご注意: 上記の特典を受け取るには、MQL5のプライベートメッセージシステムを通じて販売者にご連絡ください。 オリジナルのカスタムインジケーター 「Divergence Bomber(ダイバージェンス・ボンバー)」 をご紹介します。これは、MACDのダイバージェンス(乖離)戦略に基づいた 「オールインワン」型のトレーディングシステム です。 このテクニカルインジケーターの主な目的は、価格とMACDインジケーターの間に発生するダイバージェンスを検出 し、将来の価格の動きを示す
Power Candles V3 - 自己最適化型強弱インジケーター Power Candles V3は 、通貨や銘柄の強さを、適用されたすべてのチャート上で実行可能なトレードプランに変換します。単にローソク足を色分けするだけでなく、バックグラウンドでリアルタイムの自動最適化を実行し、目の前の銘柄に対して最適なストップロス、テイクプロフィット、およびシグナルの閾値を提示します。ワンクリックで実取引に適用でき、エントリーポイント、ストップロス、テイクプロフィットのラインが正確な価格位置にチャート上に表示され、方向性を示すアラートがリアルタイムで発動します。 このツールは、Stein Investmentsのエコシステムの一部です。  18種類以上のツールをすべて閲覧し、AIを活用したセットアップの推奨事項を入手し、  https://stein.investments でコミュニティに参加しましょう クローズしたバーごとに3,000回以上のトレードシミュレーション。9つの強さの状態。2つの戦略を並行してテスト。勝率の高い設定をワンクリックで適用。 なぜこれが必要なのか ほとんどの強
SignalTech MT5 is a fully rule based trading system for EURUSD, USDCHF, USDJPY, AUDUSD, NZDUSD, EURJPY, AUDJPY, NZDJPY, CADJPY.  All the winning trades with chart setups are published on the comments page. 2025-12 1174 Pips 2026-01 2624 Pips 2026-02 2937 Pips 2026-03 2165 Pips 2026-04 2243 Pips It can generate signals with Buy/Sell Arrows and Pop-Up/Sound Alerts. Each signal has clear Entry and Stop Loss levels, which should be automatically flagged on the chart, as well as potential Targets 1,
ご紹介     Quantum Breakout PRO は 、ブレイクアウト ゾーンの取引方法を変革する画期的な MQL5 インジケーターです。 13年以上の取引経験を持つ経験豊富なトレーダーのチームによって開発されました。     クォンタム ブレイクアウト プロ   は、革新的でダイナミックなブレイクアウト ゾーン戦略により、あなたのトレーディングの旅を新たな高みに押し上げるように設計されています。 クォンタム ブレイクアウト インジケーターは、5 つの利益ターゲット ゾーンを備えたブレイクアウト ゾーン上のシグナル矢印と、ブレイクアウト ボックスに基づいたストップロスの提案を提供します。 初心者トレーダーにもプロのトレーダーにも適しています。 量子EAチャネル:       ここをクリック 重要!購入後、インストールマニュアルを受け取るためにプライベートメッセージを送ってください。 推奨事項: 時間枠: M15 通貨ペア: GBPJPY、EURJPY、USDJPY、NZDUSD、XAUUSD アカウントの種類: ECN、Raw、またはスプレッドが非常に低い R
Azimuth Pro
Ottaviano De Cicco
5 (7)
Azimuth Pro V2:MT5向けシンセティック・フラクタル構造分析と確認済みエントリー 概要 Azimuth Pro は Merkava Labs によるマルチレベルスイング構造インジケーターです。4つのネストされたスイングレイヤー、スイングアンカーVWAP、ABCパターン検出、3タイムフレーム構造フィルタリング、そして確定バーでの確認済みエントリー — 1つのチャートで、ミクロスイングからマクロサイクルまでを網羅するワークフロー。 これはブラインドシグナル製品ではありません。ロケーション、コンテキスト、タイミングを重視するトレーダーのための構造ファーストワークフローです。 V2発売記念オファー — Azimuth Pro V2をUSD 399で(次の100本)。最終価格:USD 499。 1. V2での変更点 シンセティック・マルチタイムフレームエンジン 上位タイムフレーム分析をMeridian Proと同じ独自のシンセティックアーキテクチャで一から再構築。よりクリーンなHTFコンテキスト、安定したライブ動作、従来のMTF同期問題なし。シンセティックエンジンは 固定比率タ
RelicusRoad Pro: 定量的市場オペレーティングシステム 【期間限定】無制限アクセス 70% OFF - 2,000人超のトレーダーと共に なぜ多くのトレーダーは「完璧な」インジケーターを使っても失敗するのでしょうか? それは、文脈を無視して 単一の概念 だけでトレードしているからです。文脈のないシグナルは単なるギャンブルです。勝ち続けるには、 根拠の重なり(コンフルエンス) が必要です。 RelicusRoad Proは単なる矢印インジケーターではありません。完全な 定量的市場エコシステム です。独自のボラティリティモデリングを用いて、価格が推移する「適正価値の道(Fair Value Road)」をマッピングし、ノイズと真の構造的ブレイクを判別します。 推測はやめましょう。機関投資家レベルの「ロード・ロジック」でトレードを。 コアエンジン:「Road」アルゴリズム システムの中心となる Road Algo は、市場環境にリアルタイムで適応するダイナミックなボラティリティチャネルです。 安全ライン(平衡点) と、価格が数学的に反転しやすい 拡張レベル を投影します。 Si
MetaTrader 5 向けスマート多層ブレイクアウト&プルバック検出器 「スマート・シンプル・ファスト!」 高確率のブレイクアウトエントリーを見逃すことにうんざりしていませんか? 複数のチャートを何時間もスキャンし、ブレイクアウトをトレンド方向と通貨のモメンタムに合わせようとして、それでも動きを逃してしまうことはありませんか? Break Pullback は、1つのインジケーターでそのすべてを解決します。 Break Pullback とは何ですか? Break Pullback は、マーケットストラクチャー、ブレイクアウト、トレンド継続のセットアップを取引するトレーダー向けに特別に設計されたプロフェッショナルグレードの MetaTrader 5 インジケーターです。 リアルタイムで複数の通貨ペアにわたるブレイクとプルバックの形成を自動的に検出し、3層の確認を通じてすべてのシグナルをフィルタリングします: ストラクチャラルブレイクアウト検出 — チャート上の主要なブレイクレベルを特定 HTF 日足バイアス — エントリーを支配的な日足トレンド方向に合わせる 通貨強弱指数 —
このインジケーターを購入すると、プロ仕様のトレードマネージャーを無料で差し上げます。 まず第一に、このトレーディングシステムがノンリペイント、ノンリドロー、ノンラグのインジケーターであることを強調する価値がある。これにより、手動取引とロボット取引の両方に理想的なものになっています。 オンラインコース、マニュアル、プリセットのダウンロード。 「スマートトレンドトレーディングシステム MT5」は、新規および経験豊富なトレーダー向けにカスタマイズされた包括的なトレーディングソリューションです。10以上のプレミアムインジケーターを組み合わせ、7つ以上の堅実なトレーディング戦略を備えており、多様な市場状況に対応する多目的な選択肢となっています。 トレンドフォロー戦略:トレンドを効果的に乗り越えるための正確なエントリーとストップロス管理を提供します。 リバーサル戦略:潜在的なトレンドの反転を特定し、トレーダーがレンジ相場を活用できるようにします。 スキャルピング戦略:高速で正確なデイトレードおよび短期取引のために設計されています。 安定性:すべてのインジケーターはノンリペイント、ノンリドロー、ノ
まず第一に、この取引インジケーターは再描画されず、再描画されず、遅延しないことを強調する価値があります。これにより、手動取引とロボット取引の両方に理想的なものになります。 ユーザーマニュアル:設定、入力、戦略。 アトミックアナリストは、価格の強さとモメンタムを利用して市場でより良いエッジを見つけるためのPA価格アクションインジケーターです。ノイズや誤ったシグナルを除去し、取引ポテンシャルを高めるための高度なフィルターを備えています。複雑なインジケーターの複数のレイヤーを使用して、アトミックアナリストはチャートをスキャンし、複雑な数学的計算をシンプルなシグナルと色に変換します。これにより、どのような初心者トレーダーでも理解して使用し、一貫した取引の決定を行うことができます。 「アトミックアナリスト」は、新規および経験豊富なトレーダー向けにカスタマイズされた包括的な取引ソリューションです。プレミアムインジケーターとトップノッチの機能を1つの取引戦略に組み合わせ、すべてのタイプのトレーダーにとって汎用性のある選択肢にします。 デイリートレーディングとスキャルピング戦略:高速で正確なデイ
Quantum TrendPulse を ご紹介します。これは、   SuperTrend   、   RSI   、および Stochastic のパワーを 1 つの包括的なインジケーターに組み合わせて、取引の可能性を最大限に引き出す究極の取引ツールです。精度と効率を求めるトレーダー向けに設計されたこのインジケーターは、市場のトレンド、勢いの変化、最適なエントリー ポイントとエグジット ポイントを自信を持って特定するのに役立ちます。 主な特徴: SuperTrend 統合: 現在の市場動向に簡単に追従し、収益性の波に乗ることができます。 RSI精度: 買われすぎと売られすぎのレベルを検出し、市場の反転のタイミングに最適で、SuperTrendのフィルターとして使用されます。 確率的精度: 確率的振動を活用して、変動の激しい市場で隠れたチャンスを見つけます。SuperTrend のフィルターとして使用されます。 マルチタイムフレーム分析:   M5 から H1 または H4 まで、さまざまなタイムフレームで市場を常に把握します。 カスタマイズ可能なアラート: カスタム取引条件が満たされ
FX Trend NG:次世代マルチマーケット・トレンドインテリジェンス 概要 FX Trend NG は、複数の時間足に対応したプロフェッショナル向けトレンド分析およびマーケット監視ツールです。 市場全体の構造を数秒で把握することができます。 複数のチャートを切り替える必要はありません。どの銘柄がトレンド中なのか、どこでモメンタムが弱まっているのか、そしてどの時間足で強い整合性があるのかを瞬時に確認できます。 ローンチ特別オファー – FX Trend NG を $30(6ヶ月) または $80 永久ライセンス でご利用いただけます。 すでに Stein Investments のユーザーですか? -> メッセージを送信 して、プライベートグループへアクセスしてください。 セットアップや詳細情報が必要ですか? -> Stein Investments 公式ページ をご覧ください。 1. FX Trend NG が他と異なる理由 3ステート・トレンドロジック ― Buy と Sell だけではない • 多くのインジケーターは Buy または Sell の2状態のみを表示します。
BTMM State Engine Pro is a MetaTrader 5 indicator for traders who use the Beat The Market Maker approach: Asian session context, kill zone timing, level progression, peak formation detection, and a multi-pair scanner from a single chart. It combines cycle state logic with a built-in scanner dashboard so you do not need the same tool on many charts at once. What it does Draws the Asian session range; session times can follow broker server offset or be set in inputs. Tracks level progression (L
まず第一に、この取引ツールはノンリペイント、ノンリドロー、ノンラグの指標であり、プロの取引に理想的ですことを強調する価値があります。 オンラインコース、ユーザーマニュアル、デモ。 スマートプライスアクションコンセプトインジケーターは、新米から経験豊富なトレーダーまで、非常 に強力なツールです。Inner Circle Trader AnalysisやSmart Money Concepts Trading Strategiesなど、20以上の有用な指標を1つに組み合わせています。このインジケーターはスマートマネーコンセプトに焦点を当て、大手機関の取引方法を提供し、彼らの動きを予測するのに役立ちます。 特に、流動性分析に優れており、機関がどのように取引しているかを理解しやすくしています。市場のトレンドを予測し、価格の動きを慎重に分析するのに優れています。機関の戦略とトレードを合わせることで、市場の動向についてより正確な予測ができます。このインジケーターは多目的であり、市場構造を分析し、重要な注文ブロックを特定し、さまざまなパターンを認識するのに優れています。 このインジケーター
OrderFlux | MetaTrader 5 用フットプリント・オーダーフロー バージョン 2.0 – アクティブトレーダー向けのリアルタイム Bid/Ask 可視化 OrderFlux は MT5 用のフットプリントおよびオーダーフローインジケーターです。価格がどこに動いたかだけでなく、その動きの中で何が起きているか(各価格レベルの Bid/Ask ボリューム、デルタ、インバランス、ボリューム分布)を表示します。 多くのチャートはローソク足の最終結果しか表示しません。OrderFlux はそこに至るまでの過程を表示します。ローソク足の形状だけでなく、市場参加者の動向を読み取りたい場合にまさに役立ちます。 ライブチャートにおいて、OrderFlux は主に次の3つの質問に答えます: 現在、どこで積極的な買いまたは売りの圧力が市場に参入しているか? どの価格レベルでボリュームが吸収、または拒否されているか? 現在の動きはセッションのコンテキスト(背景)にどう適合しているか? インターフェースで得られるもの メインチャートは、Canvas ベースでフットプリントを直接レンダリングします
優れたテクニカルインジケーター「Grabber」をご紹介します。これは、すぐに使える「オールインワン」トレーディング戦略として機能します。 ひとつのコードに、市場のテクニカル分析ツール、取引シグナル(矢印)、アラート機能、プッシュ通知が強力に統合されています。 このインジケーターを購入された方には、以下の特典を無料で提供します: Grabberユーティリティ:オープンポジションを自動で管理するツール ステップバイステップのビデオマニュアル:インジケーターのインストール、設定、取引方法を解説 カスタムセットファイル:インジケーターをすばやく自動設定し、最大限の成果を出すための設定ファイル 他の戦略はもう忘れてください!Grabberだけが、あなたを新たなトレードの高みへと導いてくれるのです。 Grabber戦略の主な特徴: 推奨タイムフレーム:M5〜H4 対応通貨ペア・資産:どれでも使用可能ですが、私が実際に検証した以下を推奨します(GBPUSD、GBPCAD、GBPCHF、AUDCAD、AUDUSD、AUDSGD、AUDCHF、NZDUSD、NZDCAD、EURCAD、EURUSD、E
Crystal Heikin Ashi Signals - Professional Trend & Signal Detection Indicator Advanced Heikin Ashi Visualization with Intelligent Signal System for Manual & Automated Trading Final Price: $149 ---------> Price goes up $10 after every 10 sales . Limited slots available — act fast . Overview Crystal Heikin Ashi Signals is a professional-grade MetaTrader 5 indicator that combines pure Heikin Ashi candle visualization with an advanced momentum-shift detection system. Designed for both manual traders
「 Dynamic Scalper System MT5 」インジケーターは、トレンド波の中でスキャルピング取引を行う手法のために設計されています。 主要通貨ペアと金でテスト済みで、他の取引商品との互換性があります。 トレンドに沿った短期的なポジションオープンのシグナルを提供し、追加の価格変動サポートも提供します。 インジケーターの原理 大きな矢印はトレンドの方向を決定します。 トレンド波の中では、小さな矢印の形でスキャルピングシグナルを生成するアルゴリズムが機能します。 赤い矢印は強気方向、青い矢印は弱気方向です。 トレンドの方向には敏感な価格変動ラインが描かれ、小さな矢印のシグナルと連動します。 シグナルは次のように機能します。適切なタイミングでラインが現れるとエントリーシグナルが形成され、ラインが開いている間はポジションが保持され、完了すると取引が終了します。 推奨される動作時間枠はM1~H4です。 矢印は現在のローソク足に形成され、次のローソク足が開いている場合は、前のローソク足の矢印は再描画されません。 入力パラメータ Trend Wave Period - トレ
このダッシュボードは、選択されたシンボルの最新の利用可能なハーモニックパターンを表示するので、時間を節約し、より効率的に /   MT4バージョン 。 無料インジケーター:   Basic Harmonic Pattern インジケーター列 Symbol : 選択したシンボルが表示されます。 Trend :   強気または弱気 Pattern : パターンの種類(ガートレー、バタフライ、バット、カニ、サメ、サイファー、ABCD) Entry : エントリー価格 SL: ストップロス価格 TP1: 1回目の利食い価格 TP2: 2回目の利食い価格 TP3:   3回目の利食い価格 Current price :   現在値 Age (in bars):    最後に描画されたパターンの年齢 主な入力項目 Symbols:   "28 Major Currency Pairs "または "Selected Symbols "から選択。 Selected Symbols:   カンマで区切られた監視したいシンボル("EURUSD,GBPUSD,XAUUSD")。ブローカーがペアに接
Meridian Pro
Ottaviano De Cicco
5 (2)
Meridian Pro 2.00:MT5向けプロ仕様マルチタイムフレーム・トレンドマトリクス Meridian Pro 2.00 は、MetaTrader 5 向けのプロ仕様の適応型トレンドマトリクスです。オリジナルの Meridian トレンドエンジン、クリーンなチャート ribbon、確定足ベースのシグナル矢印、8時間足 dashboard、Fuel momentum、weighted consensus、synthetic HTF processing、そしてチャート上に直接表示される上位足コンテキストラインを統合します。 目的はシンプルです。現在のトレンド、マルチタイムフレーム構造、強度、momentum、EA-ready 状態を、複数チャートに無関係なインジケータを重ねるのではなく、1つの整理された workflow で読むことです。 Meridian Pro の違い 1つの適応型エンジン - 同じ volatility-aware Meridian ロジックを M1 から W1 まで適用します。 Synthetic HTF architecture - 上位足行は下位足デ
OmniSync Projection
Antonio-alin Teculescu
5 (1)
Chronos Fractal Engine is an innovative price projection indicator for MetaTrader 5, designed to transform your technical analysis by intelligently identifying and projecting historical price patterns. Built upon an advanced correlation algorithm and the fractal principles of the market, this powerful tool visualizes potential future price movements, giving you a unique edge in your trading decisions. What is Chronos Fractal Engine? At its core, the Chronos Fractal Engine employs a sophisticat
FX Power: 通貨の強弱を分析して、より賢い取引を実現 概要 FX Power は主要通貨と金の実際の強弱をあらゆる市場状況で理解するための必須ツールです。強い通貨を買い、弱い通貨を売ることで、 FX Power は取引の意思決定を簡素化し、高い確率の取引機会を見出します。トレンドを追従する場合でも、極端なデルタ値を使用して反転を予測する場合でも、このツールはあなたの取引スタイルに完全に適応します。ただ取引するだけではなく、 FX Power で賢く取引をしましょう。 1. なぜ FX Power がトレーダーにとって非常に有益なのか 通貨と金のリアルタイム強弱分析 • FX Power は主要通貨と金の相対的な強弱を計算し、マーケットダイナミクスに関する明確な洞察を提供します。 • どの資産がリードしているか、または後れを取っているかを監視して、取引するペアを賢く選びましょう。 マルチタイムフレームの包括的なビュー • 短期、中期、長期のタイムフレームで通貨と金の強弱を追跡し、マーケットトレンドに基づいて取引戦略を調整できます。 • スキャルピングからスイングトレード
Market Structure Patterns
Samuel Manoel De Souza
4.47 (19)
Market Structure Patterns   is an indicator based on   smart money concepts   that displays   SMC/ICT   elements that can take your trading decisions to the next level. Take advantage of the   alerts ,   push notifications   and   email messages   to keep informed from when an element is formed on the chart, the price crosses a level and/or enters in a box/zone. Developers can access the values of the elements of the indicator using the   global variables  what allows the automation of trading
トレンドラインプロ   市場の真の方向転換点を理解するのに役立ちます。この指標は、真のトレンド反転と主要プレーヤーが再び参入するポイントを示します。 分かりますか     BOSライン   複雑な設定や不要なノイズなしに、より長い時間足でのトレンドの変化と重要なレベルを把握できます。シグナルは再描画されず、バーが閉じた後もチャート上に残ります。 MT4バージョン   -   RFI LEVELS PRO インジケーター と組み合わせることで、その最大限の能力を発揮します インジケーターが示す内容: 本当の変化   トレンド(BOSライン) 一度シグナルが現れたら、それは有効です!これは、リペイント機能を持つインジケーターとの重要な違いです。リペイント機能を持つインジケーターは、シグナルを発した後、それを変更し、資金の損失につながる可能性があります。これにより、より高い確率と精度で市場に参入できます。また、矢印が現れた後、目標値(利益確定)に達するか、反転シグナルが現れるまで、ローソク足の色を変更する機能もあります。 繰り返しエントリ   主要プレーヤーの補充 エントリーポイントを探す
The Zone Trading Indicator is a technical analysis tool for MetaTrader 5 that automatically identifies and displays tradable price zones across multiple timeframes to assist with structured market analysis. The indicator plots Monthly, Weekly, Daily, and H4 tradable zones , allowing traders to view higher- and lower-timeframe price areas simultaneously. These zones are designed to support one-candle–based entry approaches by highlighting predefined areas where price interaction may be monitored.
このインジケーターは、反転ポイントと価格戻りゾーンを正確に表示します。     主要プレーヤー 。新たなトレンドが形成される場所を把握し、最大限の精度で意思決定を行い、すべての取引をコントロールします。 TREND LINES PRO インジケーターと組み合わせることで、その潜在能力を最大限に発揮します。 VERSION MT4 インジケーターが示す内容: 新しいトレンドの始まりに活性化する反転構造と反転レベル。 リスクと報酬の比率を最小限に抑えた利益 確定 と 損失停止の レベルの表示     RR 1:2   。 インテリジェントな削減ロジックによるストップロス。 指定されたインジケーターから 2 つのトレンド タイプの反転パターンを表示します。 指標: トレンドを追う   TREND LINES PRO   (世界的なトレンドの変化) TREND PRO   (クイックトレンド変更) シンプルで効果的   スキャナー   リアルタイムトレンド(新機能)。 マルチタイムフレームのインストゥルメント フィルタリング。 画面   利益     LOGIC AI信号の後。 当日プラス方
このインディケータは、価格アクション分析とドンチャンチャネルのみを使用して、ジグザグ方式で価格の反転を検出します。再描画やバックペインティングを一切行わずに、短期取引向けに特別に設計されています。それは彼らの操作のタイミングを増やすことを目指している賢明なトレーダーにとって素晴らしいツールです。 [ インストールガイド | 更新ガイド | トラブルシューティング | よくある質問 | すべての製品 ] 驚くほど簡単に取引できます すべての時間枠で価値を提供します 自己分析統計を実装します 電子メール/音声/視覚アラートを実装します 可変長のブレイクアウトと混雑ゾーンに基づいて、インディケータは価格アクションのみを使用して取引を選択し、市場が非常に高速に行っていることに反応します。 過去のシグナルの潜在的な利益が表示されます この指標は、独自の品質とパフォーマンスを分析します 負けブレイクアウトは強調表示され、説明されます インジケータは、非バックペインティングおよび非再ペイントです この指標は、日中のトレーダーが単一の価格反転を見逃さないようにするのに役立ちます。ただし、すべての
Super Signal Market Slayer 非リペイント|高精度|マルチマーケット対応インテリジェントトレンド指標 トレードにおいて本当に難しいのは、 注文することではなく、相場のノイズの中で「トレンドが始まった瞬間」を見極めることです。 Market Slayer はそのために開発されました。 本インジケーターは、日中取引向けに設計された非リペイント型のインテリジェント指標です。 多層確認とトレンドフィルターにより、重要な局面でのみ明確かつ信頼性の高い Buy / Sell シグナルを表示します。 主な特長 非リペイントシグナル 一度表示されたシグナルは固定され、消えたり移動したりしません。 高精度なトレンド判定 複数銘柄で検証され、特にゴールド M5 / M15 で安定した結果を示します。 マルチマーケット対応 ゴールド、FX、指数、主要暗号資産に対応。 日中取引向け最適化 M5・M15 に特化し、ノイズを抑え実行性を向上。 直感的で分かりやすい 初心者でも理解しやすく、すぐに使用可能。 技術ロジック概要 Market Slayer は単一条件の矢印ではありません。 以
作者のその他のプロダクト
Trend Screener
STE S.S.COMPANY
4.79 (95)
トレンドインジケーター、1つのツールに組み込まれたすべての重要なトレンド機能を備えたトレンドトレーディングとフィルタリングのための画期的なユニークなソリューション! これは、すべてのシンボル/商品(外国為替、商品、暗号通貨、インデックス、株式)で使用できる100%再描画されていないマルチタイムフレームおよびマルチ通貨インジケーターです。 期間限定オファー: サポートおよびレジスタンス スクリーナー インジケーターは、たった 65 ドルで永久的にご利用いただけます。(元の価格 250 ドル) (オファー延長) トレンドスクリーナーは、チャート内のドットで矢印トレンドシグナルを提供するインジケーターに続く効率的なインジケーターです。 トレンド分析インジケーターで使用できる機能: 1.トレンドスキャナー。 2.最大利益分析を備えたトレンドライン。 3.トレンド通貨強度メーター。 4.アラート付きのトレンド反転ドット。 5.アラート付きの強いトレンドドット。 6.トレンド矢印 毎日の分析例、毎日のシグナルパフォーマンス...など、トレンドスクリーナーインジケーターを使用して、ここで見つけること
私たちのサポートまたはレジスタンスレベルは、市場の価格行動が逆転して方向を変え、市場にピークまたはトラフ(スイングポイント)を残したときに形成されます。サポートとレジスタンスのレベルは、取引範囲を切り開くことができます。インジケーターは、インジケーターセットで定義されたバーのX量(期間)に基づいて、スイングハイとスイングローを識別します。 注:価格アクションインジケーターが気に入った場合は、オールインワントレンドインジケーター(トレンドスクリーナー、トレンドライン、ストロングトレンド、トレンドリバーサルシグナルなど)をお試しください。 入手するには、 ここをクリックしてください 主な機能 テクニカル分析の重要な概念は、抵抗またはサポートレベルが破られると、その役割が逆転することです。価格がサポートレベルを下回ると、そのレベルは抵抗力があります。価格が抵抗レベルを超えて上昇した場合、それはしばしばサポートになります。 水平方向のサポートと抵抗のレベルは、これらのレベルの最も基本的なタイプです。それらは単に水平線で識別されます: チャートの緑のレベルは、抵抗レベルです。 チャートの赤
FREE
ブームおよびクラッシュスパイク検出器インジケーターは、主に価格のブームおよびクラッシュを検出するための高度な戦略に基づいてコーディングされています。 価格の高確率のブームとクラッシュを検出するために、複雑なアルゴリズムが組み込まれました。 ブームまたはクラッシュフェーズの可能性について警告します。 ブームフェーズ:価格の上昇が速すぎる場合。 クラッシュフェーズ:価格の低下が速すぎる場合。 期間限定オファー:インジケーターは30ドルと生涯でのみご利用いただけます。 主な機能 プッシュ通知を携帯電話に送信します コンピューターまたはラップトップでポップアップしてアラートを鳴らします 再描画されない矢印を表示します(潜在的なブームの場合は上向きの矢印、潜在的なクラッシュの場合は下向きの矢印) すべてのペアでの作業。 おすすめ 時間枠:H1およびH4 ペアの推奨:トレンドフェーズのペア。 コンタクト ご不明な点がある場合やサポートが必要な場合は、プライベートメッセージでご連絡ください。 著者 SAYADI ACHREF、fintechソフトウェアエンジニアおよびFinansyaの
サポートとレジスタンススクリーナーは、1つのインジケーター内に複数のツールを提供するMetaTraderの1つのレベルインジケーターにあります。 利用可能なツールは次のとおりです。 1.市場構造スクリーナー。 2.強気のプルバックゾーン。 3.弱気プルバックゾーン。 4.デイリーピボットポイント 5.毎週のピボットポイント 6.毎月のピボットポイント 7.ハーモニックパターンとボリュームに基づく強力なサポートとレジスタンス。 8.銀行レベルのゾーン。 期間限定オファー:HVサポートおよびレジスタンスインジケーターは、50ドルと生涯でのみご利用いただけます。 (元の価格125 $) MQL5ブログにアクセスすると、分析例を含むすべてのプレミアム指標を見つけることができます。 ここをクリックしてください。 主な機能 ハーモニックおよびボリュームアルゴリズムに基づく強力なサポートおよびレジスタンスゾーン。 ハーモニックおよびボリュームアルゴリズムに基づく強気および弱気のプルバックゾーン。  市場構造スクリーナー 毎日、毎週、毎月のピボットポイント。 ドキュメント すべてのサポートおよび
私たちのサポートまたはレジスタンスレベルは、市場の価格行動が逆転して方向を変え、市場にピークまたはトラフ(スイングポイント)を残したときに形成されます。サポートとレジスタンスのレベルは、取引範囲を切り開くことができます。インジケーターは、インジケーターセットで定義されたバーのX量(期間)に基づいて、スイングハイとスイングローを識別します。 注:価格アクションインジケーターが気に入った場合は、オールインワントレンドインジケーター(トレンドスクリーナー、トレンドライン、ストロングトレンド、トレンドリバーサルシグナルなど)をお試しください。 入手するには、 ここをクリックしてください 主な機能 テクニカル分析の重要な概念は、抵抗またはサポートレベルが破られると、その役割が逆転することです。価格がサポートレベルを下回ると、そのレベルは抵抗力があります。価格が抵抗レベルを超えて上昇した場合、それはしばしばサポートになります。 水平方向のサポートと抵抗のレベルは、これらのレベルの最も基本的なタイプです。それらは単に水平線で識別されます: チャートの緑のレベルは、抵抗レベルです。 チャートの赤
FREE
サポートとレジスタンススクリーナーは、1つのインジケーター内に複数のツールを提供するMetaTraderの1つのレベルインジケーターにあります。 利用可能なツールは次のとおりです。 1.市場構造スクリーナー。 2.強気のプルバックゾーン。 3.弱気プルバックゾーン。 4.デイリーピボットポイント 5.毎週のピボットポイント 6.毎月のピボットポイント 7.ハーモニックパターンとボリュームに基づく強力なサポートとレジスタンス。 8.銀行レベルのゾーン。 期間限定オファー:HVサポートおよびレジスタンスインジケーターは、50ドルと生涯でのみご利用いただけます。 (元の価格125 $) Metatrader Backtesterの制限なしでインジケーターを試してみませんか? デモ版をダウンロードするには、ここをクリックしてください。 主な機能     ハーモニックおよびボリュームアルゴリズムに基づく強力なサポートおよびレジスタンスゾーン。     ハーモニックおよびボリュームアルゴリズムに基づく強気および弱気のプルバックゾーン。     市場構造スクリーナー     毎日、毎週、毎月の
すべてのトレーダーは、1 回の取引で 5% (または 7%) を超えるリスクを負ってはならないことを知っています。これはマネー管理の法則であり、トレーダーは異なる取引レベルに対して異なるストップロス値を使用する必要があるため、使用可能な LotSize を毎回計算する必要があります。このインディケータは、チャートに配置する瞬間に適切な LotSize を計算し、「ストップ ロス ライン」を任意の方向にドラッグするたびに計算します。 期間限定オファー: すべてのプレミアム インジケーターはわずか 50$ で利用できます。MQL5 ブログにアクセスすると、プレミアム インジケーターのすべての詳細を確認できます。ここをクリック。 入力 MAX_RISK_PER_TRADE - トレーダーがトレードごとにリスクを負うパーセンテージ。 CUSTOM_BALANCE - リスクの計算に使用される金額を定義します。 0 => 電卓は口座残高を使用します。 ENTRY_PRICE_LINE_COLOR - TP (テイクプロフィット) ラインの色 STOP_PRICE_LINE_COLOR-
トレンドラインマップインジケーターは、トレンドスクリーナーインジケーターのアドオンです。トレンドスクリーナー(トレンドラインシグナル)によって生成されたすべてのシグナルのスキャナーとして機能します。 これは、トレンドスクリーナーインジケーターに基づくトレンドラインスキャナーです。 Trend Screener Pro インジケーターがない場合、Trend Line Map Proは機能しません。 It's a Trend Line Scanner based on Trend Screener Indicator. If you don't have Trend Screener Pro Indicator,     the Trend Line Map Pro will not work . ブログにアクセスすると、トレンドラインマップインジケーターの無料バージョンをダウンロードできます。 Metatrader Testerの制限なしで、購入する前に試してみてください。 :  ここをクリック 1.簡単になる利点 通貨と時間枠に基づいて売買シグナルを表示します。 チャー
通貨強度メーターは、現在どの通貨が強いか、どの通貨が弱いかをすばやく視覚的にガイドします。 メーターは、すべての外国為替クロスペアの強度を測定し、それらに計算を適用して、個々の通貨の全体的な強度を決定します。 28ペアのトレンドに基づいて通貨の強さに基づいて計算します。 MQL5ブログにアクセスすると、インジケーターの無料バージョンをダウンロードできます。 Metatrader Testerの制限なしで、購入する前に試してみてください: ここをクリック 1.ドキュメント すべてのトレンド通貨強度のドキュメント(手順)と戦略の詳細は、MQL5ブログのこの投稿で入手できます: ここをクリックしてください。 2.お問い合わせ ご不明な点がある場合やサポートが必要な場合は、プライベートメッセージでご連絡ください。 3.作成者 SAYADI ACHREF、フィンテックソフトウェアエンジニア、Finansyaの創設者。
トレンドラインマップインジケーターは、トレンドスクリーナーインジケーターのアドオンです。トレンドスクリーナー(トレンドラインシグナル)によって生成されたすべてのシグナルのスキャナーとして機能します。 これは、トレンドスクリーナーインジケーターに基づくトレンドラインスキャナーです。 Trend Screener Pro インジケーターがない場合、Trend Line Map Proは機能しません。 ブログにアクセスすると、トレンドラインマップインジケーターの無料バージョンをダウンロードできます。 Metatrader Testerの制限なしで、購入する前に試してみてください。 :    ここをクリック 1.簡単になる利点 通貨と時間枠に基づいて売買シグナルを表示します。 チャートに矢印が表示されてから価格が増減したピップ数を評価します。 (トレンドスクリーナーインジケーター矢印) 信号のタイミングを表示します。 アラートを売買するための複数の時間枠と複数の通貨のアラートを取得します。 2.トレンドラインマップの使用方法 売買シグナルダッシュボードを表示する方法は?
平均日次範囲は、特定の期間にわたって測定された外国為替ペアの平均ピップ範囲を示します。トレーダーはADRを使用して、平均的な1日の動き以外の潜在的な価格行動を視覚化できます。 ADRが平均を上回っている場合、それは毎日のボラティリティが通常よりも高いことを意味します。これは、通貨ペアがその基準を超えて拡大している可能性があることを意味します。 ADRアナライザーは5つの主要な機能で構成されています。 範囲(ADR)スクリーナー:複数通貨のADR分析。 ADRゾーン:ADRゾーンの価格ブームの外で日中に予想される市場範囲を示します。 Xバーゾーン:ユーザーが指定したXバーのX量のブレークを表示します。 毎日の高および低ゾーン:前日の高レベルまたは低レベルの休憩を識別します。 ウィークリーハイゾーンとローゾーン:週の休憩日ハイレベルまたはローレベルを識別します。 期間限定オファー:レンジアナライザーインジケーターは、50ドルと寿命でのみご利用いただけます。 (元の価格125 $) 主な機能 マルチ通貨スクリーナー。 ADRゾーンブレイクアウト すべてのタイプのアラート(ポップ、プッ
ボラティリティ アナライザーはモメンタム インジケーターであり、タイトな取引範囲での値固め後に価格が大きく上昇する傾向を利用します。このインジケーターは、スクイーズが発火したときの動きの予想される方向を示すために、運動量オシレーターも使用します。このヒストグラムはゼロ ラインの周りで振動し、ゼロ ラインより上のモメンタムの増加はロングを購入する機会を示し、ゼロ ラインを下回るモメンタムはショートの機会を示す可能性があります。 期間限定オファー : インジケーターは、わずか 50 $ で無期限でご利用いただけます。 ( 元の価格 125$ ) 主な機能 横向きトレンド検出器。 低揮発性検出器。 強気の高値と弱気の高値のボラティリティ検出器。 すべての時間枠とすべてのペアで作業します。 ポップアップ アラートとプッシュ通知アラートを提供します。 コンタクト 質問がある場合、またはサポートが必要な場合は、プライベート メッセージでご連絡ください。 警告 すべてのインジケーターとツールは、公式のメタトレーダー ストア (MQL5 マーケット) からのみ入手できます。 プレミア
ブームおよびクラッシュスパイク検出器インジケーターは、主に価格のブームおよびクラッシュを検出するための高度な戦略に基づいてコーディングされています。 価格の高確率のブームとクラッシュを検出するために、複雑なアルゴリズムが組み込まれました。 ブームまたはクラッシュフェーズの可能性について警告します。 ブームフェーズ:価格の上昇が速すぎる場合。 クラッシュフェーズ:価格の低下が速すぎる場合。 期間限定オファー:インジケーターは30ドルと生涯でのみご利用いただけます。 主な機能 プッシュ通知を携帯電話に送信します コンピューターまたはラップトップでポップアップしてアラートを鳴らします 再描画されない矢印を表示します(潜在的なブームの場合は上向きの矢印、潜在的なクラッシュの場合は下向きの矢印) すべてのペアでの作業。 おすすめ 時間枠:H1およびH4 ペアの推奨:トレンドフェーズのペア。 コンタクト ご不明な点がある場合やサポートが必要な場合は、プライベートメッセージでご連絡ください。 著者 SAYADI ACHREF、fintechソフトウェアエンジニアおよびFinansyaの
すべてのトレーダーは、1 回の取引で 5% (または 7%) を超えるリスクを負ってはならないことを知っています。これはマネー管理の法則であり、トレーダーは異なる取引レベルに対して異なるストップロス値を使用する必要があるため、使用可能な LotSize を毎回計算する必要があります。このインディケータは、チャートに配置する瞬間に適切な LotSize を計算し、「ストップ ロス ライン」を任意の方向にドラッグするたびに計算します。 期間限定オファー: すべてのプレミアム インジケーターはわずか 50$ で利用できます。MQL5 ブログにアクセスすると、プレミアム インジケーターのすべての詳細を確認できます。ここをクリック。 入力 MAX_RISK_PER_TRADE - トレーダーがトレードごとにリスクを負うパーセンテージ。 CUSTOM_BALANCE - リスクの計算に使用される金額を定義します。 0 => 電卓は口座残高を使用します。 ENTRY_PRICE_LINE_COLOR - TP (テイクプロフィット) ラインの色 STOP_PRICE_LINE_COLOR-
通貨強度メーターは、現在どの通貨が強いか、どの通貨が弱いかをすばやく視覚的にガイドします。 メーターは、すべての外国為替クロスペアの強度を測定し、それらに計算を適用して、個々の通貨の全体的な強度を決定します。 28ペアのトレンドに基づいて通貨の強さに基づいて計算します。 MQL5ブログにアクセスすると、インジケーターの無料バージョンをダウンロードできます。 Metatrader Testerの制限なしで、購入する前に試してみてください: ここをクリック 1.ドキュメント すべてのトレンド通貨強度のドキュメント(手順)と戦略の詳細は、MQL5ブログのこの投稿で入手できます: ここをクリックしてください。 2.お問い合わせ ご不明な点がある場合やサポートが必要な場合は、プライベートメッセージでご連絡ください。 3.作成者 SAYADI ACHREF、フィンテックソフトウェアエンジニア、Finansyaの創設者。
平均日次範囲は、特定の期間にわたって測定された外国為替ペアの平均ピップ範囲を示します。トレーダーはADRを使用して、平均的な1日の動き以外の潜在的な価格行動を視覚化できます。 ADRが平均を上回っている場合、それは毎日のボラティリティが通常よりも高いことを意味します。これは、通貨ペアがその基準を超えて拡大している可能性があることを意味します。 ADRアナライザーは5つの主要な機能で構成されています。 範囲(ADR)スクリーナー:複数通貨のADR分析。 ADRゾーン:ADRゾーンの価格ブームの外で日中に予想される市場範囲を示します。 Xバーゾーン:ユーザーが指定したXバーのX量のブレークを表示します。 毎日の高および低ゾーン:前日の高レベルまたは低レベルの休憩を識別します。 ウィークリーハイゾーンとローゾーン:週の休憩日ハイレベルまたはローレベルを識別します。 期間限定オファー:レンジアナライザーインジケーターは、50ドルと寿命でのみご利用いただけます。 (元の価格125 $) 主な機能 マルチ通貨スクリーナー。 ADRゾーンブレイクアウト すべてのタイプのアラート(ポップ、プッ
ボラティリティ アナライザーはモメンタム インジケーターであり、タイトな取引範囲での値固め後に価格が大きく上昇する傾向を利用します。このインジケーターは、スクイーズが発火したときの動きの予想される方向を示すために、運動量オシレーターも使用します。このヒストグラムはゼロ ラインの周りで振動し、ゼロ ラインより上のモメンタムの増加はロングを購入する機会を示し、ゼロ ラインを下回るモメンタムはショートの機会を示す可能性があります。 期間限定オファー : インジケーターは、わずか 50 $ で無期限でご利用いただけます。 ( 元の価格 125$ ) 主な機能 横向きトレンド検出器。 低揮発性検出器。 強気の高値と弱気の高値のボラティリティ検出器。 すべての時間枠とすべてのペアで作業します。 ポップアップ アラートとプッシュ通知アラートを提供します。 コンタクト 質問がある場合、またはサポートが必要な場合は、プライベート メッセージでご連絡ください。 警告 すべてのインジケーターとツールは、公式のメタトレーダー ストア (MQL5 マーケット) からのみ入手できます。 プレミア
フィルタ:
Tahir_k81
135
Tahir_k81 2026.04.07 00:07 
 

I’ve been using your indicators for some time now, and overall I’m very satisfied with the quality and thought behind the tools. The Pro Screener, in particular, gives a very clear and efficient overview of the market. It makes scanning multiple pairs much easier and helps quickly identify potential opportunities. When combined with the support and resistance features, the entries become even more refined. The addition of bank levels within the screener is a strong advantage and adds real value to the decision-making process. Up to this point, everything works very well. However, one limitation I’ve noticed is that the process still requires manually checking each pair. There isn’t a simple alert system that notifies when price reaches a bank level or when a valid buy/sell setup appears. I did try enhancing the setup using the Line Map alert system, which helps, but it feels quite heavy. If there were a way to make this alert system more lightweight and streamlined, it would significantly improve usability. In my view, this could become a very powerful combination: Pro Screener for overall market view Bank levels integrated into the screener A lightweight alert system that can trigger buy/sell signals based on selected conditions (e.g., screener arrow, bank level touch, or both) Having flexible alert settings where users can choose their preferred conditions would make the system even more effective. Lastly, I’d like to highlight that the author is very responsive and supportive. He is willing to help and even available for Zoom meetings if issues persist, which is highly appreciated. Overall, a very strong toolset with great potential—just needs a more efficient alert mechanism to take it to the next level.

nava91
19
nava91 2026.03.18 17:53 
 

It’s a really amazing indicator. I have been using it for the past year, and the high-timeframe signals are very accurate. The author is also very helpful—whenever I have doubts or need clarification, he responds quickly at any time.

Gary
617
Gary 2026.02.22 19:34 
 

Great indicator works very well.

الباشا الباشا
52
الباشا الباشا 2026.01.12 17:41 
 

A very excellent indicator, and there is little talk about it. It has helped me a lot. I hope the developer will add an automated trading feature or create a trading robot with the same accuracy as this indicator and add an option that allows the user to set a target with a specific number of points. Thank you.

hatorii
48
hatorii 2025.11.30 04:37 
 

Excellent and very comprehensive indicator; the creator has dedicated himself to every detail. I highly recommend it.

STE S.S.COMPANY
304899
開発者からの返信 Sayadi Achraf 2025.11.30 21:31
⭐ ⭐ ⭐ ⭐ ⭐
Thank you so much for your excellent feedback! I’m really glad to hear that you find the indicator comprehensive and detailed. I put a lot of dedication into every part of it, so it means a lot to know it’s helping you.
Your recommendation is truly appreciated. If you ever need any assistance or have questions, I’m always here to help. 🙌
Thanks again for your support
Joan Carlos Rosario Nunez
515
Joan Carlos Rosario Nunez 2025.11.27 06:35 
 

Just purchased Trend Screener Pro and the first impression is excellent. The indicator is well-designed, easy to configure and very helpful as a trend filter and market scanner. I’m planning to integrate it into my personal trading workflow and I hope to get solid results with it. So far, great work from the developer.”

STE S.S.COMPANY
304899
開発者からの返信 Sayadi Achraf 2025.11.27 12:41
Thank you so much for your fantastic review! I’m really glad to hear that your first impression of Trend Screener Pro has been excellent. It’s great to know the indicator has been easy to set up and is already adding value to your trend filtering and market scanning. ⭐️⭐️⭐️⭐️⭐️
speedet
34
speedet 2025.11.15 23:33 
 

ユーザーは評価に対して何もコメントを残しませんでした

STE S.S.COMPANY
304899
開発者からの返信 Sayadi Achraf 2025.11.16 09:34
Thank you so much for your detailed feedback and the ⭐️⭐️⭐️⭐️⭐️ rating! I’m really glad to hear that the Trend Screener Indicator is helping you identify market trends more confidently, especially when used together with the Support & Resistance screener and trend CSM. Your suggestion about adding dynamic TP & SL by dots is greatly appreciated — it’s a valuable idea and I’ll definitely consider it for future updates to improve the tool even further.
Thanks again for your trust and support! 🙏 If you ever have more suggestions or need assistance, feel free to reach out anytime.
zitoup
21
zitoup 2025.11.09 21:40 
 

This indicator is excellent. It allows you to correctly predict the trend and multi-currencies scanning. I liked a lot the idea behding using fuzzt logic in analyzin market trend.

STE S.S.COMPANY
304899
開発者からの返信 Sayadi Achraf 2025.11.16 15:38
Thank you so much for your positive feedback! We're thrilled to hear that you find the indicator helpful for predicting trends and scanning multiple currencies. The fuzzy logic approach was designed to bring more adaptive and intelligent market analysis, so it’s great to know you appreciate that feature. Your support motivates us to keep improving and innovating!
Aether Trade
148
Aether Trade 2025.11.05 09:03 
 

Pretty much whatever the worst reviews said, thats where you will find the truth. There is no way 110+ people wrote legitimate reviews of this indicator, its absolute trash. Stick to free indicators from the market, they perform better and you wont be disappointed, unlike this indicator which is just disappointment.

STE S.S.COMPANY
304899
開発者からの返信 Sayadi Achraf 2025.11.21 10:00
Thank you for taking the time to share your feedback. We’re genuinely sorry to hear that your experience didn’t meet your expectations. We’ve checked our records and haven’t received any support request from you, so I’ve reached out via private message to better understand your situation and assist you as quickly as possible. Please take a moment to check your inbox so we can resolve this for you right away. Update (21 Nov 2025): We still haven’t received any response to our private messages. We’d truly like to help, so please get in touch whenever you’re ready. In the meantime, we kindly invite you to review our MT4 version’s customer feedback. Since 2020, more than 1,000 traders have used our product successfully, and their reviews may provide helpful context regarding the quality and reliability of our work & customer support: MT4 Version: https://www.mql5.com/en/market/product/46303 Thank you, and we look forward to assisting you.
Alexandre Dos Santos Antunes
518
Alexandre Dos Santos Antunes 2025.10.27 17:34 
 

Trend indicator, fantastic, gives me the direction in which the price is going, sensational.

STE S.S.COMPANY
304899
開発者からの返信 Sayadi Achraf 2025.10.29 16:05
Thank you so much for your fantastic feedback! We're thrilled to hear that you’re enjoying the trend indicator and finding it helpful for understanding price direction. Your support means a lot to us — happy trading and wishing you continued success!
Tri Angga Dio Simamora
131
Tri Angga Dio Simamora 2025.10.25 01:04 
 

Trend Screener Pro is one of the best tools I’ve used on MT5. it helps me identify the overall market trend across multiple timeframes with great precision. Great job this is definitely a must-have indicator for traders who rely on trend confirmation. Highly recommended! 👏

SEAN
455
SEAN 2025.10.20 00:22 
 

I like this tool very much, I tested with my paper account. Its alert precisely give me profitable entry point. The only downside how the TP/SL is marked is a little bit abstract. However, this is perfectly resolved by Support and Resistance Screener, which give me more confidence in the trade. Sayadi is helpful in answering all sorts of my questions, kind in offering trade advice along the side. It's my luck to spot this tool, you won't regret too.

STE S.S.COMPANY
304899
開発者からの返信 Sayadi Achraf 2025.10.20 16:18
Thank you so much for your kind words and thoughtful feedback! 🌟
We’re thrilled to hear that the tool’s alerts have been helping you identify profitable entry points and that the Support and Resistance Screener adds confidence to your trades. Your comment about the TP/SL marking is very valuable — we’re always working to make the interface more intuitive, and insights like yours help us improve. We’ll be sure to pass along your appreciation to Sayadi — he’ll be happy to know his support made a difference! Thanks again for your trust and recommendation; we’re grateful to have you as part of our trading community.
Ivan Privalov
602
Ivan Privalov 2025.10.04 08:59 
 

The Trend Screener is agreat tool. I use it in one my first Tab to overview the Market state of many assets. I onlso use it per chart as a one liner to provide me the state of the actual Asset's market [buy/sell per timeframe + overall trend]. What I really need for the oneliner solo asset display is a possibility to display the CSM as a oneliner also [one row with many collumns instead of the default one column of many rows]. Thank you!

STE S.S.COMPANY
304899
開発者からの返信 Sayadi Achraf 2025.10.04 23:36
Thank you so much for your kind words and detailed feedback! We’re really glad to hear that you’re finding the Trend Screener helpful for both market overviews and per-asset analysis.
Your suggestion about displaying the CSM as a single-row, multi-column layout for the one-liner view is an excellent idea. It makes perfect sense for users who prefer a more compact and at-a-glance display. We’ve noted this feature request and will definitely consider adding it in a future update.
Thanks again for taking the time to share your experience and ideas — it helps us keep improving!
Always Winning
157
Always Winning 2025.09.18 18:00 
 

Sayadi has built some excellent tools. If you combine his trend predictor with other indicators such as support and resistance, supply and demand, and indecision breaks, you’re well equipped for the markets. Beyond the tools, Sayadi himself is very responsive and supportive. I highly recommend his tools any day. >>>>can we rate more than 5 stars?

STE S.S.COMPANY
304899
開発者からの返信 Sayadi Achraf 2025.09.19 16:53
Thank you so much for your kind words and thoughtful feedback! 🌟 I’m thrilled to hear that the tools are helping you navigate the markets with confidence, especially when combined with strategies like support/resistance. Your appreciation truly means a lot, and I’ll continue working hard to provide even more value. As for more than 5 stars… I wish that were possible too! ⭐⭐⭐⭐⭐+ Thanks again for your trust and support—it makes all the difference.
mattari4201
76
mattari4201 2025.07.19 14:53 
 

Thank you very much for providing such excellent indicators. I have been using both Support and Resistance Screener Pro MT5 and Trend Screener Pro MT5, and I find them extremely helpful for identifying entry points with clarity and confidence.

STE S.S.COMPANY
304899
開発者からの返信 Sayadi Achraf 2025.07.20 13:26
Here's a professional and appreciative reply you can use: --- Thank you so much for your kind words and positive feedback! We're thrilled to hear that both the Support and Resistance Screener Pro MT5 and Trend Screener Pro MT5 are helping you identify entry points with clarity and confidence. Your support means a lot to us, and we’re committed to continuing to provide tools that add real value to your trading. Wishing you continued success in the markets!
wexcley
103
wexcley 2025.07.17 18:34 
 

boa tarde, comprei ontem tres indicadores teus devido a todo elogio q tem neles aqui comentário, são eles Trend Line MAP PRO Support & Resistance Screener trend screener pro vi muito potencial e neles e queria saber se possível vc liberar o modulo de integração deles para teste estou criando uma EA para operar os mesmo. pode me ajudar nessa questão?

Fabio Quantumless
367
Fabio Quantumless 2025.07.15 11:24 
 

pratically unsuable even set up not smooth and get stuck all time

updated after session he solved my problem, thank you

STE S.S.COMPANY
304899
開発者からの返信 Sayadi Achraf 2025.07.15 12:09
Hi sir, Thank you for your review. Please can you check your private message ? I will assist you how to setup the indicator properly in your metatrader. The indicator is used bu a lot of customers and i will not stuck for you. I will assist you via zoom meeting how to solve this issue sir.
Ottaviano De Cicco
4542
Ottaviano De Cicco 2025.07.07 10:26 
 

Great logic, solid coding. For sure one of the best indicators around. I am sure that customers would benefit from a full automatic / semi-automatic / manual EA to open/ manage/ close trades. This would bring the indicator and its performance to a different level.

STE S.S.COMPANY
304899
開発者からの返信 Sayadi Achraf 2025.07.07 13:20
Thank you so much for the positive feedback! We're really glad to hear you’re enjoying the indicator and finding the logic and coding solid. Your suggestion about integrating it into an EA (Expert Advisor) with full, semi, or manual trade management is a great one. and definitely something worth exploring to take the tool to the next level. We appreciate your insight and will keep this in mind for future development. Thanks again for your support!
Nicholas
71
Nicholas 2025.06.23 07:55 
 

Fantastic indicator. Support is top notch. I integrated this indicator with my own EA. Took a bit to figure out exactly how to do this, but Sayadi and his team has been fantastic to clarify integration. It is now integrated and working like a charm. Thanks Sayadi and team!

STE S.S.COMPANY
304899
開発者からの返信 Sayadi Achraf 2025.06.24 00:54
Thank you so much for the kind words! We're thrilled to hear that the indicator is working smoothly with you. It’s great to know that the team was able to support you . Your feedback means a lot to us, and we're always here if you need anything in the future. Happy trading! 🚀
Amani Skhiri
26
Amani Skhiri 2025.06.19 23:33 
 

The indicator I found has an impressive range of functions that offer endless possibilities for trend analysis. It includes trend currency strength meter, Reversal signals, strong trend signals, and Road features, among others. I'm grateful to have discovered it. The trend screener features have been particularly helpful for all my strategies. Moreover, the user support and communication are excellent from the seller.

STE S.S.COMPANY
304899
開発者からの返信 Sayadi Achraf 2025.06.20 12:59
Here's a professional and appreciative response you can use: --- Thank you so much for your thoughtful and detailed review! We're thrilled to hear that you’re finding the indicator’s features—like the trend currency strength meter, reversal and strong trend signals, and the Road features—so valuable in your analysis. It’s great to know that the trend screener has been especially useful across your strategies. We also appreciate your kind words about our support and communication—it means a lot. We're committed to continuing to provide powerful tools and excellent service to support your trading success!
レビューに返信