RelicusRoad Pro MT5
- インディケータ
- バージョン: 2.293
- アップデート済み: 16 2月 2026
- アクティベーション: 15

RelicusRoad Pro: 定量的市場オペレーティングシステム
【期間限定】無制限アクセス 70% OFF - 2,000人超のトレーダーと共に
なぜ多くのトレーダーは「完璧な」インジケーターを使っても失敗するのでしょうか?
それは、文脈を無視して単一の概念だけでトレードしているからです。文脈のないシグナルは単なるギャンブルです。勝ち続けるには、根拠の重なり(コンフルエンス)が必要です。
RelicusRoad Proは単なる矢印インジケーターではありません。完全な定量的市場エコシステムです。独自のボラティリティモデリングを用いて、価格が推移する「適正価値の道(Fair Value Road)」をマッピングし、ノイズと真の構造的ブレイクを判別します。
推測はやめましょう。機関投資家レベルの「ロード・ロジック」でトレードを。
コアエンジン:「Road」アルゴリズム
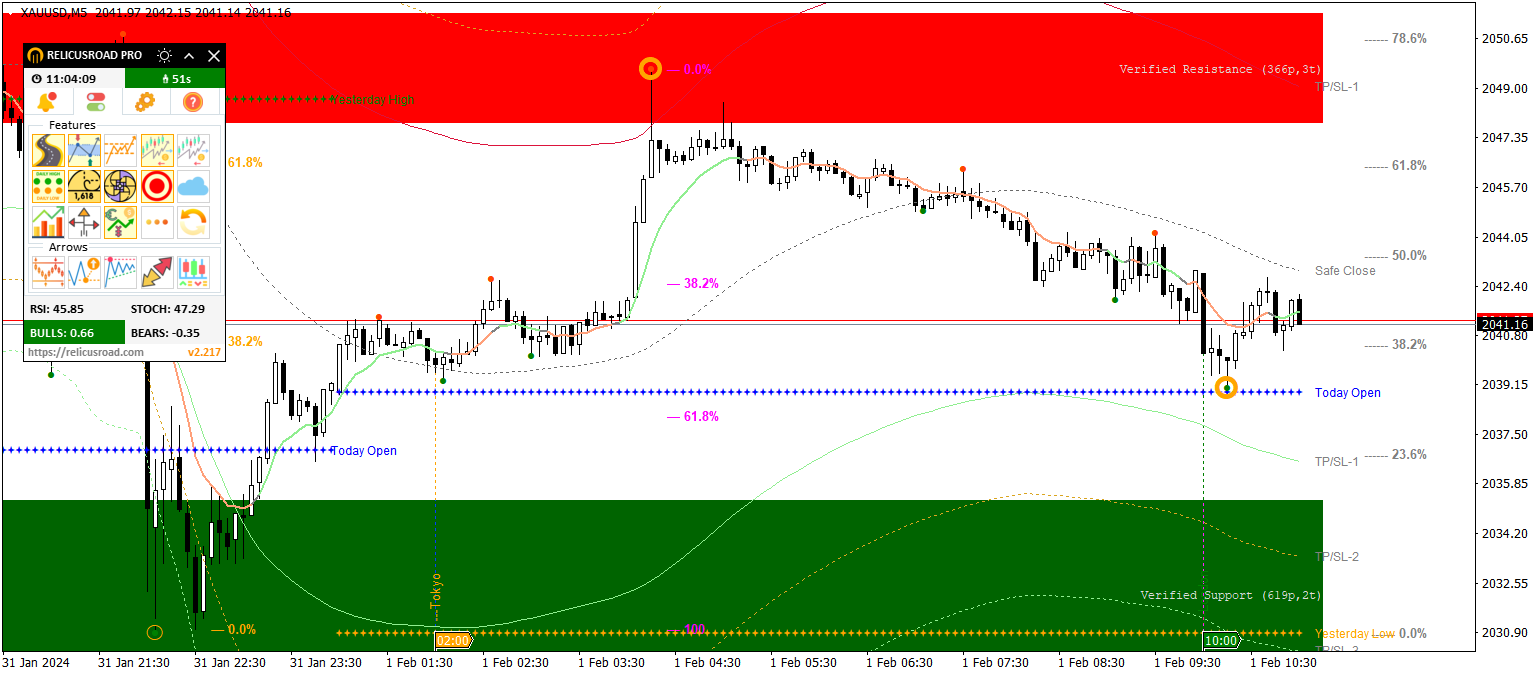
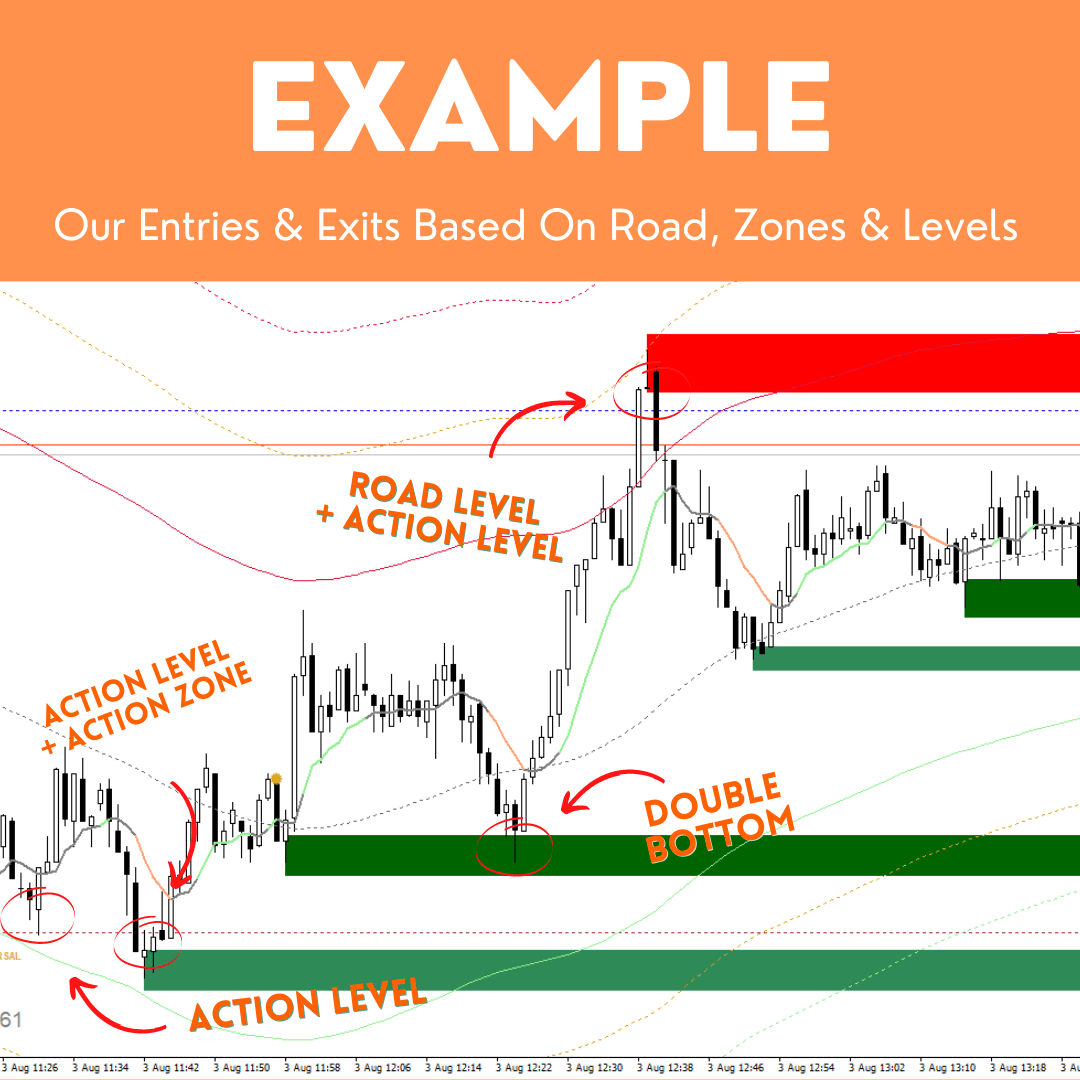
システムの中心となる Road Algo は、市場環境にリアルタイムで適応するダイナミックなボラティリティチャネルです。安全ライン(平衡点)と、価格が数学的に反転しやすい拡張レベルを投影します。
- Simple Road: 標準的な市場向けの構造マッピング。
- Smooth Road: 保ち合い相場向けのノイズ低減計算。
- Breakout Road: ボラティリティの拡大と爆発的な動きを識別。
1. アルゴリズムによる勢いと確認
当社の「スキャルピング矢印」は単なるクロスオーバーではありません。高次多項式ロジックを利用してノイズをフィルタリングし、主要サイクルと一致させます。勢い、プライスアクション、ロード構造が収束する正確なエントリーポイントを検出します。
2. 定量的分析スイート
通常はヘッジファンドしか利用できない高度な数学モデルにアクセス。統計的外れ値検出、再帰的状態推定、分形分析が含まれます。
特典:マニュアル + 7つの実証済み戦略 + ビデオトレーニング + 限定コミュニティ
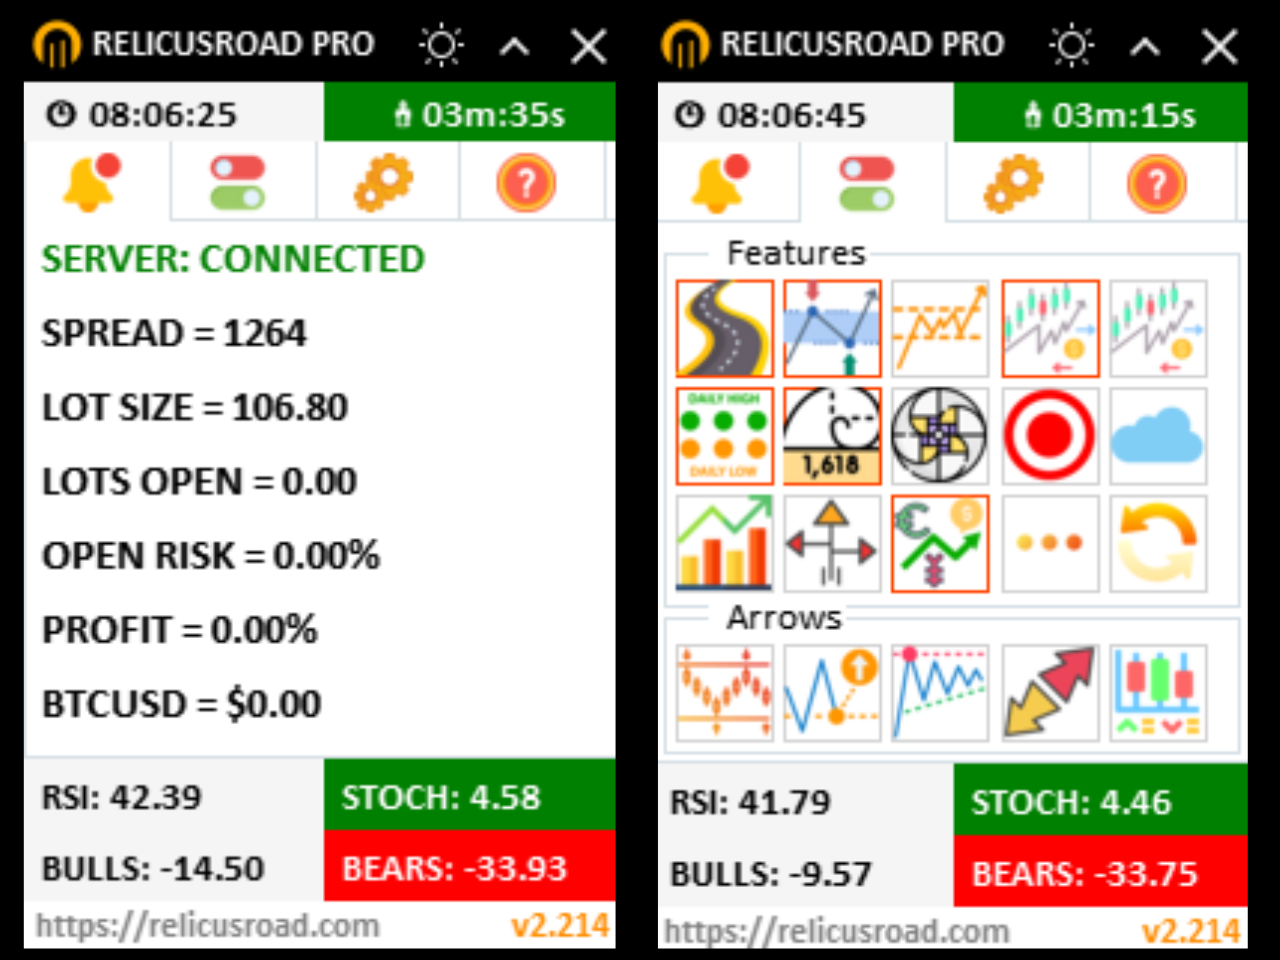
搭載機能リスト(19-in-1 パワーハウス)
- 検証済みオーダーフロー: 機関投資家のオーダーブロック、フェアバリューギャップ(FVG)、SMC流動性を自動描画。
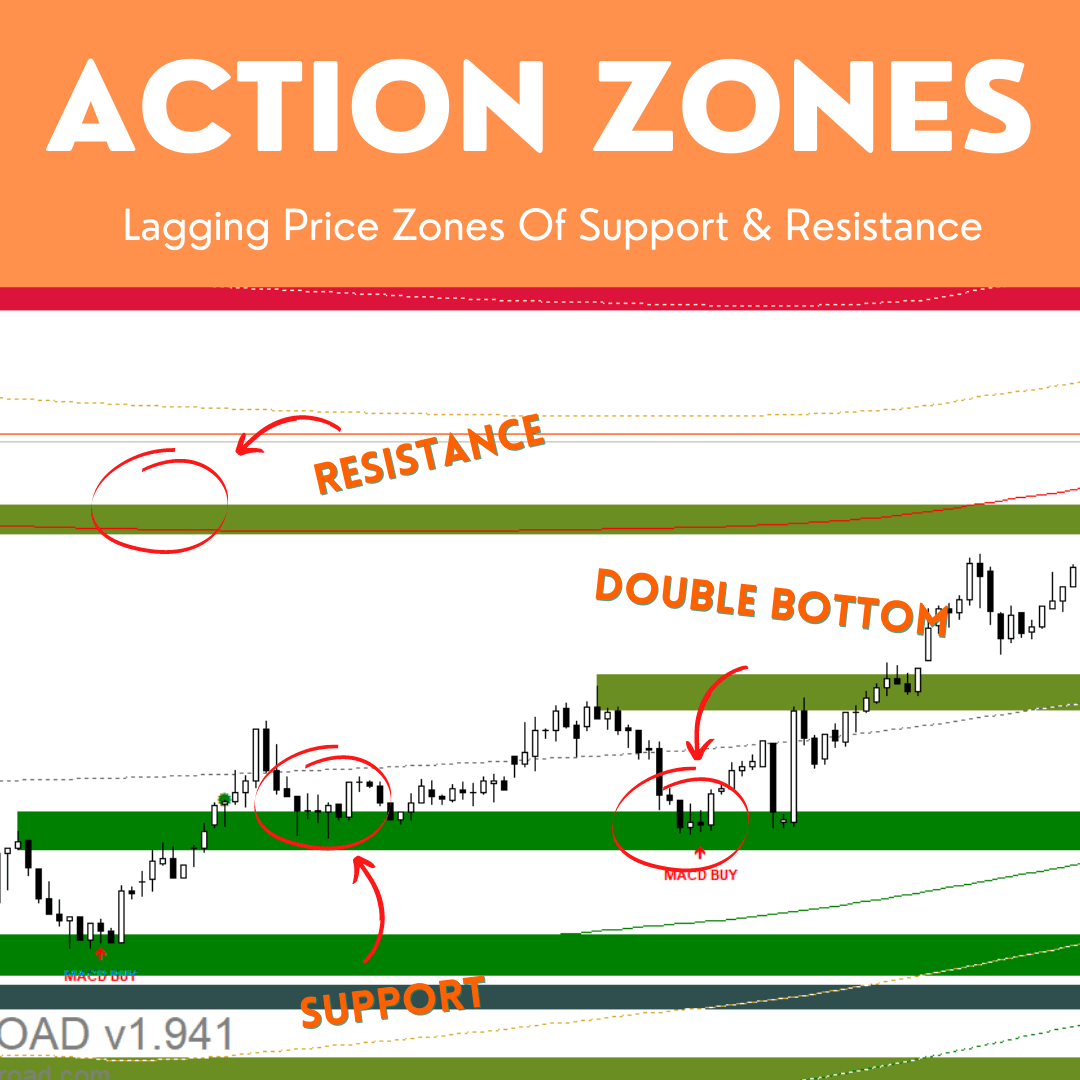
- スマート・サポート&レジスタンス: 「検証済み」「転換済み」「未テスト」と等級付けされる分形ベースのゾーニング。
- 分析スキャナー: 7モードのマルチ戦略スキャナー(MACD、反転、トレンドなど)。
- トレンドクラウド: 動的な支え・抵抗として機能する視覚的なデュアルEMAバイアスフィルター。
- 先行指標: 当日高値/安値の投影と、フィボナッチベースのピボットレベル。
- パターン認識: 10種類以上のローソク足パターンを自動スキャンし、勝率でフィルタリング。
- ダイナミック・スイング: 正確な損切り設定のための構造的な高値/安値を特定。
- セッションマップ: アジア、ロンドン、ニューヨーク市場を可視化。
プロ仕様のリスク管理パネル
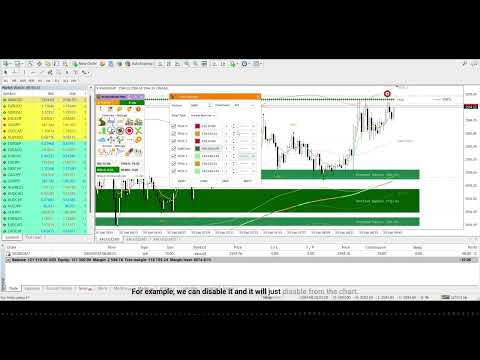
資金を守るためのインフォパネル。スプレッド、ロット数、リスクを一瞬で確認。
「トレード人生で最高の投資。コミュニティだけでも価格以上の価値があります。」 — 認証済みユーザー
ユニバーサル・プラットフォーム
1つのライセンスで、MT4/MT5両方でシームレスに動作します。
「購入」をクリックして、今日から定量的トレードへアップグレードしましょう


Hello, can you help me get the User Guide + Strategies + Tutorials + VIP Private Group + Mobile Version? I would be very grateful )))