Rainbow Price Visualizer
- インディケータ
-
Vincent Jose Proenca
 私はトレーダーとして10年以上の経験があり、主にCFDを専門としています。トレーディングの魅力は、論理性・規律・そして意思決定を簡単にするツールを作り出すことにあります。自分の手法に合うインジケーターが見つからなかったため、必要に迫られて自作を始め、次第にそれが楽しみになりました。
最初に開発したツールの一部は、Custom Box と Daily Bar Number です。これらのインジケーターは理論上の試作品ではなく、日常使用を目的に設計され、実際の市場環境でテスト・改良を重ねてきました。その結果、実用的で統合しやすく、情報過多に陥ることなく素早い判断を支援するツールが生まれました。 - バージョン: 1.21
- アップデート済み: 12 10月 2025
- アクティベーション: 5
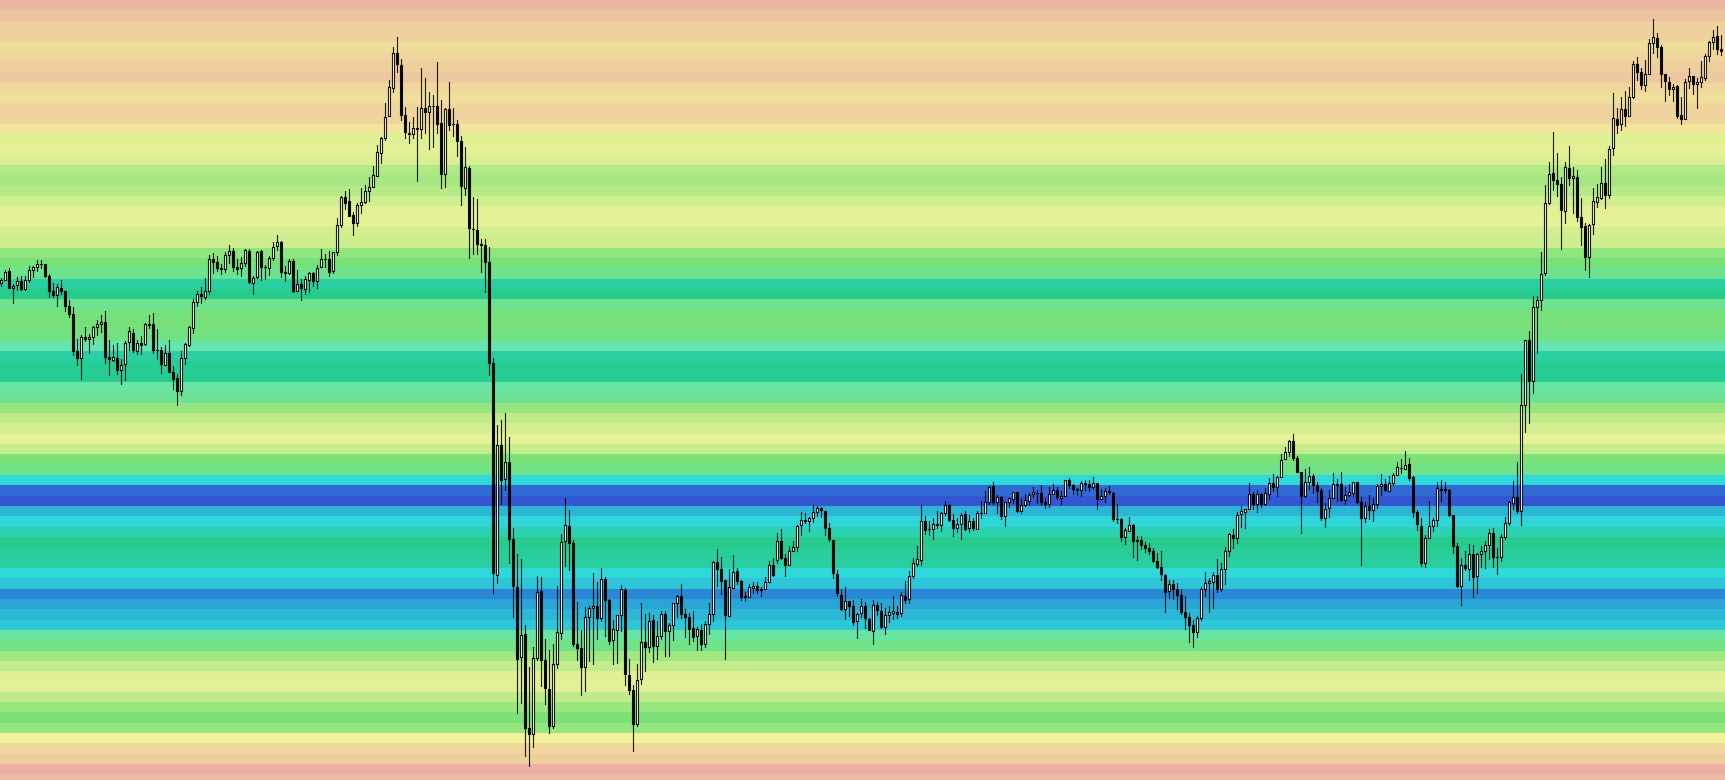
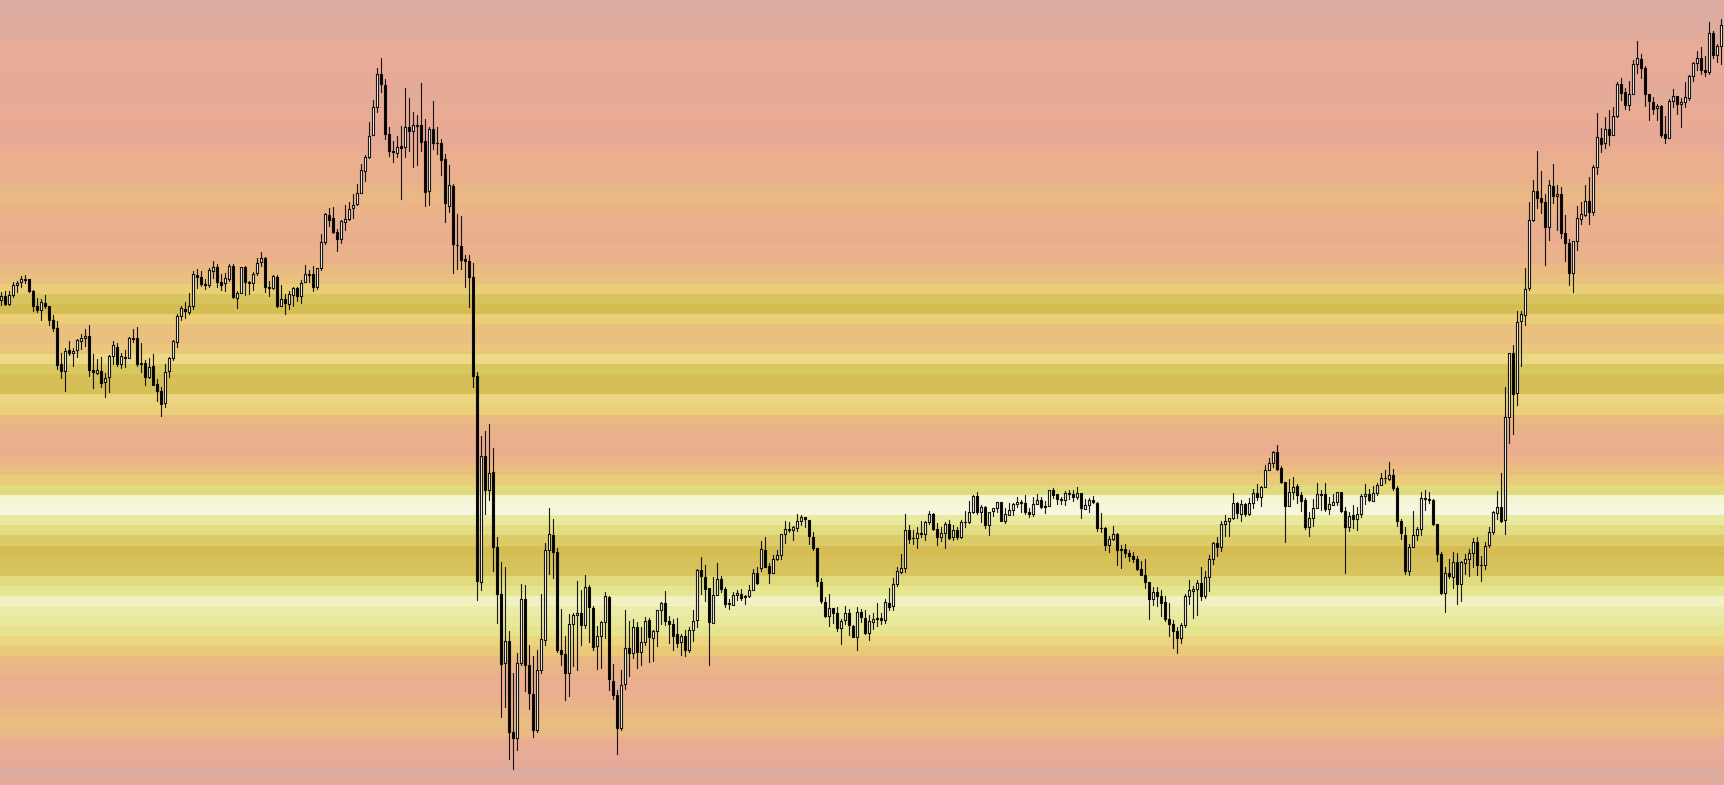
Rainbow Price Visualizer v1.21
See where the market really breathes.
Turns your MT4 chart into an ultra-precise heatmap that highlights price zones favored by big players.
Why it matters
-
300 price levels at 0.2‑pip resolution — microscopic detail.
-
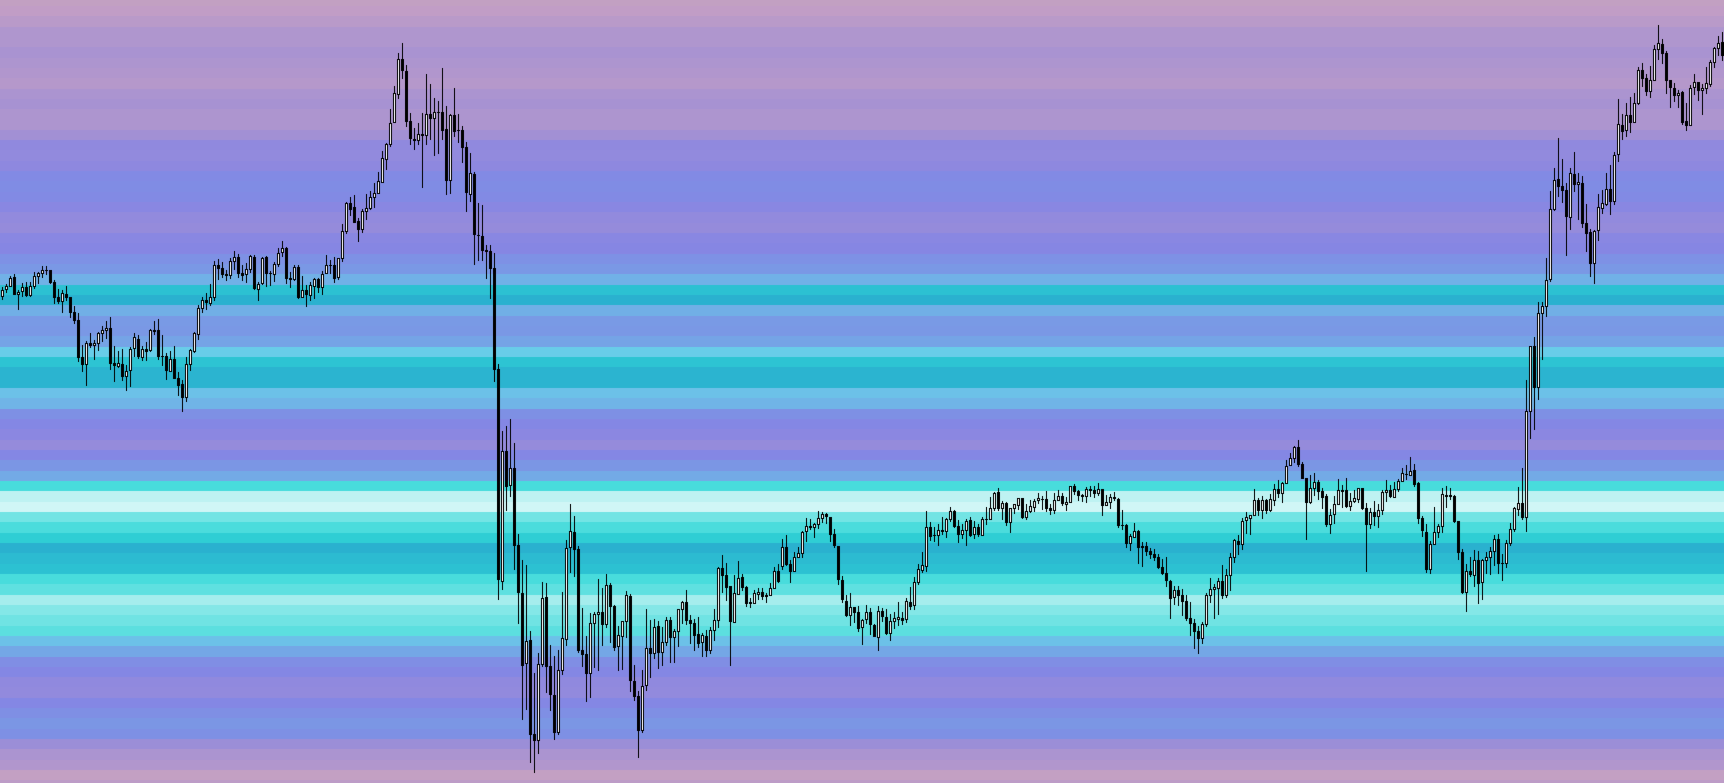
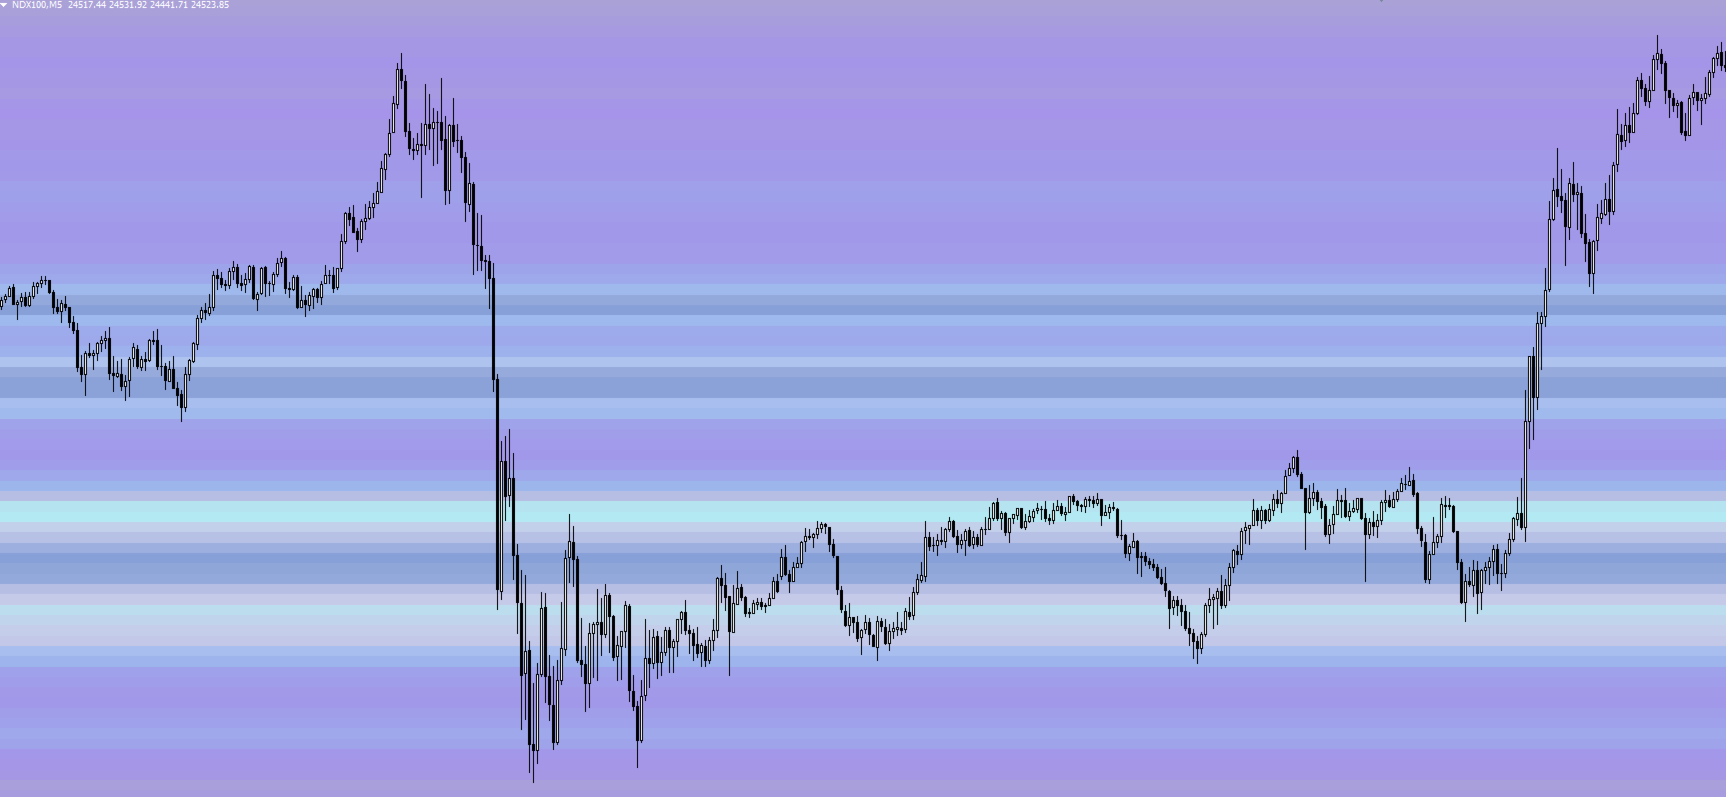
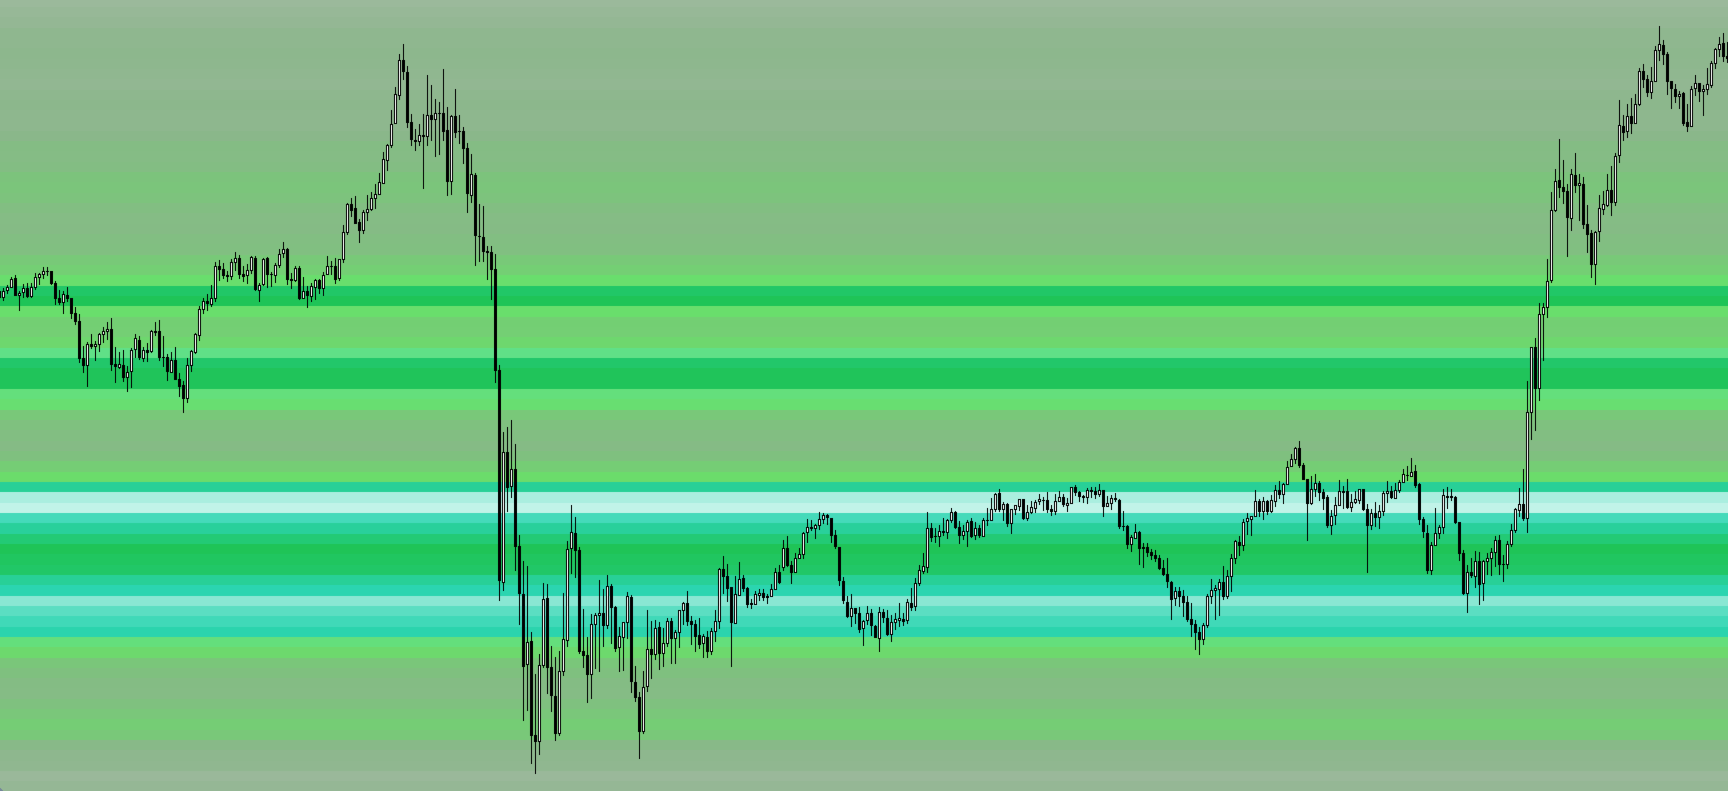
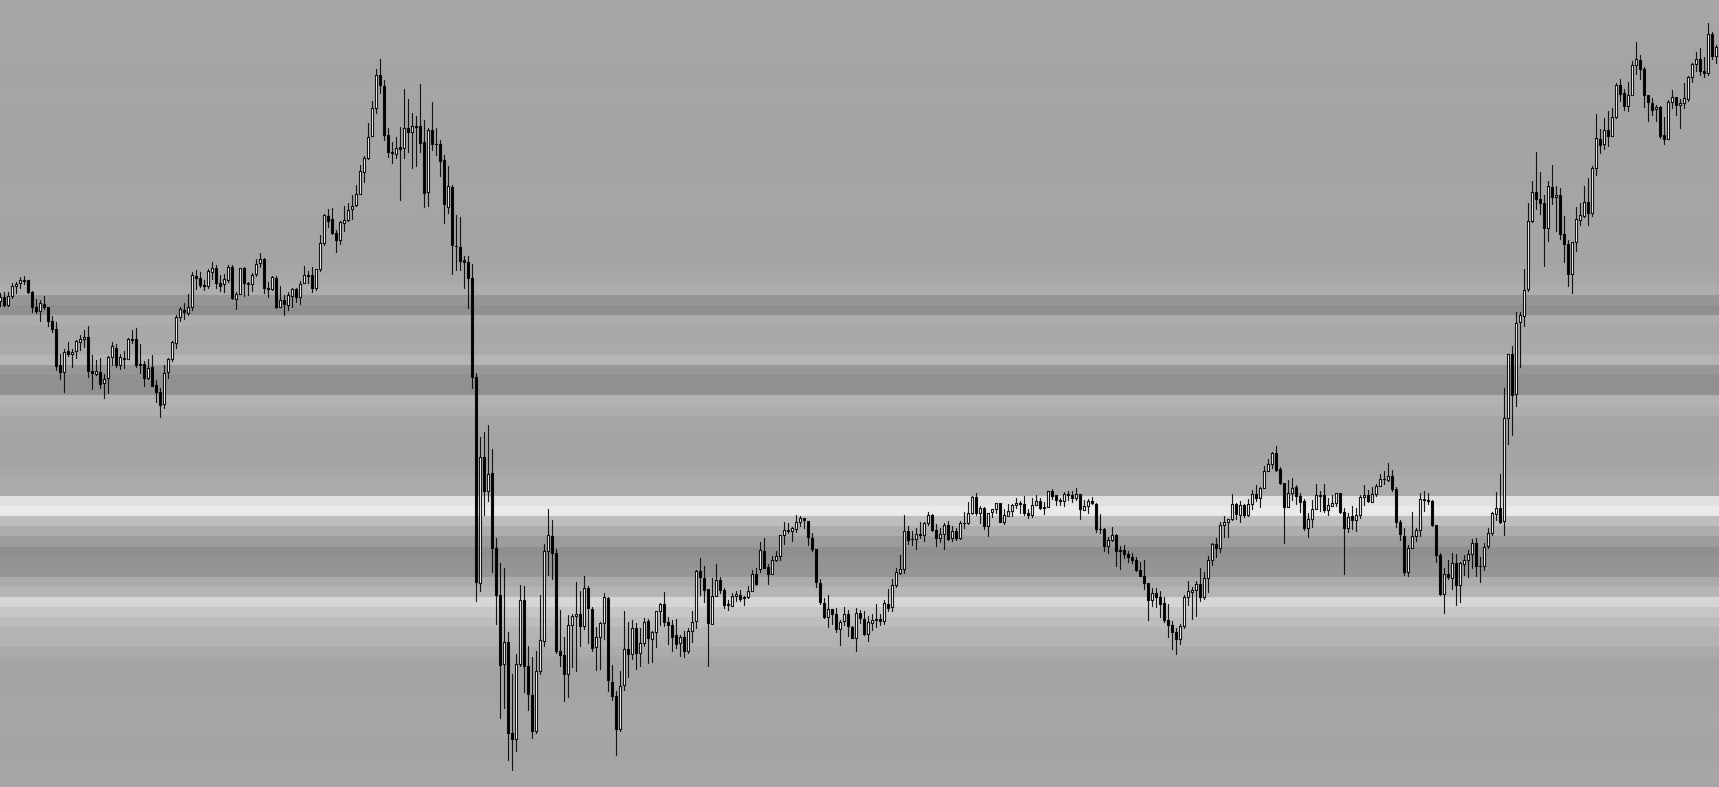
8 visual themes (Rainbow, Fire, Ocean…) for instant readibility.
-
Smart opacity: low noise fades, real zones pop.
-
Lightweight rendering with automatic cleanup.
-
Fully customizable: saturation, opacity, resolution, history depth.
-
Bands project into the future to spot looming S/R.
Use it to
-
Pinpoint professional support/resistance.
-
Track institutional footprints and volume-by-price patterns.
-
Locate high-probability reversal zones.
Short, sharp, slightly uncanny.