Dynamic Pivot Zones
- インディケータ
-
Vincent Jose Proenca
 私はトレーダーとして10年以上の経験があり、主にCFDを専門としています。トレーディングの魅力は、論理性・規律・そして意思決定を簡単にするツールを作り出すことにあります。自分の手法に合うインジケーターが見つからなかったため、必要に迫られて自作を始め、次第にそれが楽しみになりました。
最初に開発したツールの一部は、Custom Box と Daily Bar Number です。これらのインジケーターは理論上の試作品ではなく、日常使用を目的に設計され、実際の市場環境でテスト・改良を重ねてきました。その結果、実用的で統合しやすく、情報過多に陥ることなく素早い判断を支援するツールが生まれました。 - バージョン: 1.0
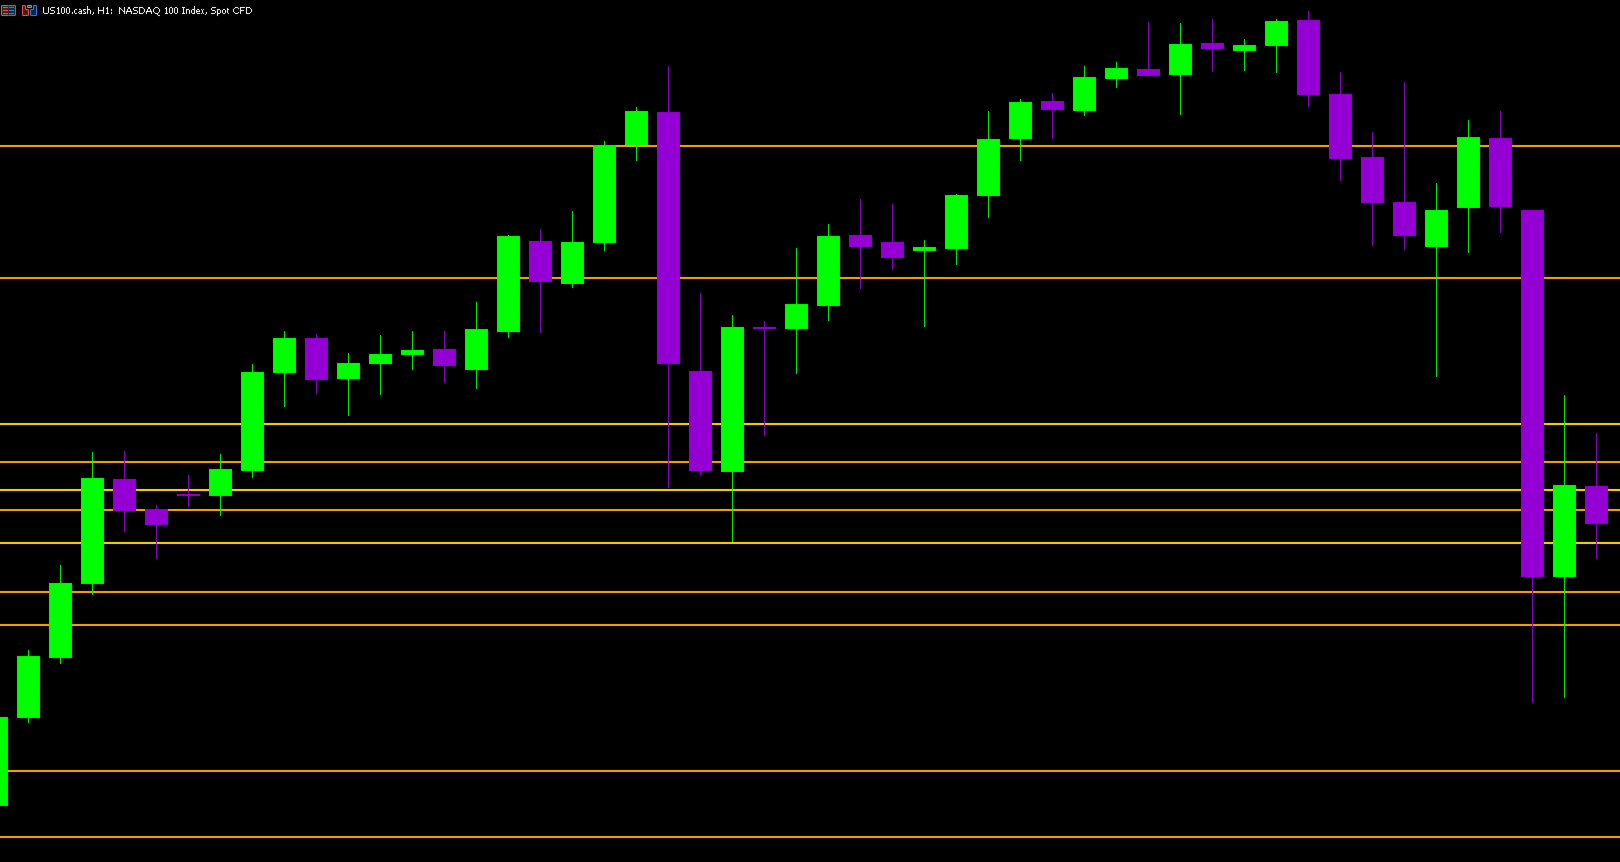
Dynamic Pivot Zones – Your Level Assistant on the Chart
This indicator is a bit like a GPS for your trading. It shows you where the price likes to hang out, where it gets nervous, and where it flies through. No more calculating pivots by hand or guessing support and resistance levels.
What it does:
-
Automatically plots H1, H4, and D1 pivots.
-
Shows support and resistance zones: R1, R2, S1, S2.
-
Lines are colored and easy to read, so you can instantly see what’s hot or cold.
Why you’ll love it:
-
Drop the indicator on your chart, and bam – it comes alive.
-
No more spending hours hunting for key levels.
-
You instantly see where the price might bounce or break.
It’s simple, effective, and gives you a serious helping hand for your trades.