
DoEasyライブラリでのその他のクラス(第69部): チャットオブジェクトコレクションクラス

内容
概念
チャートオブジェクトを操作するための機能は既に準備しました。現在はチャートウィンドウオブジェクトのリストを含むチャートオブジェクトがあり、これには、それらに接続された指標のリストが含まれています。これを単一のチャートオブジェクトコレクションに組み合わせて、ターミナルで開いているチャートに簡単にアクセスできるようにします。このコレクションを使用すると、任意のプロパティによってチャートオブジェクトリストを検索、並べ替え、取得し、選択したチャートまたは複数のチャートを簡単に処理できます。
ライブラリクラスの改善
まず、新しいメッセージをライブラリに追加しましょう。
\MQL5\Include\DoEasy\Data.mqhに、新しいメッセージインデックスを追加します。
   MSG_CHART_OBJ_CHART_WINDOW,                        // Main chart window
   MSG_CHART_OBJ_CHART_SUBWINDOW,                     // Chart subwindow
   MSG_CHART_OBJ_CHART_SUBWINDOWS_NUM,                // Subwindows
   MSG_CHART_OBJ_INDICATORS_MW_NAME_LIST,             // Indicators in the main chart window
   MSG_CHART_OBJ_INDICATORS_SW_NAME_LIST,             // Indicators in the chart window
   MSG_CHART_OBJ_INDICATOR,                           // Indicator
   MSG_CHART_OBJ_INDICATORS_TOTAL,                    // Indicators
   MSG_CHART_OBJ_WINDOW_N,                            // Window
   MSG_CHART_OBJ_INDICATORS_NONE,                     // No indicators

//--- CChartObjCollection
   MSG_CHART_COLLECTION_TEXT_CHART_COLLECTION,        // Chart collection
   MSG_CHART_COLLECTION_ERR_FAILED_CREATE_CHART_OBJ,  // Failed to create a new chart object
   MSG_CHART_COLLECTION_ERR_FAILED_ADD_CHART,         // Failed to add a chart object to the collection

  };
//+------------------------------------------------------------------+
新しく追加したインデックスに対応するメッセージテキストも追加します。
   {"Главное окно графика","Main chart window"},
   {"Подокно графика","Chart subwindow"},
   {"Подокон","Subwindows"},
   {"Индикаторы в главном окне графика","Indicators in the main chart window"},
   {"Индикаторы в окне графика","Indicators in the chart window"},
   {"Индикатор","Indicator"},
   {"Индикаторов","Indicators total"},
   {"Окно","Window"},
   {"Отсутствуют","No indicators"},

//--- CChartObjCollection
   {"Коллекция чартов","Chart collection"},
   {"Не удалось создать новый объект-чарт","Failed to create new chart object"},
   {"Не удалось добавить объект-чарт в коллекцию","Failed to add chart object to collection"},

  };
//+---------------------------------------------------------------------+
チャートオブジェクトコレクションは、開いているチャートの数の変化と、各チャートで開いているウィンドウの数の変化を追跡して、チャートとその中で開いているウィンドウのリストを迅速に更新する必要があります。一部の変更は、OnChartEvent()ハンドラで追跡できます。ただし、テストによると、ハンドラは主に、チャートに特定の変更が加えられたことを指定します(チャート変更イベント(CHARTEVENT_CHART_CHANGE)。つまり、ここには詳細はありません。したがって、プログラムタイマーで作業し、開いているチャートとウィンドウの数の変化を追跡します。チャートで発生する可能性のあるその他の変更は、上記のOnChartEvent()ハンドラを介して、またはCBaseObjExtライブラリオブジェクトからチャートオブジェクトとチャートウィンドウオブジェクトを継承することによって追跡できます。これは、すべてのCBaseObjライブラリオブジェクトの基本オブジェクトの子孫であり、その子孫オブジェクトに追加のイベント機能を提供します。これは、後でチャートを操作するためにこのような機能が必要になる場合に必要です。
チャートは主に半自動モードで処理されます。したがって、開いているチャートとウィンドウの数の変化を定義するには、現在のチャートとウィンドウの数を前の数と1秒間に2回比較して確認するだけで十分です。変更がなかった場合は、何もする必要はありません。ウィンドウとチャートの数に変更があった場合は、コレクション内のデータを更新します。
チャートオブジェクトをタイマーで機能させるには、さらに別のチャートオブジェクトコレクションタイマーカウンタが必要になります。タイマーで動作する各コレクションには、指定されたコレクションの更新頻度を追跡する独自のタイマーカウンタがあります。各オブジェクトコレクションが独自のIDを備えていて、特定のオブジェクトリストが属するコレクションを定義できるため、カウンタパラメータとは別に、新しいコレクションIDを追加する必要があります。
\MQL5\Include\DoEasy\Defines.mqhの[マクロ置換]セクションで、チャートオブジェクトコレクションタイマーカウンタのパラメータとチャートオブジェクトコレクションリストのIDを設定します。
//+------------------------------------------------------------------+
//| Macro substitutions                                              |
//+------------------------------------------------------------------+
//--- Describe the function with the error line number
#define DFUN_ERR_LINE                  (__FUNCTION__+(TerminalInfoString(TERMINAL_LANGUAGE)=="Russian" ? ", Page " : ", Line ")+(string)__LINE__+": ")
#define DFUN                           (__FUNCTION__+": ")        // "Function description"
#define COUNTRY_LANG                   ("Russian")                // Country language
#define END_TIME                       (D'31.12.3000 23:59:59')   // End date for account history data requests
#define TIMER_FREQUENCY                (16)                       // Minimal frequency of the library timer in milliseconds
#define TOTAL_TRADE_TRY                (5)                        // Default number of trading attempts
#define IND_COLORS_TOTAL               (64)                       // Maximum possible number of indicator buffer colors
#define IND_BUFFERS_MAX                (512)                      // Maximum possible number of indicator buffers
//--- Standard sounds
#define SND_ALERT                      "alert.wav"
#define SND_ALERT2                     "alert2.wav"
#define SND_CONNECT                    "connect.wav"
#define SND_DISCONNECT                 "disconnect.wav"
#define SND_EMAIL                      "email.wav"
#define SND_EXPERT                     "expert.wav"
#define SND_NEWS                       "news.wav"
#define SND_OK                         "ok.wav"
#define SND_REQUEST                    "request.wav"
#define SND_STOPS                      "stops.wav"
#define SND_TICK                       "tick.wav"
#define SND_TIMEOUT                    "timeout.wav"
#define SND_WAIT                       "wait.wav"
//--- Parameters of the orders and deals collection timer
#define COLLECTION_ORD_PAUSE           (250)                      // Orders and deals collection timer pause in milliseconds
#define COLLECTION_ORD_COUNTER_STEP    (16)                       // Increment of the orders and deals collection timer counter
#define COLLECTION_ORD_COUNTER_ID      (1)                        // Orders and deals collection timer counter ID
//--- Parameters of the account collection timer
#define COLLECTION_ACC_PAUSE           (1000)                     // Account collection timer pause in milliseconds
#define COLLECTION_ACC_COUNTER_STEP    (16)                       // Account timer counter increment
#define COLLECTION_ACC_COUNTER_ID      (2)                        // Account timer counter ID
//--- Symbol collection timer 1 parameters
#define COLLECTION_SYM_PAUSE1          (100)                      // Pause of the symbol collection timer 1 in milliseconds (for scanning market watch symbols)
#define COLLECTION_SYM_COUNTER_STEP1   (16)                       // Increment of the symbol timer 1 counter
#define COLLECTION_SYM_COUNTER_ID1     (3)                        // Symbol timer 1 counter ID
//--- Symbol collection timer 2 parameters
#define COLLECTION_SYM_PAUSE2          (300)                      // Pause of the symbol collection timer 2 in milliseconds (for events of the market watch symbol list)
#define COLLECTION_SYM_COUNTER_STEP2   (16)                       // Increment of the symbol timer 2 counter
#define COLLECTION_SYM_COUNTER_ID2     (4)                        // Symbol timer 2 counter ID
//--- Trading class timer parameters
#define COLLECTION_REQ_PAUSE           (300)                      // Trading class timer pause in milliseconds
#define COLLECTION_REQ_COUNTER_STEP    (16)                       // Trading class timer counter increment
#define COLLECTION_REQ_COUNTER_ID      (5)                        // Trading class timer counter ID
//--- Parameters of the timeseries collection timer
#define COLLECTION_TS_PAUSE            (64)                       // Timeseries collection timer pause in milliseconds
#define COLLECTION_TS_COUNTER_STEP     (16)                       // Account timer counter increment
#define COLLECTION_TS_COUNTER_ID       (6)                        // Timeseries timer counter ID
//--- Parameters of the timer of indicator data timeseries collection
#define COLLECTION_IND_TS_PAUSE        (64)                       // Pause of the timer of indicator data timeseries collection in milliseconds
#define COLLECTION_IND_TS_COUNTER_STEP (16)                       // Increment of indicator data timeseries timer counter
#define COLLECTION_IND_TS_COUNTER_ID   (7)                        // ID of indicator data timeseries timer counter
//--- Parameters of the tick series collection timer
#define COLLECTION_TICKS_PAUSE         (64)                       // Tick series collection timer pause in milliseconds
#define COLLECTION_TICKS_COUNTER_STEP  (16)                       // Tick series timer counter increment step
#define COLLECTION_TICKS_COUNTER_ID    (8)                        // Tick series timer counter ID
//--- Parameters of the chart collection timer
#define COLLECTION_CHARTS_PAUSE        (500)                      // Chart collection timer pause in milliseconds
#define COLLECTION_CHARTS_COUNTER_STEP (16)                       // Chart timer counter increment
#define COLLECTION_CHARTS_COUNTER_ID   (9)                        // Chart timer counter ID
//--- Collection list IDs
#define COLLECTION_HISTORY_ID          (0x777A)                   // Historical collection list ID
#define COLLECTION_MARKET_ID           (0x777B)                   // Market collection list ID
#define COLLECTION_EVENTS_ID           (0x777C)                   // Event collection list ID
#define COLLECTION_ACCOUNT_ID          (0x777D)                   // Account collection list ID
#define COLLECTION_SYMBOLS_ID          (0x777E)                   // Symbol collection list ID
#define COLLECTION_SERIES_ID           (0x777F)                   // Timeseries collection list ID
#define COLLECTION_BUFFERS_ID          (0x7780)                   // Indicator buffer collection list ID
#define COLLECTION_INDICATORS_ID       (0x7781)                   // Indicator collection list ID
#define COLLECTION_INDICATORS_DATA_ID  (0x7782)                   // Indicator data collection list ID
#define COLLECTION_TICKSERIES_ID       (0x7783)                   // Tick series collection list ID
#define COLLECTION_MBOOKSERIES_ID      (0x7784)                   // DOM series collection list ID
#define COLLECTION_MQL5_SIGNALS_ID     (0x7785)                   // MQL5 signals collection list ID
#define COLLECTION_CHARTS_ID           (0x7786)                   // Chart collection list ID
//--- Data parameters for file operations
チャートの整数プロパティの列挙からCHART_PROP_WINDOW_IS_VISIBLE定数を削除します。これは、このプロパティをオブジェクトに実際に使用する方法が見つからないためです。整数プロパティの数が1つ減ります(67から66)。
#define CHART_PROP_INTEGER_TOTAL (66) // Total number of integer properties
オブジェクトの並べ替えプロパティを追加して、チャートオブジェクトの並べ替え基準をプロパティで修正しましょう。
//+------------------------------------------------------------------+
//| Possible chart sorting criteria                                  |
//+------------------------------------------------------------------+
#define FIRST_CHART_DBL_PROP  (CHART_PROP_INTEGER_TOTAL-CHART_PROP_INTEGER_SKIP)
#define FIRST_CHART_STR_PROP  (CHART_PROP_INTEGER_TOTAL-CHART_PROP_INTEGER_SKIP+CHART_PROP_DOUBLE_TOTAL-CHART_PROP_DOUBLE_SKIP)
enum ENUM_SORT_CHART_MODE
  {
//--- Sort by integer properties
   SORT_BY_CHART_ID = 0,                              // Sort by chart ID
   SORT_BY_CHART_TIMEFRAME,                           // Sort by chart timeframe
   SORT_BY_CHART_SHOW,                                // Sort by the price chart drawing attribute
   SORT_BY_CHART_IS_OBJECT,                           // Sort by chart object (OBJ_CHART) identification attribute
また、オブジェクトでこのプロパティを使用しないため、列挙の定数リストからSORT_BY_CHART_WINDOW_IS_VISIBLE定数を削除します。
ライブラリにコレクションが存在するすべてのオブジェクトは、さまざまなオブジェクトプロパティで並べ替えることができる独自のリストを備えています。チャートオブジェクトコレクションリストには、必要なプロパティ値を持つオブジェクトを検索および選択するための並べ替え機能もあります。このようなオブジェクトごとに、\MQL5\Include\DoEasy\Services\Select.mqhに設定された独自の並べ替えメソッドを作成します。
チャートオブジェクトの検索と並べ替えを調整するための新しいメソッドをCSelectクラスファイルに追加します。
チャートオブジェクトクラスファイルをCSelectクラスファイルにインクルードします。
//+------------------------------------------------------------------+
//| Include files                                                    |
//+------------------------------------------------------------------+
#include <Arrays\ArrayObj.mqh>
#include "..\Objects\Orders\Order.mqh"
#include "..\Objects\Events\Event.mqh"
#include "..\Objects\Accounts\Account.mqh"
#include "..\Objects\Symbols\Symbol.mqh"
#include "..\Objects\PendRequest\PendRequest.mqh"
#include "..\Objects\Series\SeriesDE.mqh"
#include "..\Objects\Indicators\Buffer.mqh"
#include "..\Objects\Indicators\IndicatorDE.mqh"
#include "..\Objects\Indicators\DataInd.mqh"
#include "..\Objects\Ticks\DataTick.mqh"
#include "..\Objects\Book\MarketBookOrd.mqh"
#include "..\Objects\MQLSignalBase\MQLSignal.mqh"
#include "..\Objects\Chart\ChartObj.mqh"
//+------------------------------------------------------------------+
クラス本体の最後で新しいメソッドを宣言します。
//+------------------------------------------------------------------+
//| Methods of working with chart data                               |
//+------------------------------------------------------------------+
   //--- Return the list of charts with one of (1) integer, (2) real and (3) string properties meeting a specified criterion
   static CArrayObj *ByChartProperty(CArrayObj *list_source,ENUM_CHART_PROP_INTEGER property,long value,ENUM_COMPARER_TYPE mode);
   static CArrayObj *ByChartProperty(CArrayObj *list_source,ENUM_CHART_PROP_DOUBLE property,double value,ENUM_COMPARER_TYPE mode);
   static CArrayObj *ByChartProperty(CArrayObj *list_source,ENUM_CHART_PROP_STRING property,string value,ENUM_COMPARER_TYPE mode);
   //--- Return the chart index with the maximum value of the (1) integer, (2) real and (3) string properties
   static int        FindChartMax(CArrayObj *list_source,ENUM_CHART_PROP_INTEGER property);
   static int        FindChartMax(CArrayObj *list_source,ENUM_CHART_PROP_DOUBLE property);
   static int        FindChartMax(CArrayObj *list_source,ENUM_CHART_PROP_STRING property);
   //--- Return the chart index with the minimum value of the (1) integer, (2) real and (3) string properties
   static int        FindChartMin(CArrayObj *list_source,ENUM_CHART_PROP_INTEGER property);
   static int        FindChartMin(CArrayObj *list_source,ENUM_CHART_PROP_DOUBLE property);
   static int        FindChartMin(CArrayObj *list_source,ENUM_CHART_PROP_STRING property);
//---
  };
//+------------------------------------------------------------------+
クラス本体の外側で実装しましょう。
//+------------------------------------------------------------------+
//| Methods of working with chart data                               |
//+------------------------------------------------------------------+
//+------------------------------------------------------------------+
//| Return the list of charts with one integer                       |
//| property meeting the specified criterion                         |
//+------------------------------------------------------------------+
CArrayObj *CSelect::ByChartProperty(CArrayObj *list_source,ENUM_CHART_PROP_INTEGER property,long value,ENUM_COMPARER_TYPE mode)
  {
   if(list_source==NULL) return NULL;
   CArrayObj *list=new CArrayObj();
   if(list==NULL) return NULL;
   list.FreeMode(false);
   ListStorage.Add(list);
   int total=list_source.Total();
   for(int i=0; i<total; i++)
     {
      CChartObj *obj=list_source.At(i);
      if(!obj.SupportProperty(property)) continue;
      long obj_prop=obj.GetProperty(property);
      if(CompareValues(obj_prop,value,mode)) list.Add(obj);
     }
   return list;
  }
//+------------------------------------------------------------------+
//| Return the list of charts with one real                          |
//| property meeting the specified criterion                         |
//+------------------------------------------------------------------+
CArrayObj *CSelect::ByChartProperty(CArrayObj *list_source,ENUM_CHART_PROP_DOUBLE property,double value,ENUM_COMPARER_TYPE mode)
  {
   if(list_source==NULL) return NULL;
   CArrayObj *list=new CArrayObj();
   if(list==NULL) return NULL;
   list.FreeMode(false);
   ListStorage.Add(list);
   for(int i=0; i<list_source.Total(); i++)
     {
      CChartObj *obj=list_source.At(i);
      if(!obj.SupportProperty(property)) continue;
      double obj_prop=obj.GetProperty(property);
      if(CompareValues(obj_prop,value,mode)) list.Add(obj);
     }
   return list;
  }
//+------------------------------------------------------------------+
//| Return the list of charts with one string                        |
//| property meeting the specified criterion                         |
//+------------------------------------------------------------------+
CArrayObj *CSelect::ByChartProperty(CArrayObj *list_source,ENUM_CHART_PROP_STRING property,string value,ENUM_COMPARER_TYPE mode)
  {
   if(list_source==NULL) return NULL;
   CArrayObj *list=new CArrayObj();
   if(list==NULL) return NULL;
   list.FreeMode(false);
   ListStorage.Add(list);
   for(int i=0; i<list_source.Total(); i++)
     {
      CChartObj *obj=list_source.At(i);
      if(!obj.SupportProperty(property)) continue;
      string obj_prop=obj.GetProperty(property);
      if(CompareValues(obj_prop,value,mode)) list.Add(obj);
     }
   return list;
  }
//+------------------------------------------------------------------+
//| Return the chart index in the list                               |
//| with the maximum integer property value                          |
//+------------------------------------------------------------------+
int CSelect::FindChartMax(CArrayObj *list_source,ENUM_CHART_PROP_INTEGER property)
  {
   if(list_source==NULL) return WRONG_VALUE;
   int index=0;
   CChartObj *max_obj=NULL;
   int total=list_source.Total();
   if(total==0) return WRONG_VALUE;
   for(int i=1; i<total; i++)
     {
      CChartObj *obj=list_source.At(i);
      long obj1_prop=obj.GetProperty(property);
      max_obj=list_source.At(index);
      long obj2_prop=max_obj.GetProperty(property);
      if(CompareValues(obj1_prop,obj2_prop,MORE)) index=i;
     }
   return index;
  }
//+------------------------------------------------------------------+
//| Return the chart index in the list                               |
//| with the maximum real property value                             |
//+------------------------------------------------------------------+
int CSelect::FindChartMax(CArrayObj *list_source,ENUM_CHART_PROP_DOUBLE property)
  {
   if(list_source==NULL) return WRONG_VALUE;
   int index=0;
   CChartObj *max_obj=NULL;
   int total=list_source.Total();
   if(total==0) return WRONG_VALUE;
   for(int i=1; i<total; i++)
     {
      CChartObj *obj=list_source.At(i);
      double obj1_prop=obj.GetProperty(property);
      max_obj=list_source.At(index);
      double obj2_prop=max_obj.GetProperty(property);
      if(CompareValues(obj1_prop,obj2_prop,MORE)) index=i;
     }
   return index;
  }
//+------------------------------------------------------------------+
//| Return the chart index in the list                               |
//| with the maximum string property value                           |
//+------------------------------------------------------------------+
int CSelect::FindChartMax(CArrayObj *list_source,ENUM_CHART_PROP_STRING property)
  {
   if(list_source==NULL) return WRONG_VALUE;
   int index=0;
   CChartObj *max_obj=NULL;
   int total=list_source.Total();
   if(total==0) return WRONG_VALUE;
   for(int i=1; i<total; i++)
     {
      CChartObj *obj=list_source.At(i);
      string obj1_prop=obj.GetProperty(property);
      max_obj=list_source.At(index);
      string obj2_prop=max_obj.GetProperty(property);
      if(CompareValues(obj1_prop,obj2_prop,MORE)) index=i;
     }
   return index;
  }
//+------------------------------------------------------------------+
//| Return the chart index in the list                               |
//| with the minimum integer property value                          |
//+------------------------------------------------------------------+
int CSelect::FindChartMin(CArrayObj* list_source,ENUM_CHART_PROP_INTEGER property)
  {
   int index=0;
   CChartObj *min_obj=NULL;
   int total=list_source.Total();
   if(total==0) return WRONG_VALUE;
   for(int i=1; i<total; i++)
     {
      CChartObj *obj=list_source.At(i);
      long obj1_prop=obj.GetProperty(property);
      min_obj=list_source.At(index);
      long obj2_prop=min_obj.GetProperty(property);
      if(CompareValues(obj1_prop,obj2_prop,LESS)) index=i;
     }
   return index;
  }
//+------------------------------------------------------------------+
//| Return the chart index in the list                               |
//| with the minimum real property value                             |
//+------------------------------------------------------------------+
int CSelect::FindChartMin(CArrayObj* list_source,ENUM_CHART_PROP_DOUBLE property)
  {
   int index=0;
   CChartObj *min_obj=NULL;
   int total=list_source.Total();
   if(total== 0) return WRONG_VALUE;
   for(int i=1; i<total; i++)
     {
      CChartObj *obj=list_source.At(i);
      double obj1_prop=obj.GetProperty(property);
      min_obj=list_source.At(index);
      double obj2_prop=min_obj.GetProperty(property);
      if(CompareValues(obj1_prop,obj2_prop,LESS)) index=i;
     }
   return index;
  }
//+------------------------------------------------------------------+
//| Return the chart index in the list                               |
//| with the minimum string property value                           |
//+------------------------------------------------------------------+
int CSelect::FindChartMin(CArrayObj* list_source,ENUM_CHART_PROP_STRING property)
  {
   int index=0;
   CChartObj *min_obj=NULL;
   int total=list_source.Total();
   if(total==0) return WRONG_VALUE;
   for(int i=1; i<total; i++)
     {
      CChartObj *obj=list_source.At(i);
      string obj1_prop=obj.GetProperty(property);
      min_obj=list_source.At(index);
      string obj2_prop=min_obj.GetProperty(property);
      if(CompareValues(obj1_prop,obj2_prop,LESS)) index=i;
     }
   return index;
  }
//+------------------------------------------------------------------+
これらのメソッドについては、第3部の「検索の配置」セクションで詳しく検討しました。
チャートに接続されているウィンドウの数を変更すると、ウィンドウのインデックスが変更されるため、新しいウィンドウインデックスが必要になる場合があります。\MQL5\Include\DoEasy\Objects\Chart\ChartWnd.mqhチャートウィンドウオブジェクトクラスファイルのクラスのpublicセクションで、ウィンドウインデックスを設定する新しいメソッドを記述します。
//+------------------------------------------------------------------+
//| Chart window indicator object class                              |
//+------------------------------------------------------------------+
class CWndInd : public CObject
  {
private:
   long              m_chart_id;                         // Chart ID
   string            m_name;                             // Indicator short name
   int               m_index;                            // Window index on the chart
   int               m_handle;                           // Indicator handle
public:
//--- Return itself
   CWndInd          *GetObject(void)                     { return &this;         }
//--- Return (1) indicator name, (2) window index and (3) indicator handle
   string            Name(void)                    const { return this.m_name;   }
   int               Index(void)                   const { return this.m_index;  }
   int               Handle(void)                  const { return this.m_handle; }
//--- Set the index of the on-chart window
   void              SetIndex(const int index)           { this.m_index=index;   }

//--- Display the description of object properties in the journal (dash=true - hyphen before the description, false - description only)
   void              Print(const bool dash=false)        { ::Print((dash ? "- " : "")+this.Header());                      }
//--- Return the object short name
   string            Header(void)                  const { return CMessage::Text(MSG_CHART_OBJ_INDICATOR)+" "+this.Name(); }

//--- Compare CWndInd objects with each other by the specified property
   virtual int       Compare(const CObject *node,const int mode=0) const;

//--- Constructors
                     CWndInd(void);
                     CWndInd(const int handle,const string name,const int index) : m_handle(handle),m_name(name),m_index(index) {}
  };
//+------------------------------------------------------------------+
\MQL5\Include\DoEasy\Objects\Chart\ChartObj.mqhのチャートオブジェクトクラスを少し改善してみましょう。
メソッドによって設定されたプロパティを削除することにしたので、役に立たなくなったオブジェクトプロパティを設定するためのprivateメソッドのリストからSetVisible()メソッドの宣言を削除します。
//--- The methods of setting property values
   bool              SetMode(const string source,const ENUM_CHART_MODE mode,const bool redraw=false);
   bool              SetScale(const string source,const int scale,const bool redraw=false);
   bool              SetModeVolume(const string source,const ENUM_CHART_VOLUME_MODE mode,const bool redraw=false);
   void              SetVisibleBars(void);
   void              SetWindowsTotal(void);
   void              SetVisible(void);
   void              SetFirstVisibleBars(void);
   void              SetWidthInBars(void);
   void              SetWidthInPixels(void);
   void              SetMaximizedFlag(void);
   void              SetMinimizedFlag(void);
   void              SetExpertName(void);
   void              SetScriptName(void);
クラス本体の外で、メソッドの実装を削除します。
//+-------------------------------------------------------------------+
//|  Set the property                                                 |
//| "The total number of chart windows including indicator subwindows"|
//+-------------------------------------------------------------------+
void CChartObj::SetWindowsTotal(void)
  {
   this.SetProperty(CHART_PROP_WINDOWS_TOTAL,::ChartGetInteger(this.ID(),CHART_WINDOWS_TOTAL));
  }
//+------------------------------------------------------------------+
//| Set the "Subwindow visibility" property                          |
//+------------------------------------------------------------------+
void CChartObj::SetVisible(void)
  {
   this.SetProperty(CHART_PROP_WINDOW_IS_VISIBLE,::ChartGetInteger(this.ID(),CHART_WINDOW_IS_VISIBLE,0));
  }
//+---------------------------------------------------------------------+
//| Set the property "The number of the first visible bar on the chart" |
//+---------------------------------------------------------------------+
void CChartObj::SetFirstVisibleBars(void)
  {
   this.SetProperty(CHART_PROP_FIRST_VISIBLE_BAR,::ChartGetInteger(this.ID(),CHART_FIRST_VISIBLE_BAR));
  }
//+------------------------------------------------------------------+
このメソッドは、単にメインチャートウィンドウの可視性プロパティを、すでに削除されている整数プロパティに配置します。これは使用しないので、関連するすべてのメソッドを削除します。いずれの場合も、ウィンドウプロパティの値は、チャートウィンドウオブジェクトのプロパティからではなく、環境から直接取得できます。
クラスのprivateセクションで、チャートに添付されたウィンドウのリストを作成するためのメソッドを宣言します。
//--- The methods of setting property values
   bool              SetMode(const string source,const ENUM_CHART_MODE mode,const bool redraw=false);
   bool              SetScale(const string source,const int scale,const bool redraw=false);
   bool              SetModeVolume(const string source,const ENUM_CHART_VOLUME_MODE mode,const bool redraw=false);
   void              SetVisibleBars(void);
   void              SetWindowsTotal(void);
   void              SetFirstVisibleBars(void);
   void              SetWidthInBars(void);
   void              SetWidthInPixels(void);
   void              SetMaximizedFlag(void);
   void              SetMinimizedFlag(void);
   void              SetExpertName(void);
   void              SetScriptName(void);

//--- Create the list of chart windows
   void              CreateWindowsList(void);

public:
クラスのprivateセクションで、チャートオブジェクトとそのサブウィンドウのプロパティを更新するためのメソッドを宣言します。
//--- Update the chart object and its list of indicator windows
   void              Refresh(void);

//--- Constructors
                     CChartObj(){;}
                     CChartObj(const long chart_id);
チャートウィンドウの総数を返すメソッドを使用して作業を調整しているときに、リクエストした直後にオブジェクトプロパティにデータを設定する必要があることに気付きました。そのため、データリクエストとそのオブジェクトプロパティへの組み込みを組み合わせることにしました。
WindowsTotal()メソッドでは、まずリクエストを追加し、SetWindowsTotal()メソッドでチャートウィンドウの数を設定します。次に、オブジェクトプロパティに保存された新しく取得した値の戻り値を実装します。 Visible()メソッドの実装を削除します。
//--- Return the number of bars on a chart that are available for display
   int               VisibleBars(void)                               const { return (int)this.GetProperty(CHART_PROP_VISIBLE_BARS);       }

//--- Return the total number of chart windows including indicator subwindows
   int               WindowsTotal(void)
                       {
                        this.SetWindowsTotal();
                        return (int)this.GetProperty(CHART_PROP_WINDOWS_TOTAL);
                       }

//--- Return the window visibility
   bool              Visible(void)                                   const { return (bool)this.GetProperty(CHART_PROP_WINDOW_IS_VISIBLE); }
さらに別の、チャートオブジェクトがメイン(ライブラリベースのプログラムが接続されているチャート)であることを示すフラグを返すメソッドを追加しましょう。
//--- Emulate a tick (chart updates - similar to the terminal Refresh command)
   void              EmulateTick(void)                                     { ::ChartSetSymbolPeriod(this.ID(),this.Symbol(),this.Timeframe());}

//--- Return the flag indicating that the chart object belongs to the program chart
   bool              IsMainChart(void)                               const { return(this.m_chart_id==CBaseObj::GetMainChartID());            }
//--- Return the chart window specified by index
   CChartWnd        *GetWindowByIndex(const int index)               const { return this.m_list_wnd.At(index);                               }
すべてのライブラリオブジェクトのCBaseObj基本オブジェクトは、プログラムが起動されるチャートのIDを格納するm_chart_id_main変数を備えています。コンストラクタでは、変数はChartID()関数によって返される値を受け取ります。現在のチャートIDは、CBaseObjクラスのGetMainChartID()メソッドを使用して返されます。このメソッドは、m_chart_id_main変数に設定された値を返します。したがって、現在のチャートIDがプログラムのメインウィンドウIDと一致するかどうかを示すフラグを返します。メソッドは、一致する場合はtrue、一致しない場合はfalseを返します。
パラメトリックコンストラクタから、現在のチャートウィンドウの可視性の値が設定されている文字列を削除します。
//+------------------------------------------------------------------+
//| Parametric constructor                                           |
//+------------------------------------------------------------------+
CChartObj::CChartObj(const long chart_id)
  {
//--- Set chart ID to the base object
   CBaseObj::SetChartID(chart_id);
//--- Set integer properties
   this.SetProperty(CHART_PROP_ID,chart_id);                                                             // Chart ID
   this.SetProperty(CHART_PROP_TIMEFRAME,::ChartPeriod(this.ID()));                                      // Chart timeframe
   this.SetProperty(CHART_PROP_SHOW,::ChartGetInteger(this.ID(),CHART_SHOW));                            // Price chart drawing attribute
   this.SetProperty(CHART_PROP_IS_OBJECT,::ChartGetInteger(this.ID(),CHART_IS_OBJECT));                  // Chart object identification attribute
   this.SetProperty(CHART_PROP_BRING_TO_TOP,false);                                                      // Show chart above all others
   this.SetProperty(CHART_PROP_CONTEXT_MENU,::ChartGetInteger(this.ID(),CHART_CONTEXT_MENU));            // Access to the context menu using the right click
   this.SetProperty(CHART_PROP_CROSSHAIR_TOOL,::ChartGetInteger(this.ID(),CHART_CROSSHAIR_TOOL));        // Access the Crosshair tool by pressing the middle mouse button
   this.SetProperty(CHART_PROP_MOUSE_SCROLL,::ChartGetInteger(this.ID(),CHART_MOUSE_SCROLL));            // Scroll the chart horizontally using the left mouse button
   this.SetProperty(CHART_PROP_EVENT_MOUSE_WHEEL,::ChartGetInteger(this.ID(),CHART_EVENT_MOUSE_WHEEL));  // Send messages about mouse wheel events to all MQL5 programs on a chart
   this.SetProperty(CHART_PROP_EVENT_MOUSE_MOVE,::ChartGetInteger(this.ID(),CHART_EVENT_MOUSE_MOVE));    // Send messages about mouse button click and movement events to all MQL5 programs on a chart
   this.SetProperty(CHART_PROP_EVENT_OBJECT_CREATE,::ChartGetInteger(this.ID(),CHART_EVENT_OBJECT_CREATE)); // Send messages about the graphical object creation event to all MQL5 programs on a chart
   this.SetProperty(CHART_PROP_EVENT_OBJECT_DELETE,::ChartGetInteger(this.ID(),CHART_EVENT_OBJECT_DELETE)); // Send messages about the graphical object destruction event to all MQL5 programs on a chart
   this.SetProperty(CHART_PROP_MODE,::ChartGetInteger(this.ID(),CHART_MODE));                            // Type of the chart (candlesticks, bars or line)
   this.SetProperty(CHART_PROP_FOREGROUND,::ChartGetInteger(this.ID(),CHART_FOREGROUND));                // Price chart in the foreground
   this.SetProperty(CHART_PROP_SHIFT,::ChartGetInteger(this.ID(),CHART_SHIFT));                          // Mode of shift of the price chart from the right border
   this.SetProperty(CHART_PROP_AUTOSCROLL,::ChartGetInteger(this.ID(),CHART_AUTOSCROLL));                // The mode of automatic shift to the right border of the chart
   this.SetProperty(CHART_PROP_KEYBOARD_CONTROL,::ChartGetInteger(this.ID(),CHART_KEYBOARD_CONTROL));    // Allow managing the chart using a keyboard
   this.SetProperty(CHART_PROP_QUICK_NAVIGATION,::ChartGetInteger(this.ID(),CHART_QUICK_NAVIGATION));    // Allow the chart to intercept Space and Enter key strokes to activate the quick navigation bar
   this.SetProperty(CHART_PROP_SCALE,::ChartGetInteger(this.ID(),CHART_SCALE));                          // Scale
   this.SetProperty(CHART_PROP_SCALEFIX,::ChartGetInteger(this.ID(),CHART_SCALEFIX));                    // Fixed scale mode
   this.SetProperty(CHART_PROP_SCALEFIX_11,::ChartGetInteger(this.ID(),CHART_SCALEFIX_11));              // 1:1 scale mode
   this.SetProperty(CHART_PROP_SCALE_PT_PER_BAR,::ChartGetInteger(this.ID(),CHART_SCALE_PT_PER_BAR));    // Mode for specifying the scale in points per bar
   this.SetProperty(CHART_PROP_SHOW_TICKER,::ChartGetInteger(this.ID(),CHART_SHOW_TICKER));              // Display a symbol ticker in the upper left corner
   this.SetProperty(CHART_PROP_SHOW_OHLC,::ChartGetInteger(this.ID(),CHART_SHOW_OHLC));                  // Display OHLC values in the upper left corner
   this.SetProperty(CHART_PROP_SHOW_BID_LINE,::ChartGetInteger(this.ID(),CHART_SHOW_BID_LINE));          // Display Bid value as a horizontal line on the chart
   this.SetProperty(CHART_PROP_SHOW_ASK_LINE,::ChartGetInteger(this.ID(),CHART_SHOW_ASK_LINE));          // Display Ask value as a horizontal line on the chart
   this.SetProperty(CHART_PROP_SHOW_LAST_LINE,::ChartGetInteger(this.ID(),CHART_SHOW_LAST_LINE));        // Display Last value as a horizontal line on the chart
   this.SetProperty(CHART_PROP_SHOW_PERIOD_SEP,::ChartGetInteger(this.ID(),CHART_SHOW_PERIOD_SEP));      // Display vertical separators between adjacent periods
   this.SetProperty(CHART_PROP_SHOW_GRID,::ChartGetInteger(this.ID(),CHART_SHOW_GRID));                  // Display the chart grid
   this.SetProperty(CHART_PROP_SHOW_VOLUMES,::ChartGetInteger(this.ID(),CHART_SHOW_VOLUMES));            // Display volumes on the chart
   this.SetProperty(CHART_PROP_SHOW_OBJECT_DESCR,::ChartGetInteger(this.ID(),CHART_SHOW_OBJECT_DESCR));  // Display text descriptions of the objects
   this.SetProperty(CHART_PROP_VISIBLE_BARS,::ChartGetInteger(this.ID(),CHART_VISIBLE_BARS));            // Number of bars on a chart that are available for display
   this.SetProperty(CHART_PROP_WINDOWS_TOTAL,::ChartGetInteger(this.ID(),CHART_WINDOWS_TOTAL));          // The total number of chart windows including indicator subwindows
   this.SetProperty(CHART_PROP_WINDOW_IS_VISIBLE,::ChartGetInteger(this.ID(),CHART_WINDOW_IS_VISIBLE,0));// Window visibility
   this.SetProperty(CHART_PROP_WINDOW_HANDLE,::ChartGetInteger(this.ID(),CHART_WINDOW_HANDLE));          // Chart window handle
   this.SetProperty(CHART_PROP_WINDOW_YDISTANCE,::ChartGetInteger(this.ID(),CHART_WINDOW_YDISTANCE,0));  // Distance in Y axis pixels between the upper frame of the indicator subwindow and the upper frame of the chart main window
   this.SetProperty(CHART_PROP_FIRST_VISIBLE_BAR,::ChartGetInteger(this.ID(),CHART_FIRST_VISIBLE_BAR));  // Number of the first visible bar on the chart
   this.SetProperty(CHART_PROP_WIDTH_IN_BARS,::ChartGetInteger(this.ID(),CHART_WIDTH_IN_BARS));          // Chart width in bars
   this.SetProperty(CHART_PROP_WIDTH_IN_PIXELS,::ChartGetInteger(this.ID(),CHART_WIDTH_IN_PIXELS));      // Chart width in pixels
   this.SetProperty(CHART_PROP_HEIGHT_IN_PIXELS,::ChartGetInteger(this.ID(),CHART_HEIGHT_IN_PIXELS,0));  // Chart height in pixels
   this.SetProperty(CHART_PROP_COLOR_BACKGROUND,::ChartGetInteger(this.ID(),CHART_COLOR_BACKGROUND));    // Chart background color
   this.SetProperty(CHART_PROP_COLOR_FOREGROUND,::ChartGetInteger(this.ID(),CHART_COLOR_FOREGROUND));    // Color of axes, scale and OHLC line
   this.SetProperty(CHART_PROP_COLOR_GRID,::ChartGetInteger(this.ID(),CHART_COLOR_GRID));                // Grid color
   this.SetProperty(CHART_PROP_COLOR_VOLUME,::ChartGetInteger(this.ID(),CHART_COLOR_VOLUME));            // Color of volumes and position opening levels
   this.SetProperty(CHART_PROP_COLOR_CHART_UP,::ChartGetInteger(this.ID(),CHART_COLOR_CHART_UP));        // Color for the up bar, shadows and body borders of bullish candlesticks
   this.SetProperty(CHART_PROP_COLOR_CHART_DOWN,::ChartGetInteger(this.ID(),CHART_COLOR_CHART_DOWN));    // Color for the down bar, shadows and body borders of bearish candlesticks
   this.SetProperty(CHART_PROP_COLOR_CHART_LINE,::ChartGetInteger(this.ID(),CHART_COLOR_CHART_LINE));    // Color of the chart line and the Doji candlesticks
   this.SetProperty(CHART_PROP_COLOR_CANDLE_BULL,::ChartGetInteger(this.ID(),CHART_COLOR_CANDLE_BULL));  // Color of the bullish candle body
   this.SetProperty(CHART_PROP_COLOR_CANDLE_BEAR,::ChartGetInteger(this.ID(),CHART_COLOR_CANDLE_BEAR));  // Color of the bearish candle body
   this.SetProperty(CHART_PROP_COLOR_BID,::ChartGetInteger(this.ID(),CHART_COLOR_BID));                  // Bid price line color
   this.SetProperty(CHART_PROP_COLOR_ASK,::ChartGetInteger(this.ID(),CHART_COLOR_ASK));                  // Ask price line color
   this.SetProperty(CHART_PROP_COLOR_LAST,::ChartGetInteger(this.ID(),CHART_COLOR_LAST));                // Color of the last performed deal's price line (Last)
   this.SetProperty(CHART_PROP_COLOR_STOP_LEVEL,::ChartGetInteger(this.ID(),CHART_COLOR_STOP_LEVEL));    // Color of stop order levels (Stop Loss and Take Profit)
   this.SetProperty(CHART_PROP_SHOW_TRADE_LEVELS,::ChartGetInteger(this.ID(),CHART_SHOW_TRADE_LEVELS));  // Display trade levels on the chart (levels of open positions, Stop Loss, Take Profit and pending orders)
   this.SetProperty(CHART_PROP_DRAG_TRADE_LEVELS,::ChartGetInteger(this.ID(),CHART_DRAG_TRADE_LEVELS));  // Enable the ability to drag trading levels on a chart using mouse
   this.SetProperty(CHART_PROP_SHOW_DATE_SCALE,::ChartGetInteger(this.ID(),CHART_SHOW_DATE_SCALE));      // Display the time scale on the chart
   this.SetProperty(CHART_PROP_SHOW_PRICE_SCALE,::ChartGetInteger(this.ID(),CHART_SHOW_PRICE_SCALE));    // Display the price scale on the chart
   this.SetProperty(CHART_PROP_SHOW_ONE_CLICK,::ChartGetInteger(this.ID(),CHART_SHOW_ONE_CLICK));        // Display the quick trading panel on the chart
   this.SetProperty(CHART_PROP_IS_MAXIMIZED,::ChartGetInteger(this.ID(),CHART_IS_MAXIMIZED));            // Chart window maximized
   this.SetProperty(CHART_PROP_IS_MINIMIZED,::ChartGetInteger(this.ID(),CHART_IS_MINIMIZED));            // Chart window minimized
   this.SetProperty(CHART_PROP_IS_DOCKED,::ChartGetInteger(this.ID(),CHART_IS_DOCKED));                  // Chart window docked
   this.SetProperty(CHART_PROP_FLOAT_LEFT,::ChartGetInteger(this.ID(),CHART_FLOAT_LEFT));                // Left coordinate of the undocked chart window relative to the virtual screen
   this.SetProperty(CHART_PROP_FLOAT_TOP,::ChartGetInteger(this.ID(),CHART_FLOAT_TOP));                  // Upper coordinate of the undocked chart window relative to the virtual screen
   this.SetProperty(CHART_PROP_FLOAT_RIGHT,::ChartGetInteger(this.ID(),CHART_FLOAT_RIGHT));              // Right coordinate of the undocked chart window relative to the virtual screen
   this.SetProperty(CHART_PROP_FLOAT_BOTTOM,::ChartGetInteger(this.ID(),CHART_FLOAT_BOTTOM));            // Bottom coordinate of the undocked chart window relative to the virtual screen
//--- Set real properties
   this.SetProperty(CHART_PROP_SHIFT_SIZE,::ChartGetDouble(this.ID(),CHART_SHIFT_SIZE));                 // Shift size of the zero bar from the right border in %
   this.SetProperty(CHART_PROP_FIXED_POSITION,::ChartGetDouble(this.ID(),CHART_FIXED_POSITION));         // Chart fixed position from the left border in %
   this.SetProperty(CHART_PROP_FIXED_MAX,::ChartGetDouble(this.ID(),CHART_FIXED_MAX));                   // Fixed chart maximum
   this.SetProperty(CHART_PROP_FIXED_MIN,::ChartGetDouble(this.ID(),CHART_FIXED_MIN));                   // Fixed chart minimum
   this.SetProperty(CHART_PROP_POINTS_PER_BAR,::ChartGetDouble(this.ID(),CHART_POINTS_PER_BAR));         // Scale in points per bar
   this.SetProperty(CHART_PROP_PRICE_MIN,::ChartGetDouble(this.ID(),CHART_PRICE_MIN));                   // Chart minimum
   this.SetProperty(CHART_PROP_PRICE_MAX,::ChartGetDouble(this.ID(),CHART_PRICE_MAX));                   // Chart maximum
//--- Set string properties
   this.SetProperty(CHART_PROP_COMMENT,::ChartGetString(this.ID(),CHART_COMMENT));                       // Comment text on the chart
   this.SetProperty(CHART_PROP_EXPERT_NAME,::ChartGetString(this.ID(),CHART_EXPERT_NAME));               // name of an EA launched on the chart
   this.SetProperty(CHART_PROP_SCRIPT_NAME,::ChartGetString(this.ID(),CHART_SCRIPT_NAME));               // name of a script launched on the chart
   this.SetProperty(CHART_PROP_SYMBOL,::ChartSymbol(this.ID()));                                         // Chart symbol

   this.m_digits=(int)::SymbolInfoInteger(this.Symbol(),SYMBOL_DIGITS);
チャートに属するウィンドウオブジェクトを特徴とするループの代わりに、
   this.m_digits=(int)::SymbolInfoInteger(this.Symbol(),SYMBOL_DIGITS);
   int total=this.WindowsTotal();
   for(int i=0;i<total;i++)
     {
      CChartWnd *wnd=new CChartWnd(m_chart_id,i);
      if(wnd==NULL)
         continue;
      m_list_wnd.Sort();
      if(!m_list_wnd.Add(wnd))
         delete wnd;
     }
チャートに属するウィンドウのリストが作成されるメソッドの呼び出しを追加します。
   this.m_digits=(int)::SymbolInfoInteger(this.Symbol(),SYMBOL_DIGITS);
   this.CreateWindowsList();
その結果、パラメトリックコンストラクタは次のようになります。
//+------------------------------------------------------------------+
//| Parametric constructor                                           |
//+------------------------------------------------------------------+
CChartObj::CChartObj(const long chart_id)
  {
//--- Set chart ID to the base object
   CBaseObj::SetChartID(chart_id);
//--- Set integer properties
   this.SetProperty(CHART_PROP_ID,chart_id);                                                             // Chart ID
   this.SetProperty(CHART_PROP_TIMEFRAME,::ChartPeriod(this.ID()));                                      // Chart timeframe
   this.SetProperty(CHART_PROP_SHOW,::ChartGetInteger(this.ID(),CHART_SHOW));                            // Price chart drawing attribute
   this.SetProperty(CHART_PROP_IS_OBJECT,::ChartGetInteger(this.ID(),CHART_IS_OBJECT));                  // Chart object identification attribute
   this.SetProperty(CHART_PROP_BRING_TO_TOP,false);                                                      // Show chart above all others
   this.SetProperty(CHART_PROP_CONTEXT_MENU,::ChartGetInteger(this.ID(),CHART_CONTEXT_MENU));            // Access to the context menu using the right click
   this.SetProperty(CHART_PROP_CROSSHAIR_TOOL,::ChartGetInteger(this.ID(),CHART_CROSSHAIR_TOOL));        // Access the Crosshair tool by pressing the middle mouse button
   this.SetProperty(CHART_PROP_MOUSE_SCROLL,::ChartGetInteger(this.ID(),CHART_MOUSE_SCROLL));            // Scroll the chart horizontally using the left mouse button
   this.SetProperty(CHART_PROP_EVENT_MOUSE_WHEEL,::ChartGetInteger(this.ID(),CHART_EVENT_MOUSE_WHEEL));  // Send messages about mouse wheel events to all MQL5 programs on a chart
   this.SetProperty(CHART_PROP_EVENT_MOUSE_MOVE,::ChartGetInteger(this.ID(),CHART_EVENT_MOUSE_MOVE));    // Send messages about mouse button click and movement events to all MQL5 programs on a chart
   this.SetProperty(CHART_PROP_EVENT_OBJECT_CREATE,::ChartGetInteger(this.ID(),CHART_EVENT_OBJECT_CREATE)); // Send messages about the graphical object creation event to all MQL5 programs on a chart
   this.SetProperty(CHART_PROP_EVENT_OBJECT_DELETE,::ChartGetInteger(this.ID(),CHART_EVENT_OBJECT_DELETE)); // Send messages about the graphical object destruction event to all MQL5 programs on a chart
   this.SetProperty(CHART_PROP_MODE,::ChartGetInteger(this.ID(),CHART_MODE));                            // Type of the chart (candlesticks, bars or line)
   this.SetProperty(CHART_PROP_FOREGROUND,::ChartGetInteger(this.ID(),CHART_FOREGROUND));                // Price chart in the foreground
   this.SetProperty(CHART_PROP_SHIFT,::ChartGetInteger(this.ID(),CHART_SHIFT));                          // Mode of shift of the price chart from the right border
   this.SetProperty(CHART_PROP_AUTOSCROLL,::ChartGetInteger(this.ID(),CHART_AUTOSCROLL));                // The mode of automatic shift to the right border of the chart
   this.SetProperty(CHART_PROP_KEYBOARD_CONTROL,::ChartGetInteger(this.ID(),CHART_KEYBOARD_CONTROL));    // Allow managing the chart using a keyboard
   this.SetProperty(CHART_PROP_QUICK_NAVIGATION,::ChartGetInteger(this.ID(),CHART_QUICK_NAVIGATION));    // Allow the chart to intercept Space and Enter key strokes to activate the quick navigation bar
   this.SetProperty(CHART_PROP_SCALE,::ChartGetInteger(this.ID(),CHART_SCALE));                          // Scale
   this.SetProperty(CHART_PROP_SCALEFIX,::ChartGetInteger(this.ID(),CHART_SCALEFIX));                    // Fixed scale mode
   this.SetProperty(CHART_PROP_SCALEFIX_11,::ChartGetInteger(this.ID(),CHART_SCALEFIX_11));              // 1:1 scale mode
   this.SetProperty(CHART_PROP_SCALE_PT_PER_BAR,::ChartGetInteger(this.ID(),CHART_SCALE_PT_PER_BAR));    // Mode for specifying the scale in points per bar
   this.SetProperty(CHART_PROP_SHOW_TICKER,::ChartGetInteger(this.ID(),CHART_SHOW_TICKER));              // Display a symbol ticker in the upper left corner
   this.SetProperty(CHART_PROP_SHOW_OHLC,::ChartGetInteger(this.ID(),CHART_SHOW_OHLC));                  // Display OHLC values in the upper left corner
   this.SetProperty(CHART_PROP_SHOW_BID_LINE,::ChartGetInteger(this.ID(),CHART_SHOW_BID_LINE));          // Display Bid value as a horizontal line on the chart
   this.SetProperty(CHART_PROP_SHOW_ASK_LINE,::ChartGetInteger(this.ID(),CHART_SHOW_ASK_LINE));          // Display Ask value as a horizontal line on the chart
   this.SetProperty(CHART_PROP_SHOW_LAST_LINE,::ChartGetInteger(this.ID(),CHART_SHOW_LAST_LINE));        // Display Last value as a horizontal line on the chart
   this.SetProperty(CHART_PROP_SHOW_PERIOD_SEP,::ChartGetInteger(this.ID(),CHART_SHOW_PERIOD_SEP));      // Display vertical separators between adjacent periods
   this.SetProperty(CHART_PROP_SHOW_GRID,::ChartGetInteger(this.ID(),CHART_SHOW_GRID));                  // Display the chart grid
   this.SetProperty(CHART_PROP_SHOW_VOLUMES,::ChartGetInteger(this.ID(),CHART_SHOW_VOLUMES));            // Display volumes on the chart
   this.SetProperty(CHART_PROP_SHOW_OBJECT_DESCR,::ChartGetInteger(this.ID(),CHART_SHOW_OBJECT_DESCR));  // Display text descriptions of the objects
   this.SetProperty(CHART_PROP_VISIBLE_BARS,::ChartGetInteger(this.ID(),CHART_VISIBLE_BARS));            // Number of bars on a chart that are available for display
   this.SetProperty(CHART_PROP_WINDOWS_TOTAL,::ChartGetInteger(this.ID(),CHART_WINDOWS_TOTAL));          // The total number of chart windows including indicator subwindows
   this.SetProperty(CHART_PROP_WINDOW_HANDLE,::ChartGetInteger(this.ID(),CHART_WINDOW_HANDLE));          // Chart window handle
   this.SetProperty(CHART_PROP_WINDOW_YDISTANCE,::ChartGetInteger(this.ID(),CHART_WINDOW_YDISTANCE,0));  // Distance in Y axis pixels between the upper frame of the indicator subwindow and the upper frame of the chart main window
   this.SetProperty(CHART_PROP_FIRST_VISIBLE_BAR,::ChartGetInteger(this.ID(),CHART_FIRST_VISIBLE_BAR));  // Number of the first visible bar on the chart
   this.SetProperty(CHART_PROP_WIDTH_IN_BARS,::ChartGetInteger(this.ID(),CHART_WIDTH_IN_BARS));          // Chart width in bars
   this.SetProperty(CHART_PROP_WIDTH_IN_PIXELS,::ChartGetInteger(this.ID(),CHART_WIDTH_IN_PIXELS));      // Chart width in pixels
   this.SetProperty(CHART_PROP_HEIGHT_IN_PIXELS,::ChartGetInteger(this.ID(),CHART_HEIGHT_IN_PIXELS,0));  // Chart height in pixels
   this.SetProperty(CHART_PROP_COLOR_BACKGROUND,::ChartGetInteger(this.ID(),CHART_COLOR_BACKGROUND));    // Chart background color
   this.SetProperty(CHART_PROP_COLOR_FOREGROUND,::ChartGetInteger(this.ID(),CHART_COLOR_FOREGROUND));    // Color of axes, scale and OHLC line
   this.SetProperty(CHART_PROP_COLOR_GRID,::ChartGetInteger(this.ID(),CHART_COLOR_GRID));                // Grid color
   this.SetProperty(CHART_PROP_COLOR_VOLUME,::ChartGetInteger(this.ID(),CHART_COLOR_VOLUME));            // Color of volumes and position opening levels
   this.SetProperty(CHART_PROP_COLOR_CHART_UP,::ChartGetInteger(this.ID(),CHART_COLOR_CHART_UP));        // Color for the up bar, shadows and body borders of bullish candlesticks
   this.SetProperty(CHART_PROP_COLOR_CHART_DOWN,::ChartGetInteger(this.ID(),CHART_COLOR_CHART_DOWN));    // Color for the down bar, shadows and body borders of bearish candlesticks
   this.SetProperty(CHART_PROP_COLOR_CHART_LINE,::ChartGetInteger(this.ID(),CHART_COLOR_CHART_LINE));    // Color of the chart line and the Doji candlesticks
   this.SetProperty(CHART_PROP_COLOR_CANDLE_BULL,::ChartGetInteger(this.ID(),CHART_COLOR_CANDLE_BULL));  // Color of the bullish candle body
   this.SetProperty(CHART_PROP_COLOR_CANDLE_BEAR,::ChartGetInteger(this.ID(),CHART_COLOR_CANDLE_BEAR));  // Color of the bearish candle body
   this.SetProperty(CHART_PROP_COLOR_BID,::ChartGetInteger(this.ID(),CHART_COLOR_BID));                  // Bid price line color
   this.SetProperty(CHART_PROP_COLOR_ASK,::ChartGetInteger(this.ID(),CHART_COLOR_ASK));                  // Ask price line color
   this.SetProperty(CHART_PROP_COLOR_LAST,::ChartGetInteger(this.ID(),CHART_COLOR_LAST));                // Color of the last performed deal's price line (Last)
   this.SetProperty(CHART_PROP_COLOR_STOP_LEVEL,::ChartGetInteger(this.ID(),CHART_COLOR_STOP_LEVEL));    // Color of stop order levels (Stop Loss and Take Profit)
   this.SetProperty(CHART_PROP_SHOW_TRADE_LEVELS,::ChartGetInteger(this.ID(),CHART_SHOW_TRADE_LEVELS));  // Display trade levels on the chart (levels of open positions, Stop Loss, Take Profit and pending orders)
   this.SetProperty(CHART_PROP_DRAG_TRADE_LEVELS,::ChartGetInteger(this.ID(),CHART_DRAG_TRADE_LEVELS));  // Enable the ability to drag trading levels on a chart using mouse
   this.SetProperty(CHART_PROP_SHOW_DATE_SCALE,::ChartGetInteger(this.ID(),CHART_SHOW_DATE_SCALE));      // Display the time scale on the chart
   this.SetProperty(CHART_PROP_SHOW_PRICE_SCALE,::ChartGetInteger(this.ID(),CHART_SHOW_PRICE_SCALE));    // Display the price scale on the chart
   this.SetProperty(CHART_PROP_SHOW_ONE_CLICK,::ChartGetInteger(this.ID(),CHART_SHOW_ONE_CLICK));        // Display the quick trading panel on the chart
   this.SetProperty(CHART_PROP_IS_MAXIMIZED,::ChartGetInteger(this.ID(),CHART_IS_MAXIMIZED));            // Chart window maximized
   this.SetProperty(CHART_PROP_IS_MINIMIZED,::ChartGetInteger(this.ID(),CHART_IS_MINIMIZED));            // Chart window minimized
   this.SetProperty(CHART_PROP_IS_DOCKED,::ChartGetInteger(this.ID(),CHART_IS_DOCKED));                  // Chart window docked
   this.SetProperty(CHART_PROP_FLOAT_LEFT,::ChartGetInteger(this.ID(),CHART_FLOAT_LEFT));                // Left coordinate of the undocked chart window relative to the virtual screen
   this.SetProperty(CHART_PROP_FLOAT_TOP,::ChartGetInteger(this.ID(),CHART_FLOAT_TOP));                  // Upper coordinate of the undocked chart window relative to the virtual screen
   this.SetProperty(CHART_PROP_FLOAT_RIGHT,::ChartGetInteger(this.ID(),CHART_FLOAT_RIGHT));              // Right coordinate of the undocked chart window relative to the virtual screen
   this.SetProperty(CHART_PROP_FLOAT_BOTTOM,::ChartGetInteger(this.ID(),CHART_FLOAT_BOTTOM));            // Bottom coordinate of the undocked chart window relative to the virtual screen
//--- Set real properties
   this.SetProperty(CHART_PROP_SHIFT_SIZE,::ChartGetDouble(this.ID(),CHART_SHIFT_SIZE));                 // Shift size of the zero bar from the right border in %
   this.SetProperty(CHART_PROP_FIXED_POSITION,::ChartGetDouble(this.ID(),CHART_FIXED_POSITION));         // Chart fixed position from the left border in %
   this.SetProperty(CHART_PROP_FIXED_MAX,::ChartGetDouble(this.ID(),CHART_FIXED_MAX));                   // Fixed chart maximum
   this.SetProperty(CHART_PROP_FIXED_MIN,::ChartGetDouble(this.ID(),CHART_FIXED_MIN));                   // Fixed chart minimum
   this.SetProperty(CHART_PROP_POINTS_PER_BAR,::ChartGetDouble(this.ID(),CHART_POINTS_PER_BAR));         // Scale in points per bar
   this.SetProperty(CHART_PROP_PRICE_MIN,::ChartGetDouble(this.ID(),CHART_PRICE_MIN));                   // Chart minimum
   this.SetProperty(CHART_PROP_PRICE_MAX,::ChartGetDouble(this.ID(),CHART_PRICE_MAX));                   // Chart maximum
//--- Set string properties
   this.SetProperty(CHART_PROP_COMMENT,::ChartGetString(this.ID(),CHART_COMMENT));                       // Comment text on the chart
   this.SetProperty(CHART_PROP_EXPERT_NAME,::ChartGetString(this.ID(),CHART_EXPERT_NAME));               // name of an EA launched on the chart
   this.SetProperty(CHART_PROP_SCRIPT_NAME,::ChartGetString(this.ID(),CHART_SCRIPT_NAME));               // name of a script launched on the chart
   this.SetProperty(CHART_PROP_SYMBOL,::ChartSymbol(this.ID()));                                         // Chart symbol

   this.m_digits=(int)::SymbolInfoInteger(this.Symbol(),SYMBOL_DIGITS);
   this.CreateWindowsList();
  }
//+------------------------------------------------------------------+
オブジェクトの整数プロパティの説明を返すGetPropertyDescription()メソッドから、ウィンドウの可視性パラメータの説明が作成されるコードブロックを削除します。このプロパティはオブジェクトから削除されています。
      property==CHART_PROP_WINDOWS_TOTAL  ?  CMessage::Text(MSG_CHART_OBJ_WINDOWS_TOTAL)+
         (!this.SupportProperty(property) ?  ": "+CMessage::Text(MSG_LIB_PROP_NOT_SUPPORTED) :
          ": "+(string)this.GetProperty(property)
         )  :
      property==CHART_PROP_WINDOW_IS_VISIBLE  ?  CMessage::Text(MSG_CHART_OBJ_WINDOW_IS_VISIBLE)+
         (!this.SupportProperty(property) ?  ": "+CMessage::Text(MSG_LIB_PROP_NOT_SUPPORTED) :
          ": "+(this.GetProperty(property) ? CMessage::Text(MSG_LIB_TEXT_YES) : CMessage::Text(MSG_LIB_TEXT_NO))
         )  :
      property==CHART_PROP_WINDOW_HANDLE  ?  CMessage::Text(MSG_CHART_OBJ_WINDOW_HANDLE)+
         (!this.SupportProperty(property) ?  ": "+CMessage::Text(MSG_LIB_PROP_NOT_SUPPORTED) :
          ": "+(string)this.GetProperty(property)
         )  :
メソッドでは、すべてのチャートウィンドウのすべての指標のデータとすべてのチャートウィンドウのプロパティを操作ログで表示し、ループサイズをリスト内のチャートウィンドウオブジェクトの数に置き換えます。
//+-------------------------------------------------------------------+
//| Display data of all indicators of all chart windows in the journal|
//+-------------------------------------------------------------------+
void CChartObj::PrintWndIndicators(void)
  {
   for(int i=0;i<this.m_list_wnd.Total();i++)
     {
      CChartWnd *wnd=m_list_wnd.At(i);
      if(wnd==NULL)
         continue;
      wnd.PrintIndicators(true);
     }
  }
//+------------------------------------------------------------------+
//| Display the properties of all chart windows in the journal       |
//+------------------------------------------------------------------+
void CChartObj::PrintWndParameters(void)
  {
   for(int i=0;i<this.m_list_wnd.Total();i++)
     {
      CChartWnd *wnd=m_list_wnd.At(i);
      if(wnd==NULL)
         continue;
      wnd.PrintParameters(true);
     }
  }
//+------------------------------------------------------------------+
以前は、ループはWindowsTotal()メソッドによって返される値までカウントされていましたが、これは完全には正しくありません。<分節152958¶>このメソッドは、チャートから取得した実際の値を返しますが、リストには、実際の数と比較して、より多くのオブジェクトまたはより少ないオブジェクトが含まれる場合があります。これは、ターミナルチャートで番号を変更したときに発生します。したがって、誤ったリスト内のオブジェクト数に基づくループにはエラーが発生します。これはまさに私がここで修正したものです。
チャートオブジェクトとそのウィンドウのリストを更新するメソッドを実装します。
//+------------------------------------------------------------------+
//| Update the chart object and its window list                      |
//+------------------------------------------------------------------+
void CChartObj::Refresh(void)
  {
   int change=this.WindowsTotal()-this.m_list_wnd.Total();
   if(change==0)
      return;
   this.CreateWindowsList();
  }
//+------------------------------------------------------------------+
ここで、リスト内のチャートウィンドウの実際の数とウィンドウオブジェクトの数の差を数えます。違いがない場合、変更がないのでメソッドをそのままにします。そうでない場合は、チャートオブジェクトに属するすべてのチャートウィンドウオブジェクトの完全なリストを新たに作成します。これは、不要なオブジェクトを削除したり、リストに新しいオブジェクトを追加したりするために、オブジェクト間の違いや欠落しているチャートウィンドウオブジェクトを検索するよりもはるかに簡単です。
チャートに属するチャートウィンドウオブジェクトのリストを作成するメソッドを実装します。
//+------------------------------------------------------------------+
//| Create the list of chart windows                                 |
//+------------------------------------------------------------------+
void CChartObj::CreateWindowsList(void)
  {
   this.m_list_wnd.Clear();
   int total=this.WindowsTotal();
   for(int i=0;i<total;i++)
     {
      CChartWnd *wnd=new CChartWnd(m_chart_id,i);
      if(wnd==NULL)
         continue;
      this.m_list_wnd.Sort();
      if(!m_list_wnd.Add(wnd))
         delete wnd;
     }
  }
//+------------------------------------------------------------------+
ここでは、ウィンドウオブジェクトのリストを消去し、ターミナルパラメータからチャートウィンドウの総数を取得し、取得したウィンドウの数だけループで新しいチャートウィンドウオブジェクトを作成してリストに追加します。オブジェクトをリストに追加できなかった場合は、メモリリークを回避するためにオブジェクトを削除します。
これで、ライブラリクラスの改善は終わりです。
チャートオブジェクトコレクションクラスの作成を始めましょう。
チャートオブジェクトコレクションクラス
チャートウィンドウの数の変化を確認してオブジェクト内の数の更新をアクティブ化するチャートオブジェクトと同様、チャートオブジェクトコレクションでは、開いているチャートの数の変化を確認して チャートオブジェクトコレクションリストの再構成を開始します。
まず、既存のチャートオブジェクトのウィンドウ数を確認します。次に、開いているチャートの数の変化を確認します。結果がゼロ以外の場合は、チャートオブジェクトコレクションの再構築を開始します。
\MQL5\Include\DoEasy\Collections\ChartObjCollection.mqhライブラリフォルダーに、CChartObjCollectionクラスの新しいファイルを作成します。クラスは、すべてのCBaseObjライブラリオブジェクトの基本オブジェクトのクラスから派生する必要があります。チャートオブジェクトファイルを、チャートオブジェクトコレクションクラスのファイルにインクルードします。
//+------------------------------------------------------------------+
//|                                           ChartObjCollection.mqh |
//|                                  Copyright 2021, MetaQuotes Ltd. |
//|                             https://mql5.com/en/users/artmedia70 |
//+------------------------------------------------------------------+
#property copyright "Copyright 2021, MetaQuotes Ltd."
#property link      "https://mql5.com/en/users/artmedia70"
#property version   "1.00"
//+------------------------------------------------------------------+
//| Include files                                                    |
//+------------------------------------------------------------------+
#include "ListObj.mqh"
#include "..\Services\Select.mqh"
#include "..\Objects\Chart\ChartObj.mqh"
//+------------------------------------------------------------------+
//| MQL5 signal object collection                                    |
//+------------------------------------------------------------------+
class CChartObjCollection : public CBaseObj
  {
  }
クラスのprivateセクションで、チャートオブジェクトを格納するCListObjリスト、ターミナルで開いているチャートの前の数を格納するための変数、およびクラス操作を調整する補助メソッドを宣言します。
//+------------------------------------------------------------------+
//| MQL5 signal object collection                                    |
//+------------------------------------------------------------------+
class CChartObjCollection : public CBaseObj
  {
private:
   CListObj                m_list;                                   // List of chart objects
   int                     m_charts_total_prev;                      // Previous number of charts in the terminal
   //--- Return the number of charts in the terminal
   int                     ChartsTotal(void) const;
   //--- Return the flag indicating the existence of (1) a chart object and (2) a chart
   bool                    IsPresentChartObj(const long chart_id);
   bool                    IsPresentChart(const long chart_id);
   //--- Create a new chart object and add it to the list
   bool                    CreateNewChartObj(const long chart_id,const string source);
   //--- Find the missing chart object, create it and add it to the collection list
   bool                    FindAndCreateMissingChartObj(void);
   //--- Find a chart object not present in the terminal and remove it from the list
   void                    FindAndDeleteExcessChartObj(void);
public:
  }
クラスのpublicセクションで標準メソッドを設定します。
public:
//--- Return (1) itself and (2) chart object collection list
   CChartObjCollection    *GetObject(void)                                 { return &this;                  }
   CArrayObj              *GetList(void)                                   { return &this.m_list;           }
   //--- Return the list by selected (1) integer, (2) real and (3) string properties meeting the compared criterion
   CArrayObj              *GetList(ENUM_CHART_PROP_INTEGER property,long value,ENUM_COMPARER_TYPE mode=EQUAL)  { return CSelect::ByChartProperty(this.GetList(),property,value,mode);  }
   CArrayObj              *GetList(ENUM_CHART_PROP_DOUBLE property,double value,ENUM_COMPARER_TYPE mode=EQUAL) { return CSelect::ByChartProperty(this.GetList(),property,value,mode);  }
   CArrayObj              *GetList(ENUM_CHART_PROP_STRING property,string value,ENUM_COMPARER_TYPE mode=EQUAL) { return CSelect::ByChartProperty(this.GetList(),property,value,mode);  }
//--- Return the number of chart objects in the list
   int                     DataTotal(void)                           const { return this.m_list.Total();    }
//--- Display (1) the complete and (2) short collection description in the journal
   void                    Print(void);
   void                    PrintShort(void);
//--- Constructor
                           CChartObjCollection();
さらにメソッドを追加します。
//--- Return the pointer to the chart object (1) by ID and (2) by an index in the list
   CChartObj              *GetChart(const long id);
   CChartObj              *GetChart(const int index)                       { return this.m_list.At(index);  }
//--- Return the list of chart objects by (1) symbol and (2) timeframe
   CArrayObj              *GetChartsList(const string symbol)              { return this.GetList(CHART_PROP_SYMBOL,symbol,EQUAL);         }
   CArrayObj              *GetChartsList(const ENUM_TIMEFRAMES timeframe)  { return this.GetList(CHART_PROP_TIMEFRAME,timeframe,EQUAL);   }
//--- Return the chart ID with the program
   long                    GetMainChartID(void)                      const { return CBaseObj::GetMainChartID();   }
//--- Create the collection list of chart objects
   bool                    CreateCollection(void);
//--- Update (1) the chart object collection list and (2) the specified chart object
   void                    Refresh(void);
   void                    Refresh(const long chart_id);

  };
//+------------------------------------------------------------------+
クラスメソッドの実装をいくつか見てみましょう。
クラスコンストラクタで、コレクションオブジェクトのリストを消去し、リストの並べ替えフラグを設定し、チャートオブジェクトコレクションIDをリストに割り当て、ターミナルで現在開いているチャートの数を保存します。
//+------------------------------------------------------------------+
//| Constructor                                                      |
//+------------------------------------------------------------------+
CChartObjCollection::CChartObjCollection()
  {
   this.m_list.Clear();
   this.m_list.Sort();
   this.m_list.Type(COLLECTION_CHARTS_ID);
   this.m_charts_total_prev=this.ChartsTotal();
  }
//+------------------------------------------------------------------+
MQLには、開いているチャートの数を返す関数はありません。また、ループ内の開いているチャートの既製の配列を確認してループインデックスによって後続の各チャートを取得することはできません。ただし、最初のチャートのIDを返すChartFirst()関数と、指定されたチャートの次のチャートのIDを返すChartNext()関数はあります。したがって、開いているすべてのチャートによってループを作成し、前のチャートのIDに基づいて後続の各チャートを1つずつ取得することができます。ヘルプにあるChartNext()に関する情報には、このようなループを配置する例が含まれています。
//--- variables for chart identifiers
   long currChart,prevChart=ChartFirst();
   int i=0,limit=100;
   Print("ChartFirst = ",ChartSymbol(prevChart)," ID = ",prevChart);
   while(i<limit)// we probably have no more than 100 open charts
     {
      currChart=ChartNext(prevChart); // get new chart on the basis of the previous one
      if(currChart<0) break;          // the end of chart list is reached
      Print(i,ChartSymbol(currChart)," ID =",currChart);
      prevChart=currChart;// memorize identifier of the current chart for ChartNext()
      i++;// do not forget to increase the counter
     }
このようなループに基づいて、クライアントターミナルの開いているチャートを操作する必要があるカスタムメソッドを作成します。
以下は、チャートオブジェクトのコレクションリストを作成するメソッドです。
//+------------------------------------------------------------------+
//| Create the collection list of chart objects                      |
//+------------------------------------------------------------------+
bool CChartObjCollection::CreateCollection(void)
  {
   //--- Clear the list and set the flag of sorting by the chart ID
   m_list.Clear();
   m_list.Sort(SORT_BY_CHART_ID);
   //--- Declare the variables and get the first chart ID
   long curr_chart,prev_chart=::ChartFirst();
   int i=0;
   //--- Create the first chart object and add it to the list
   if(!this.CreateNewChartObj(prev_chart,DFUN))
      return false;
   //--- In the loop by the total number of terminal charts (not more than 100)
   while(i<CHARTS_MAX)
     {
      //--- based on the previous one, get the new chart
      curr_chart=::ChartNext(prev_chart);
      //--- When reaching the end of the chart list, complete the loop
      if(curr_chart<0) break;
      //--- Create the chart object based on the current chart ID in the loop and add it to the list
      if(!this.CreateNewChartObj(curr_chart,DFUN))
         return false;
      //--- remember the current chart ID for ChartNext() and increase the loop counter
      prev_chart=curr_chart;
      i++;
     }
   //--- Filled in the list successfully
   return true;
  }
//+------------------------------------------------------------------+
ここでのメソッドロジックは、すべてコードへのコメントで説明されています。つまり、最初にコレクションリストを消去して以前に追加したオブジェクトを削除します。次に、上記のループで、後続の開いている各チャートを取得し、そのIDを使用して新しいチャートオブジェクトを作成し、コレクションリストに追加します。
以下は、チャートオブジェクトコレクションリストを更新するメソッドです。
//+------------------------------------------------------------------+
//| Update the collection list of chart objects                      |
//+------------------------------------------------------------------+
void CChartObjCollection::Refresh(void)
  {
   //--- Get the number of open charts in the terminal and
   int charts_total=this.ChartsTotal();
   //--- calculate the difference between the number of open charts in the terminal
   //--- and chart objects in the collection list. These values are displayed in the chart comment
   int change=charts_total-this.m_list.Total();
   Comment(DFUN,", list total=",DataTotal(),", charts total=",charts_total,", change=",change);
   //--- If there are no changes, leave
   if(change==0)
      return;
   //--- If a chart is added in the terminal
   if(change>0)
     {
      //--- Find the missing chart object, create and add it to the collection list
      this.FindAndCreateMissingChartObj();
      //--- Get the current chart and return to it since
      //--- adding a new chart switches the focus to it
      CChartObj *chart=this.GetChart(GetMainChartID());
      if(chart!=NULL)
         chart.SetBringToTopON(true);
     }
   //--- If a chart is removed from the terminal
   else if(change<0)
    {
     //--- Find an extra chart object in the collection list and remove it from the list
     this.FindAndDeleteExcessChartObj();
    }
   //--- In the loop by the number of chart objects in the list,
   for(int i=0;i<this.m_list.Total();i++)
     {
      //--- get the next chart object and
      CChartObj *chart=this.m_list.At(i);
      if(chart==NULL)
         continue;
      //--- update it
      chart.Refresh();
     }
  }
//+------------------------------------------------------------------+
メソッドロジック全体は、コードへのコメントで説明されています。つまり、まずクライアントターミナルで開いているチャートの数の変化を確認します。チャートが追加されている場合は、FindAndCreateMissingChartObj()メソッドを呼び出します。このメソッドでは、不足しているチャートオブジェクトが検索されて作成され、コレクションリストに追加されます。その後、プログラムでフォーカスが現在のチャートに切り替わります(ターミナルに新しいチャートを追加するとフォーカスが切り替わります)。チャートがクライアントターミナルから削除された場合は、メソッドを呼び出して追加のチャートオブジェクトを検索し、リストから削除します。最後に、すべてのチャートオブジェクトが更新されます。チャートオブジェクトのRefresh()メソッドは、チャートに接続されているウィンドウの数の変更を確認し、変更が検出された場合は、独自のウィンドウリストでそれらの数を変更します。
以下は、IDで定義されたチャートオブジェクトを更新するメソッドです。
//+------------------------------------------------------------------+
//| Update the specified chart object                                |
//+------------------------------------------------------------------+
void CChartObjCollection::Refresh(const long chart_id)
  {
   CChartObj *chart=this.GetChart(chart_id);
   if(chart==NULL)
      return;
   chart.Refresh();
  }
//+------------------------------------------------------------------+
ここでは、コレクションリストからIDでチャートオブジェクトを取得し、更新します。
以下は、完全なコレクションリストを操作ログに返すメソッドです。
//+------------------------------------------------------------------+
//| Display complete collection description to the journal           |
//+------------------------------------------------------------------+
void CChartObjCollection::Print(void)
  {
   //--- Display the header in the journal and print all chart objects in full
   ::Print(CMessage::Text(MSG_CHART_COLLECTION_TEXT_CHART_COLLECTION),":");
   for(int i=0;i<this.m_list.Total();i++)
     {
      CChartObj *chart=this.m_list.At(i);
      if(chart==NULL)
         continue;
      chart.Print();
     }
  }
//+------------------------------------------------------------------+
ここでは、最初にヘッダーを出力してから、コレクションリスト内のオブジェクトの総数によるループで、次のチャートオブジェクトを取得して、完全な説明を表示します。
以下は、短いコレクションリストを操作ログに返すメソッドです。
//+------------------------------------------------------------------+
//| Display the short collection description in the journal          |
//+------------------------------------------------------------------+
void CChartObjCollection::PrintShort(void)
  {
   //--- Display the header in the journal and print short descriptions of chart objects
   ::Print(CMessage::Text(MSG_CHART_COLLECTION_TEXT_CHART_COLLECTION),":");
   for(int i=0;i<this.m_list.Total();i++)
     {
      CChartObj *chart=this.m_list.At(i);
      if(chart==NULL)
         continue;
      chart.PrintShort(true);
     }
  }
//+------------------------------------------------------------------+
メソッドロジックは、操作ログにチャートオブジェクトの簡単な説明が表示されることを除いて、上記で検討したものと同じです。
以下は、ターミナル内のチャートの数を返すメソッドです。
//+------------------------------------------------------------------+
//| Return the number of charts in the terminal                      |
//+------------------------------------------------------------------+
int CChartObjCollection::ChartsTotal(void) const
  {
   //--- Declare the variables and get the first chart ID
   long currChart,prevChart=::ChartFirst();
   int res=1; // We definitely have one chart - the current one
   //--- In the loop by the total number of terminal charts (not more than 100)
   while(res<CHARTS_MAX)
     {
      //--- based on the previous one, get the new chart
      currChart=::ChartNext(prevChart);
      //--- When reaching the end of the chart list, complete the loop
      if(currChart<0) break;
      prevChart=currChart;
      res++;
     }
   //--- Return the obtained loop counter
   return res;
  }
//+------------------------------------------------------------------+
メソッドのロジックは、コードのコメントで説明されています。つまり、開いているチャートは少なくとも1つあります。これは、プログラムが開始されたチャートです。ループカウンタは1から始まります。次に、ループ内で、カウンタを増やしながら、前のチャートに基づいて後続の各チャートを受信します。その結果、ループの終了後、ループで取得したカウンタ値を返します。
以下は、新しいチャートオブジェクトを作成してコレクションリストに追加するメソッドです。
//+------------------------------------------------------------------+
//| Create a new chart object and add it to the list                 |
//+------------------------------------------------------------------+
bool CChartObjCollection::CreateNewChartObj(const long chart_id,const string source)
  {
   ::ResetLastError();
   CChartObj *chart_obj=new CChartObj(chart_id);
   if(chart_obj==NULL)
     {
      CMessage::ToLog(source,MSG_CHART_COLLECTION_ERR_FAILED_CREATE_CHART_OBJ,true);
      return false;
     }
   this.m_list.Sort(SORT_BY_CHART_ID);
   if(!this.m_list.InsertSort(chart_obj))
     {
      CMessage::ToLog(source,MSG_CHART_COLLECTION_ERR_FAILED_ADD_CHART,true);
      delete chart_obj;
      return false;
     }
   return true;
  }
//+------------------------------------------------------------------+
ここで、メソッドは、チャートオブジェクトを作成するチャートのID(chart_id)と、メソッドの呼び出し元のメソッドの名前(source)を受け取ります。新しいチャートオブジェクトを作成します。作成できなかった場合、適切なメッセージを表示してfalseを返します。オブジェクトが正常に作成されたら、チャートIDで並べ替えられたリストのフラグをコレクションリストに設定し、並べ替えられたリストにオブジェクトを追加してみます。オブジェクトをリストに追加できなかった場合、適切なメッセージを表示し、新しく作成されたオブジェクトを削除してfalseを返します。成功した場合は、trueを返します。
以下は、チャートIDによってチャートオブジェクトへのポインタを返すメソッドです。
//+------------------------------------------------------------------+
//| Return the pointer to the chart object by ID                     |
//+------------------------------------------------------------------+
CChartObj *CChartObjCollection::GetChart(const long id)
  {
   CArrayObj *list=CSelect::ByChartProperty(GetList(),CHART_PROP_ID,id,EQUAL);
   return(list!=NULL ? list.At(0) : NULL);
  }
//+------------------------------------------------------------------+
ここで、メソッドに渡された値と等しい「ChartID」プロパティを持つチャートオブジェクトのリストを取得します(チャートIDは一意であるため、リストには単一のチャートオブジェクトが含まれる場合があります)。 オブジェクトが新しいリストで単一の要素から取得された場合は、それを返します。それ以外の場合はすべて、NULLを返します—オブジェクトは受信されません。
以下は、チャートオブジェクトの存在を示すフラグを返すメソッドです。
//+------------------------------------------------------------------+
//| Return the flag indicating the existence of a chart object       |
//+------------------------------------------------------------------+
bool CChartObjCollection::IsPresentChartObj(const long chart_id)
  {
   return(this.GetChart(chart_id)!=NULL);
  }
//+------------------------------------------------------------------+
ここで、コレクションリストから指定されたIDのオブジェクトを取得できる場合(リクエスト結果がNULLではない)、trueを返します。それ以外の場合は、falseを返します。
以下は、クライアントターミナルにチャートが存在することを示すフラグを返すメソッドです。
//+------------------------------------------------------------------+
//| Return the flag indicating the existence of a chart              |
//+------------------------------------------------------------------+
bool CChartObjCollection::IsPresentChart(const long chart_id)
  {
   //--- Declare the variables and get the first chart ID
   long curr_chart,prev_chart=::ChartFirst();
   //--- If the IDs match, return 'true'
   if(prev_chart==chart_id)
      return true;
   int i=0;
   //--- In the loop by the total number of terminal charts (not more than 100)
   while(i<CHARTS_MAX)
     {
      //--- based on the previous one, get the new chart
      curr_chart=::ChartNext(prev_chart);
      //--- When reaching the end of the chart list, complete the loop
      if(curr_chart<0) break;
      //--- If the IDs match, return 'true'
      if(curr_chart==chart_id)
         return true;
      //--- remember the current chart ID for ChartNext() and increase the loop counter
      prev_chart=curr_chart;
      i++;
     }
   return false;
  }
//+------------------------------------------------------------------+
ここで、前のチャートIDに基づいて取得されたターミナルチャートによるループで、ループで現在選択されているチャートのIDがメソッドに渡された値と一致するかどうかを確認します。値が一致する場合、そのようなIDのチャートが存在する場合は、true</ s1>を返します。
ループが完了したら、。指定されたIDのチャートが見つからなかったためfalseを返します。
以下は、不足しているチャートオブジェクトを検索し、それを作成してコレクションリストに追加するメソッドです。
//+------------------------------------------------------------------+
//| Find a missing chart object,                                     |
//| create it and add to the collection list                         |
//+------------------------------------------------------------------+
bool CChartObjCollection::FindAndCreateMissingChartObj(void)
  {
   //--- Declare the variables and get the first chart ID
   long curr_chart,prev_chart=::ChartFirst();
   int i=0;
   //--- If the first chart object is not in the list, attempt to create and add it to the list
   if(!this.IsPresentChartObj(prev_chart) && !this.CreateNewChartObj(prev_chart,DFUN))
      return false;
   //--- In the loop by the total number of terminal charts (not more than 100), look for the rest of the charts
   while(i<CHARTS_MAX)
     {
      //--- based on the previous one, get the new chart
      curr_chart=::ChartNext(prev_chart);
      //--- When reaching the end of the chart list, complete the loop
      if(curr_chart<0) break;
      //--- If the object is not in the list, attempt to create and add it to the list
      if(!this.IsPresentChartObj(curr_chart) && !this.CreateNewChartObj(curr_chart,DFUN))
         return false;
      //--- remember the current chart ID for ChartNext() and increase the loop counter
      prev_chart=curr_chart;
      i++;
     }
   return true;
  }
//+------------------------------------------------------------------+
ここでは、前のチャートIDに基づくチャートによるループも使用します。まず、コレクションリスト内のプログラムを使用してチャートオブジェクトの有無を確認し、次にループ内の残りのすべてのチャートによって、ターミナルに存在するチャートの欠落しているオブジェクトを検索し、それらをコレクションリストに追加します。
以下は、ターミナルにはないがコレクションリストにはあるチャートオブジェクトを検索して削除するメソッドです。
//+-----------------------------------------------------------------------------+
//|Find a chart object not present in the terminal and remove it from the list  |
//+-----------------------------------------------------------------------------+
void CChartObjCollection::FindAndDeleteExcessChartObj(void)
  {
   for(int i=this.m_list.Total()-1;i>WRONG_VALUE;i--)
     {
      CChartObj *chart=this.m_list.At(i);
      if(chart==NULL)
         continue;
      if(!this.IsPresentChart(chart.ID()))
        {
         m_list.Delete(i);
        }
     }
  }
//+------------------------------------------------------------------+
ここで、コレクションリスト内のすべてのチャートオブジェクトの逆ループで、別のチャートオブジェクトを取得します。クライアントターミナルにチャートオブジェクトのIDと一致するIDのチャートが含まれていない場合、コレクションリストからオブジェクトを削除します。
これで、チャートオブジェクトコレクションクラスの最初のバージョンの作成が完了しました。
次に、作成したチャートオブジェクトコレクションクラスのファイルをCEngineライブラリのメインクラスに含め、チャートオブジェクトコレクションクラスのメソッドにアクセスするためのメソッドを作成して、プログラムからそれらを操作できるようにする必要があります。
CEngine クラスの\MQL5\Include\DoEasy\Engine.mqhに、新しく作成されたチャートオブジェクトコレクションクラスのファイルをインクルードします。
//+------------------------------------------------------------------+
//|                                                       Engine.mqh |
//|                        Copyright 2020, MetaQuotes Software Corp. |
//|                             https://mql5.com/en/users/artmedia70 |
//+------------------------------------------------------------------+
#property copyright "Copyright 2020, MetaQuotes Software Corp."
#property link      "https://mql5.com/en/users/artmedia70"
#property version   "1.00"
//+------------------------------------------------------------------+
//| Include files                                                    |
//+------------------------------------------------------------------+
#include "Services\TimerCounter.mqh"
#include "Collections\HistoryCollection.mqh"
#include "Collections\MarketCollection.mqh"
#include "Collections\EventsCollection.mqh"
#include "Collections\AccountsCollection.mqh"
#include "Collections\SymbolsCollection.mqh"
#include "Collections\ResourceCollection.mqh"
#include "Collections\TimeSeriesCollection.mqh"
#include "Collections\BuffersCollection.mqh"
#include "Collections\IndicatorsCollection.mqh"
#include "Collections\TickSeriesCollection.mqh"
#include "Collections\BookSeriesCollection.mqh"
#include "Collections\MQLSignalsCollection.mqh"
#include "Collections\ChartObjCollection.mqh"
#include "TradingControl.mqh"
//+------------------------------------------------------------------+
クラスのprivateセクションでチャートコレクションクラスのオブジェクトを宣言します。
//+------------------------------------------------------------------+
//| Library basis class                                              |
//+------------------------------------------------------------------+
class CEngine
  {
private:
   CHistoryCollection   m_history;                       // Collection of historical orders and deals
   CMarketCollection    m_market;                        // Collection of market orders and deals
   CEventsCollection    m_events;                        // Event collection
   CAccountsCollection  m_accounts;                      // Account collection
   CSymbolsCollection   m_symbols;                       // Symbol collection
   CTimeSeriesCollection m_time_series;                  // Timeseries collection
   CBuffersCollection   m_buffers;                       // Collection of indicator buffers
   CIndicatorsCollection m_indicators;                   // Indicator collection
   CTickSeriesCollection m_tick_series;                  // Collection of tick series
   CMBookSeriesCollection m_book_series;                 // Collection of DOM series
   CMQLSignalsCollection m_signals_mql5;                 // Collection of MQL5.com Signals service signals
   CChartObjCollection  m_charts;                        // Chart collection
   CResourceCollection  m_resource;                      // Resource list
   CTradingControl      m_trading;                       // Trading management object
   CPause               m_pause;                         // Pause object
   CArrayObj            m_list_counters;                 // List of timer counters
クラスのpublicセクションに、チャートオブジェクコレクションクラスにアクセスするためのメソッドを追加します。
//--- Display (1) the complete, (2) short collection description in the journal and (3) parameters of the signal copying settings
   void                 SignalsMQL5Print(void)                                         { m_signals_mql5.Print();                             }
   void                 SignalsMQL5PrintShort(const bool list=false,const bool paid=true,const bool free=true)
                                                                                       { m_signals_mql5.PrintShort(list,paid,free);          }
   void                 SignalsMQL5CurrentSubscriptionParameters(void)                 { this.m_signals_mql5.CurrentSubscriptionParameters();}

//--- Current the chart collection
   bool                 ChartCreateCollection(void)                                    { return this.m_charts.CreateCollection();            }
//--- Return (1) the chart collection and (2) the list of charts from the chart collection
   CChartObjCollection *GetChartObjCollection(void)                                    { return &this.m_charts;                              }
   CArrayObj           *GetListCharts(void)                                            { return this.m_charts.GetList();                     }

//--- Return (1) the specified chart object and (2) the chart object with the program
   CChartObj           *ChartGetChartObj(const long chart_id)                          { return this.m_charts.GetChart(chart_id);            }
   CChartObj           *ChartGetMainChart(void)                                        { return this.m_charts.GetChart(this.m_charts.GetMainChartID());}

//--- Update (1) the chart specified by ID and (2) all charts
   void                 ChartRefresh(const long chart_id)                              { this.m_charts.Refresh(chart_id);                    }
   void                 ChartsRefreshAll(void)                                         { this.m_charts.Refresh();                            }

//--- Return the list of chart objects by (1) symbol and (2) timeframe
   CArrayObj           *ChartGetChartsList(const string symbol)                        { return this.m_charts.GetChartsList(symbol);         }
   CArrayObj           *ChartGetChartsList(const ENUM_TIMEFRAMES timeframe)            { return this.m_charts.GetChartsList(timeframe);      }

//--- Return (1) the buffer collection and (2) the buffer list from the collection
新しく更新されたすべてのメソッドは、上記で検討した適切なチャートオブジェクトコレクションメソッドを呼び出した結果を返すだけです。これらのメソッドはすべて表示され、ライブラリベースのプログラムで使用できます。
クラスコンストラクタで、チャートオブジェクトコレクションクラスの新しいカウンタの作成を追加します。
//+------------------------------------------------------------------+
//| CEngine constructor                                              |
//+------------------------------------------------------------------+
CEngine::CEngine() : m_first_start(true),
                     m_last_trade_event(TRADE_EVENT_NO_EVENT),
                     m_last_account_event(WRONG_VALUE),
                     m_last_symbol_event(WRONG_VALUE),
                     m_global_error(ERR_SUCCESS)
  {
   this.m_is_hedge=#ifdef __MQL4__ true #else bool(::AccountInfoInteger(ACCOUNT_MARGIN_MODE)==ACCOUNT_MARGIN_MODE_RETAIL_HEDGING) #endif;
   this.m_is_tester=::MQLInfoInteger(MQL_TESTER);
   this.m_program=(ENUM_PROGRAM_TYPE)::MQLInfoInteger(MQL_PROGRAM_TYPE);
   this.m_name=::MQLInfoString(MQL_PROGRAM_NAME);

   this.m_list_counters.Sort();
   this.m_list_counters.Clear();
   this.CreateCounter(COLLECTION_ORD_COUNTER_ID,COLLECTION_ORD_COUNTER_STEP,COLLECTION_ORD_PAUSE);
   this.CreateCounter(COLLECTION_ACC_COUNTER_ID,COLLECTION_ACC_COUNTER_STEP,COLLECTION_ACC_PAUSE);
   this.CreateCounter(COLLECTION_SYM_COUNTER_ID1,COLLECTION_SYM_COUNTER_STEP1,COLLECTION_SYM_PAUSE1);
   this.CreateCounter(COLLECTION_SYM_COUNTER_ID2,COLLECTION_SYM_COUNTER_STEP2,COLLECTION_SYM_PAUSE2);
   this.CreateCounter(COLLECTION_REQ_COUNTER_ID,COLLECTION_REQ_COUNTER_STEP,COLLECTION_REQ_PAUSE);
   this.CreateCounter(COLLECTION_TS_COUNTER_ID,COLLECTION_TS_COUNTER_STEP,COLLECTION_TS_PAUSE);
   this.CreateCounter(COLLECTION_IND_TS_COUNTER_ID,COLLECTION_IND_TS_COUNTER_STEP,COLLECTION_IND_TS_PAUSE);
   this.CreateCounter(COLLECTION_TICKS_COUNTER_ID,COLLECTION_TICKS_COUNTER_STEP,COLLECTION_TICKS_PAUSE);
   this.CreateCounter(COLLECTION_CHARTS_COUNTER_ID,COLLECTION_CHARTS_COUNTER_STEP,COLLECTION_CHARTS_PAUSE);

   ::ResetLastError();
   #ifdef __MQL5__
      if(!::EventSetMillisecondTimer(TIMER_FREQUENCY))
        {
         ::Print(DFUN_ERR_LINE,CMessage::Text(MSG_LIB_SYS_FAILED_CREATE_TIMER),(string)::GetLastError());
         this.m_global_error=::GetLastError();
        }
   //---__MQL4__
   #else
      if(!this.IsTester() && !::EventSetMillisecondTimer(TIMER_FREQUENCY))
        {
         ::Print(DFUN_ERR_LINE,CMessage::Text(MSG_LIB_SYS_FAILED_CREATE_TIMER),(string)::GetLastError());
         this.m_global_error=::GetLastError();
        }
   #endif
   //---
  }
//+------------------------------------------------------------------+
クラスタイマーで、チャートオブジェクトコレクションを操作するためのコードブロックを追加します。
//+------------------------------------------------------------------+
//| CEngine timer                                                    |
//+------------------------------------------------------------------+
void CEngine::OnTimer(SDataCalculate &data_calculate)
  {
//--- If this is not a tester, work with collection events by timer
   if(!this.IsTester())
     {
   //--- Timer of the collections of historical orders and deals, as well as of market orders and positions
      int index=this.CounterIndex(COLLECTION_ORD_COUNTER_ID);
      CTimerCounter* cnt1=this.m_list_counters.At(index);
      if(cnt1!=NULL)
        {
         //--- If unpaused, work with the order, deal and position collections events
         if(cnt1.IsTimeDone())
            this.TradeEventsControl();
        }
   //--- Account collection timer
      index=this.CounterIndex(COLLECTION_ACC_COUNTER_ID);
      CTimerCounter* cnt2=this.m_list_counters.At(index);
      if(cnt2!=NULL)
        {
         //--- If unpaused, work with the account collection events
         if(cnt2.IsTimeDone())
            this.AccountEventsControl();
        }
   //--- Timer 1 of the symbol collection (updating symbol quote data in the collection)
      index=this.CounterIndex(COLLECTION_SYM_COUNTER_ID1);
      CTimerCounter* cnt3=this.m_list_counters.At(index);
      if(cnt3!=NULL)
        {
         //--- If the pause is over, update quote data of all symbols in the collection
         if(cnt3.IsTimeDone())
            this.m_symbols.RefreshRates();
        }
   //--- Timer 2 of the symbol collection (updating all data of all symbols in the collection and tracking symbl and symbol search events in the market watch window)
      index=this.CounterIndex(COLLECTION_SYM_COUNTER_ID2);
      CTimerCounter* cnt4=this.m_list_counters.At(index);
      if(cnt4!=NULL)
        {
         //--- If the pause is over
         if(cnt4.IsTimeDone())
           {
            //--- update data and work with events of all symbols in the collection
            this.SymbolEventsControl();
            //--- When working with the market watch list, check the market watch window events
            if(this.m_symbols.ModeSymbolsList()==SYMBOLS_MODE_MARKET_WATCH)
               this.MarketWatchEventsControl();
           }
        }
   //--- Trading class timer
      index=this.CounterIndex(COLLECTION_REQ_COUNTER_ID);
      CTimerCounter* cnt5=this.m_list_counters.At(index);
      if(cnt5!=NULL)
        {
         //--- If unpaused, work with the list of pending requests
         if(cnt5.IsTimeDone())
            this.m_trading.OnTimer();
        }
   //--- Timeseries collection timer
      index=this.CounterIndex(COLLECTION_TS_COUNTER_ID);
      CTimerCounter* cnt6=this.m_list_counters.At(index);
      if(cnt6!=NULL)
        {
         //--- If the pause is over, work with the timeseries list (update all except the current one)
         if(cnt6.IsTimeDone())
            this.SeriesRefreshAllExceptCurrent(data_calculate);
        }

   //--- Timer of timeseries collection of indicator buffer data
      index=this.CounterIndex(COLLECTION_IND_TS_COUNTER_ID);
      CTimerCounter* cnt7=this.m_list_counters.At(index);
      if(cnt7!=NULL)
        {
         //--- If the pause is over, work with the timeseries list of indicator data (update all except for the current one)
         if(cnt7.IsTimeDone())
            this.IndicatorSeriesRefreshAll();
        }
   //--- Tick series collection timer
      index=this.CounterIndex(COLLECTION_TICKS_COUNTER_ID);
      CTimerCounter* cnt8=this.m_list_counters.At(index);
      if(cnt8!=NULL)
        {
         //--- If the pause is over, work with the tick series list (update all except the current one)
         if(cnt8.IsTimeDone())
            this.TickSeriesRefreshAllExceptCurrent();
        }
   //--- Chart collection timer
      index=this.CounterIndex(COLLECTION_CHARTS_COUNTER_ID);
      CTimerCounter* cnt9=this.m_list_counters.At(index);
      if(cnt9!=NULL)
        {
         //--- If unpaused, work with the chart list
         if(cnt9.IsTimeDone())
            this.ChartsRefreshAll();
        }
     }
//--- If this is a tester, work with collection events by tick
   else
     {
      //--- work with events of collections of orders, deals and positions by tick
      this.TradeEventsControl();
      //--- work with events of collections of accounts by tick
      this.AccountEventsControl();
      //--- update quote data of all collection symbols by tick
      this.m_symbols.RefreshRates();
      //--- work with events of all symbols in the collection by tick
      this.SymbolEventsControl();
      //--- work with the list of pending orders by tick
      this.m_trading.OnTimer();
      //--- work with the timeseries list by tick
      this.SeriesRefresh(data_calculate);
      //--- work with the timeseries list of indicator buffers by tick
      this.IndicatorSeriesRefreshAll();
      //--- work with the list of tick series by tick
      this.TickSeriesRefreshAll();
     }
  }
//+------------------------------------------------------------------+
コレクションタイマーカウンタが0.5秒をカウントするとすぐに、コレクション内のすべてのチャートオブジェクトを更新するメソッドが呼び出されます。したがって、開いている各チャートに接続されているターミナルとウィンドウのチャート数の変更を自動追跡します。
今日作成されたクラスの動作をテストします。
検証
テストを実行するには、前の記事のEAを使用して、\MQL5\Experts\TestDoEasy\Part69\にTestDoEasyPart69.mq5として保存します。
実際、以前のエキスパートアドバイザーのロジックはあまり変更しません。ターミナルでチャートが開いているすべてのチャートオブジェクトの簡単な説明を表示し、メインチャートの完全な説明を表示します。さらに、チャートオブジェクトコレクションクラスのコレクションリストを更新するメソッドは、コレクション内のチャートオブジェクトの数、適切な開いているチャートの数、およびこれらの数の違いを通知するチャートメッセージを表示する機能を備えています。このデバッグコメントは後で削除します。本稿では、これを使用して、チャートオブジェクトコレクションクラスが正しく機能するかどうかを確認します。
まず、 EAコードからチャートオブジェクトクラスファイルのインクルードを削除します。
//+------------------------------------------------------------------+
//|                                             TestDoEasyPart68.mq5 |
//|                        Copyright 2021, MetaQuotes Software Corp. |
//|                             https://mql5.com/en/users/artmedia70 |
//+------------------------------------------------------------------+
#property copyright "Copyright 2021, MetaQuotes Software Corp."
#property link      "https://mql5.com/en/users/artmedia70"
#property version   "1.00"
//--- includes
#include <DoEasy\Engine.mqh>
#include <DoEasy\Objects\Chart\ChartObj.mqh>
//--- enums
これで、チャートオブジェクトコレクションクラスがライブラリのメインオブジェクトに接続され、すべてのチャートクラスとそのコレクションをライブラリのメインオブジェクトから利用できるようになりました。
入力ブロックで、プログラムでチャートオブジェクトコレクションクラスを使用する必要性を示すフラグを指定する変数を追加します。
//--- input variables
input    ushort            InpMagic             =  123;  // Magic number
input    double            InpLots              =  0.1;  // Lots
input    uint              InpStopLoss          =  150;  // StopLoss in points
input    uint              InpTakeProfit        =  150;  // TakeProfit in points
input    uint              InpDistance          =  50;   // Pending orders distance (points)
input    uint              InpDistanceSL        =  50;   // StopLimit orders distance (points)
input    uint              InpDistancePReq      =  50;   // Distance for Pending Request's activate (points)
input    uint              InpBarsDelayPReq     =  5;    // Bars delay for Pending Request's activate (current timeframe)
input    uint              InpSlippage          =  5;    // Slippage in points
input    uint              InpSpreadMultiplier  =  1;    // Spread multiplier for adjusting stop-orders by StopLevel
input    uchar             InpTotalAttempts     =  5;    // Number of trading attempts
sinput   double            InpWithdrawal        =  10;   // Withdrawal funds (in tester)

sinput   uint              InpButtShiftX        =  0;    // Buttons X shift
sinput   uint              InpButtShiftY        =  10;   // Buttons Y shift

input    uint              InpTrailingStop      =  50;   // Trailing Stop (points)
input    uint              InpTrailingStep      =  20;   // Trailing Step (points)
input    uint              InpTrailingStart     =  0;    // Trailing Start (points)
input    uint              InpStopLossModify    =  20;   // StopLoss for modification (points)
input    uint              InpTakeProfitModify  =  60;   // TakeProfit for modification (points)

sinput   ENUM_SYMBOLS_MODE InpModeUsedSymbols   =  SYMBOLS_MODE_CURRENT;            // Mode of used symbols list
sinput   string            InpUsedSymbols       =  "EURUSD,AUDUSD,EURAUD,EURCAD,EURGBP,EURJPY,EURUSD,GBPUSD,NZDUSD,USDCAD,USDJPY";  // List of used symbols (comma - separator)
sinput   ENUM_TIMEFRAMES_MODE InpModeUsedTFs    =  TIMEFRAMES_MODE_LIST;            // Mode of used timeframes list
sinput   string            InpUsedTFs           =  "M1,M5,M15,M30,H1,H4,D1,W1,MN1"; // List of used timeframes (comma - separator)

sinput   ENUM_INPUT_YES_NO InpUseBook           =  INPUT_YES;                       // Use Depth of Market
sinput   ENUM_INPUT_YES_NO InpUseMqlSignals     =  INPUT_YES;                       // Use signal service
sinput   ENUM_INPUT_YES_NO InpUseCharts         =  INPUT_YES;                       // Use Charts control
sinput   ENUM_INPUT_YES_NO InpUseSounds         =  INPUT_YES;                       // Use sounds

//--- global variables
EAのOnTick()ハンドラから、チャートオブジェクトのリストを作成して操作ログにその説明を表示していたコードブロックを削除します。
//+------------------------------------------------------------------+
//| Expert tick function                                             |
//+------------------------------------------------------------------+
void OnTick()
  {
//--- Handle the NewTick event in the library
   engine.OnTick(rates_data);

//--- If working in the tester
   if(MQLInfoInteger(MQL_TESTER))
     {
      engine.OnTimer(rates_data);   // Working in the timer
      PressButtonsControl();        // Button pressing control
      engine.EventsHandling();      // Working with events
     }

//--- If the trailing flag is set
   if(trailing_on)
     {
      TrailingPositions();          // Trailing positions
      TrailingOrders();             // Trailing pending orders
     }

//--- If it is the first launch
   static bool done=false;
   if(!done)
     {
      //--- Create the list object for storing chart objects
      CArrayObj *list=new CArrayObj();
      if(list==NULL)
         return;
      //--- Declare the variables and get the first chart ID
      long currChart,prevChart=ChartFirst();
      int i=0;
      //--- Create the chart object and add it to the list
      CChartObj *chart_first=new CChartObj(prevChart);
      list.Add(chart_first);
      //--- In the loop by the total number of terminal charts (not more than 100)
      while(i<CHARTS_MAX)
        {
         //--- based on the previous one, get the new chart
         currChart=ChartNext(prevChart);
         //--- When reaching the end of the chart list, complete the loop
         if(currChart<0) break;
         //--- Create the chart object based on the current chart ID in the loop and add it to the list
         CChartObj *chart=new CChartObj(currChart);
         list.Add(chart);
         //--- remember the current chart ID for ChartNext() and increase the loop counter
         prevChart=currChart;
         i++;
        }
      Print("");
      //--- From the filled list in the loop, receive the next chart object and display its short description
      int total=list.Total();
      for(int j=0;j<total;j++)
        {
         CChartObj *chart_obj=list.At(j);
         if(chart_obj!=NULL)
            chart_obj.PrintShort();
        }
      Print("");
      //--- Display the full description of the current chart: in the loop by all objects of the created list
      for(int j=0;j<total;j++)
        {
         //--- get the next chart object and
         CChartObj *chart_obj=list.At(j);
         //--- if its symbol matches the current chart symbol, display its full description in the journal
         if(chart_obj!=NULL && chart_obj.Symbol()==Symbol())
            chart_obj.Print();
        }
      //--- Destroy the list of chart objects
      delete list;
      done=true;
     }
//---
  }
//+------------------------------------------------------------------+
これはすべて、次のコードを使用して実行されます。
//+------------------------------------------------------------------+
//| Expert tick function                                             |
//+------------------------------------------------------------------+
void OnTick()
  {
//--- Handle the NewTick event in the library
   engine.OnTick(rates_data);

//--- If working in the tester
   if(MQLInfoInteger(MQL_TESTER))
     {
      engine.OnTimer(rates_data);   // Working in the timer
      PressButtonsControl();        // Button pressing control
      engine.EventsHandling();      // Working with events
     }

//--- If the trailing flag is set
   if(trailing_on)
     {
      TrailingPositions();          // Trailing positions
      TrailingOrders();             // Trailing pending orders
     }

//--- If it is the first launch
   static bool done=false;
   if(!done)
     {
      //--- Get the chart with the EA from the collection and display its full description
      CChartObj *chart_main=engine.ChartGetMainChart();
      Print("");
      chart_main.Print();
      done=true;
     }
//---
  }
//+------------------------------------------------------------------+
ここでは、EAが起動されたチャートの完全な説明のみを見ることができます。コレクション内のすべてのチャートオブジェクトの簡単な説明は、OnInitDoEasy()関数の次のコードブロックに表示されます。
//--- If working with signals is not enabled or failed to create the signal collection,
//--- disable copying deals by subscription
   else
      engine.SignalsMQL5CurrentSetSubscriptionEnableOFF();

//--- Create the chart collection
//--- If working with charts and the chart collection is created
   if(InpUseCharts && engine.ChartCreateCollection())
     {
      //--- Check created chart objects - display the short collection description in the journal
      engine.GetChartObjCollection().PrintShort();
     }

//--- Create resource text files
EAのOnBookEvent()ハンドラで、現在必要のない、チャートのMarketDepthコレクションクラスからのデバッグデータの表示をコメントアウトします(現時点では、板情報で作業するときにEAが非常に長い間応答しないという奇妙なターミナル動作が時折発生しており、この情報はしばしばその値を変更してその作業を確認できるため、このデータは存在したままです)。さらに、コメントにより、チャートオブジェクトコレクションクラスによって検出された変更を確認できなくなります。
//+------------------------------------------------------------------+
//| OnBookEvent function                                             |
//+------------------------------------------------------------------+
void OnBookEvent(const string& symbol)
  {
   static bool first=true;
   //--- Leave if failed to update the symbol snapshot series
   if(!engine.OnBookEvent(symbol))
      return;
   //--- Work by the current symbol
   if(symbol==Symbol())
     {
      //--- Get the DOM snapshot series of the current symbol
      CMBookSeries *book_series=engine.GetMBookSeries(symbol);
      if(book_series==NULL)
         return;
      //--- Get the last DOM snapshot object from the DOM snapshot series object
      CMBookSnapshot *book=book_series.GetLastMBook();
      if(book==NULL)
         return;
      //--- Get the very first and last DOM order objects from the DOM snapshot object
      CMarketBookOrd *ord_0=book.GetMBookByListIndex(0);
      CMarketBookOrd *ord_N=book.GetMBookByListIndex(book.DataTotal()-1);
      if(ord_0==NULL || ord_N==NULL) return;
      //--- Display the time of the current DOM snapshot in the chart comment,
      //--- the maximum number of displayed orders in DOM for a symbol,
      //--- the obtained number of orders in the current DOM snapshot,
      //--- the total number of DOM snapshots set in the series list and
      //--- the highest and lowest orders of the current DOM snapshot
      //Comment
      //  (
      //   DFUN,book.Symbol(),": ",TimeMSCtoString(book.Time()),
      //   //", symbol book size=",sym.TicksBookdepth(),
      //   ", last book data total: ",book.DataTotal(),
      //   ", series books total: ",book_series.DataTotal(),
      //   "\nMax: ",ord_N.Header(),"\nMin: ",ord_0.Header()
      //  );
      //--- Display the first DOM snapshot in the journal
      if(first)
        {
         //--- series description
         book_series.Print();
         //--- snapshot description
         book.Print();
         first=false;
        }
     }
  }
//+------------------------------------------------------------------+
EAをコンパイルしましょう。ターミナルで任意の4つのチャートを開き(最初のチャートでEAを起動)、前の記事のテストでのチャートと一致する環境を作成します。
EAを使用してチャートにフラクタル指標を追加して、指標ウィンドウを追加します。たとえば、DeMarkerデータに基づくAMAなどの別の指標を含むDeMarkerです。
2番目のチャートにストキャスティクスウィンドウを配置します...
EAを起動すると、作成されたチャートオブジェクトコレクションオブジェクトのデータとプログラムを含むチャートが操作ログに表示されます。
Chart collection:
- Main chart window EURUSD H4 ID: 131733844391938630, HWND: 920114, Subwindows: 1
- Main chart window GBPUSD H4 ID: 131733844391938633, HWND: 592798, Subwindows: No
- Main chart window AUDUSD H1 ID: 131733844391938634, HWND: 527424, Subwindows: 2
- Main chart window USDRUB H4 ID: 131733844391938635, HWND: 920468, Subwindows: No
Subscribed to Depth of Market EURUSD
Library initialization time: 00:00:05.922

============= The beginning of the parameter list (Main chart window EURUSD H4) =============
Chart ID: 131733844391938630
Timeframe: H4
Drawing attributes of a price chart: Yes
Object "Chart": No
Chart on top of other charts: No
Accessing the context menu by pressing the right mouse button: Yes
Accessing the "Crosshair tool" by pressing the middle mouse button: Yes
Scrolling the chart horizontally using the left mouse button: Yes
Sending messages about mouse wheel events to all mql5 programs on a chart: No
Send notifications of mouse move and mouse click events to all mql5 programs on a chart: No
Send a notification of an event of new object creation to all mql5-programs on a chart: No
Send a notification of an event of object deletion to all mql5-programs on a chart: No
Chart type: Display as Japanese candlesticks
Price chart in the foreground: No
Price chart indent from the right border: Yes
Automatic moving to the right border of the chart: Yes
Managing the chart using a keyboard: Yes
Allowed to intercept Space and Enter key presses on the chart to activate the quick navigation bar: Yes
Scale: 2
Fixed scale mode: No
Scale 1:1 mode: No
Scale to be specified in points per bar: No
Display a symbol ticker in the upper left corner: Yes
Display OHLC values in the upper left corner: Yes
Display Bid values as a horizontal line in a chart: Yes
Display Ask values as a horizontal line in a chart: Yes
Display Last values as a horizontal line in a chart: No
Display vertical separators between adjacent periods: No
Display grid in the chart: No
Display volume in the chart: Trade volumes
Display textual descriptions of objects: Yes
The number of bars on the chart that can be displayed: 137
The total number of chart windows, including indicator subwindows: 2
Chart window handle: 920114
Number of the first visible bar in the chart: 136
Chart width in bars: 168
Chart width in pixels: 670
 Main chart window:
 - Chart height in pixels: 293
 Chart subwindow 1:
 - The distance between the upper frame of the indicator subwindow and the upper frame of the main chart window: 295
 - Chart height in pixels: 21
Chart background color: clrWhite
Color of axes, scales and OHLC line: clrBlack
Grid color: clrSilver
Color of volumes and position opening levels: clrGreen
Color for the up bar, shadows and body borders of bull candlesticks: clrBlack
Color for the down bar, shadows and body borders of bear candlesticks: clrBlack
Line chart color and color of "Doji" Japanese candlesticks: clrBlack
Body color of a bull candlestick: clrWhite
Body color of a bear candlestick: clrBlack
Bid price level color: clrLightSkyBlue
Ask price level color: clrCoral
Line color of the last executed deal price (Last): clrSilver
Color of stop order levels (Stop Loss and Take Profit): clrOrangeRed
Displaying trade levels in the chart (levels of open positions, Stop Loss, Take Profit and pending orders): Yes
Permission to drag trading levels on a chart with a mouse: Yes
Showing the time scale on a chart: Yes
Showing the price scale on a chart: Yes
Showing the "One click trading" panel on a chart: No
Chart window is maximized: Yes
Chart window is minimized: No
The chart window is docked: Yes
The left coordinate of the undocked chart window relative to the virtual screen: 2028
The top coordinate of the undocked chart window relative to the virtual screen: 100
The right coordinate of the undocked chart window relative to the virtual screen: 2654
The bottom coordinate of the undocked chart window relative to the virtual screen: 329
------
The size of the zero bar indent from the right border in percents: 18.93
Chart fixed position from the left border in percent value: 0.00
Fixed  chart maximum: 1.21320
Fixed  chart minimum : 1.16950
Scale in points per bar: 1.00
Chart minimum: 1.16950
Chart maximum: 1.21320
------
Text of a comment in a chart: ""
The name of the Expert Advisor running on the chart: "TestDoEasyPart69"
The name of the script running on the chart: ""
Indicators in the main chart window:
- Indicator Fractals
Indicators in the chart window 1:
- Indicator DeM(14)
- Indicator AMA(14,2,30)
Symbol: "EURUSD"
============= End of the parameter list (Main chart window EURUSD H4) =============
まず、いくつかのチャートを追加し、後で削除します。チャートのコメントは、コレクション内のチャートオブジェクトの数、ターミナルで開かれたチャートの数、およびチャートとオブジェクトの数の違いの継続的な変化を反映しています。
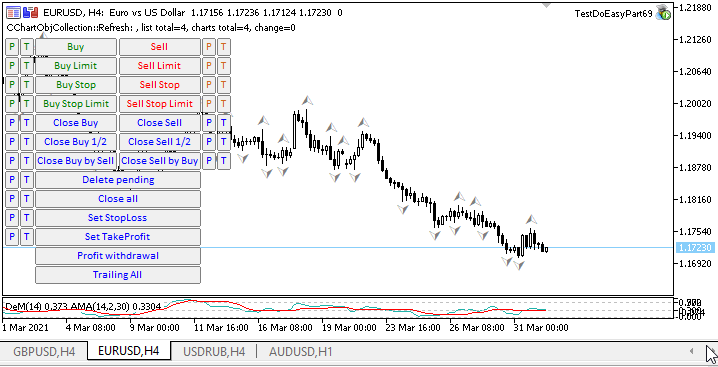
次の段階
次の記事では、チャートオブジェクトコレクションの機能を拡張し続けます。
ライブラリの現在のバージョンのすべてのファイルは、テストおよびダウンロードできるように、MQL5のテストEAファイルと一緒に以下に添付されています。
質問や提案はコメント欄にお願いします。
*連載のこれまでの記事:
DoEasyライブラリでのその他のクラス(第67部): チャットオブジェクトクラス
DoEasyライブラリでのその他のクラス(第68部): チャットウィンドウオブジェクトクラスとチャートでの指標オブジェクトクラス
MetaQuotes Ltdによってロシア語から翻訳されました。
元の記事: https://www.mql5.com/ru/articles/9260
警告: これらの資料についてのすべての権利はMetaQuotes Ltd.が保有しています。これらの資料の全部または一部の複製や再プリントは禁じられています。
この記事はサイトのユーザーによって執筆されたものであり、著者の個人的な見解を反映しています。MetaQuotes Ltdは、提示された情報の正確性や、記載されているソリューション、戦略、または推奨事項の使用によって生じたいかなる結果についても責任を負いません。

 プロのプログラマーからのヒント(第I部): コードの保存、デバッグ、コンパイルプロジェクトとログの操作
 スワップ(第I部):ロックと合成ポジション
 ニューラルネットワークが簡単に(第13回): Batch Normalization
- 無料取引アプリ
- 8千を超えるシグナルをコピー
- 金融ニュースで金融マーケットを探索