
Andere Klassen in der Bibliothek DoEasy (Teil 69): Kollektionsklasse der Chart-Objekte

Inhalt
- Konzept
- Verbesserung der Bibliothek der Klasse
- Die Kollektionsklasse der Chart-Objekte
- Test
- Was kommt als Nächstes?
Konzept
Ich habe bereits die Funktionalität für die Arbeit mit Chart-Objekten vorbereitet. Jetzt haben wir das Chart-Objekt mit den Listen der Chart-Fenster-Objekte, die wiederum die Listen der an sie angehängten Indikatoren enthalten. Es ist an der Zeit, dies in einer einzigen Chart-Objekt-Sammlung zu kombinieren, die einen bequemen Zugriff auf jeden im Terminal geöffneten Chart ermöglicht. Die Kollektion wird es uns ermöglichen, die Chart-Objekt-Listen nach beliebigen Eigenschaften zu suchen, zu sortieren und anzufordern und einen ausgewählten Chart oder mehrere Charts bequem zu handhaben.
Verbesserung der Bibliothek der Klasse
Fügen wir zunächst neue Nachrichten zur Bibliothek hinzu.
In \MQL5\Include\DoEasy\Data.mqh fügen wir die neue Nachrichtenindizes hinzu:
   MSG_CHART_OBJ_CHART_WINDOW,                        // Main chart window
   MSG_CHART_OBJ_CHART_SUBWINDOW,                     // Chart subwindow
   MSG_CHART_OBJ_CHART_SUBWINDOWS_NUM,                // Subwindows
   MSG_CHART_OBJ_INDICATORS_MW_NAME_LIST,             // Indicators in the main chart window
   MSG_CHART_OBJ_INDICATORS_SW_NAME_LIST,             // Indicators in the chart window
   MSG_CHART_OBJ_INDICATOR,                           // Indicator
   MSG_CHART_OBJ_INDICATORS_TOTAL,                    // Indicators
   MSG_CHART_OBJ_WINDOW_N,                            // Window
   MSG_CHART_OBJ_INDICATORS_NONE,                     // No indicators

//--- CChartObjCollection
   MSG_CHART_COLLECTION_TEXT_CHART_COLLECTION,        // Chart collection
   MSG_CHART_COLLECTION_ERR_FAILED_CREATE_CHART_OBJ,  // Failed to create a new chart object
   MSG_CHART_COLLECTION_ERR_FAILED_ADD_CHART,         // Failed to add a chart object to the collection

  };
//+------------------------------------------------------------------+
und die Nachrichtentexte entsprechend den neu hinzugefügten Indizes:
   {"Главное окно графика","Main chart window"},
   {"Подокно графика","Chart subwindow"},
   {"Подокон","Subwindows"},
   {"Индикаторы в главном окне графика","Indicators in the main chart window"},
   {"Индикаторы в окне графика","Indicators in the chart window"},
   {"Индикатор","Indicator"},
   {"Индикаторов","Indicators total"},
   {"Окно","Window"},
   {"Отсутствуют","No indicators"},

//--- CChartObjCollection
   {"Коллекция чартов","Chart collection"},
   {"Не удалось создать новый объект-чарт","Failed to create new chart object"},
   {"Не удалось добавить объект-чарт в коллекцию","Failed to add chart object to collection"},

  };
//+---------------------------------------------------------------------+
Die Kollektion der Chart-Objekte sollte Änderungen in der Anzahl der geöffneten Charts sowie Änderungen in der Anzahl der geöffneten Fenster in jedem Chart verfolgen, um ihre Listen der Charts und der darin geöffneten Fenster umgehend zu aktualisieren. Einige Änderungen können mit OnChartEvent() nachverfolgt werden. Allerdings gibt die Funktion nach den Tests hauptsächlich an, dass der Chart bestimmte Änderungen erfahren hat — Ereignis einer Änderung auf dem Chart (CHARTEVENT_CHART_CHANGE), d.h. hier gibt es keine Einzelheiten. Deshalb werde ich mit dem Timer arbeiten und die Änderungen in der Anzahl der geöffneten Charts und der Fenster damit verfolgen. Andere Änderungen, die im Chart auftreten können, können entweder über das oben beschriebene OnChartEvent() verfolgt werden oder, indem das Chart-Objekt und das Fensterobjekt des Charts vom Bibliotheksobjekt CBaseObjExt abgeleitet werden, das wiederum ein Nachkomme des Basisobjekts aller CBaseObj-Bibliotheksobjekte ist und seinen Nachkommen eine zusätzliche Ereignisfunktionalität bietet. Dies ist notwendig, falls wir später eine solche Funktionalität für die Arbeit mit Charts benötigen.
Charts werden hauptsächlich im halbautomatischen Modus gehandhabt. Um also Änderungen in der Anzahl der geöffneten Charts und Fenster zu definieren, reicht es aus, zweimal pro Sekunde die aktuelle Anzahl der Charts und Fenster zu überprüfen und mit der vorherigen Anzahl zu vergleichen. Wenn es keine Änderungen gab, dann muss nichts getan werden. Wenn es Änderungen in der Anzahl der Fenster und Charts gibt, werden wir die Daten in unserer Kollektion aktualisieren.
Um die Chart-Objekte im Timer arbeiten zu lassen, benötigt die Kollektion der Chart-Objekt weiter Timer-Zähler. Jede Kollektion, die im Timer arbeitet, verfügt über einen eigenen Timer-Zähler, der es ermöglicht, die angegebene Aktualisierungsfrequenz der Kollektion zu verfolgen. Abgesehen von den Zählerparametern müssen wir die neue Kollektions-ID hinzufügen, da jede Objektsammlung ihre eigene ID hat, mit der wir die Zugehörigkeit einer bestimmten Objektliste zu einer Sammlung definieren können.
Im Abschnitt "Makro-Ersetzungen" von \MQL5\Include\DoEasy\Defines.mqh setzen wir die Parameter des Timer-Zählers der Chart-Objekt-Kollektion und die ID der Chart-Objekt-Kollektionsliste:
//+------------------------------------------------------------------+
//| Macro substitutions                                              |
//+------------------------------------------------------------------+
//--- Describe the function with the error line number
#define DFUN_ERR_LINE                  (__FUNCTION__+(TerminalInfoString(TERMINAL_LANGUAGE)=="Russian" ? ", Page " : ", Line ")+(string)__LINE__+": ")
#define DFUN                           (__FUNCTION__+": ")        // "Function description"
#define COUNTRY_LANG                   ("Russian")                // Country language
#define END_TIME                       (D'31.12.3000 23:59:59')   // End date for account history data requests
#define TIMER_FREQUENCY                (16)                       // Minimal frequency of the library timer in milliseconds
#define TOTAL_TRADE_TRY                (5)                        // Default number of trading attempts
#define IND_COLORS_TOTAL               (64)                       // Maximum possible number of indicator buffer colors
#define IND_BUFFERS_MAX                (512)                      // Maximum possible number of indicator buffers
//--- Standard sounds
#define SND_ALERT                      "alert.wav"
#define SND_ALERT2                     "alert2.wav"
#define SND_CONNECT                    "connect.wav"
#define SND_DISCONNECT                 "disconnect.wav"
#define SND_EMAIL                      "email.wav"
#define SND_EXPERT                     "expert.wav"
#define SND_NEWS                       "news.wav"
#define SND_OK                         "ok.wav"
#define SND_REQUEST                    "request.wav"
#define SND_STOPS                      "stops.wav"
#define SND_TICK                       "tick.wav"
#define SND_TIMEOUT                    "timeout.wav"
#define SND_WAIT                       "wait.wav"
//--- Parameters of the orders and deals collection timer
#define COLLECTION_ORD_PAUSE           (250)                      // Orders and deals collection timer pause in milliseconds
#define COLLECTION_ORD_COUNTER_STEP    (16)                       // Increment of the orders and deals collection timer counter
#define COLLECTION_ORD_COUNTER_ID      (1)                        // Orders and deals collection timer counter ID
//--- Parameters of the account collection timer
#define COLLECTION_ACC_PAUSE           (1000)                     // Account collection timer pause in milliseconds
#define COLLECTION_ACC_COUNTER_STEP    (16)                       // Account timer counter increment
#define COLLECTION_ACC_COUNTER_ID      (2)                        // Account timer counter ID
//--- Symbol collection timer 1 parameters
#define COLLECTION_SYM_PAUSE1          (100)                      // Pause of the symbol collection timer 1 in milliseconds (for scanning market watch symbols)
#define COLLECTION_SYM_COUNTER_STEP1   (16)                       // Increment of the symbol timer 1 counter
#define COLLECTION_SYM_COUNTER_ID1     (3)                        // Symbol timer 1 counter ID
//--- Symbol collection timer 2 parameters
#define COLLECTION_SYM_PAUSE2          (300)                      // Pause of the symbol collection timer 2 in milliseconds (for events of the market watch symbol list)
#define COLLECTION_SYM_COUNTER_STEP2   (16)                       // Increment of the symbol timer 2 counter
#define COLLECTION_SYM_COUNTER_ID2     (4)                        // Symbol timer 2 counter ID
//--- Trading class timer parameters
#define COLLECTION_REQ_PAUSE           (300)                      // Trading class timer pause in milliseconds
#define COLLECTION_REQ_COUNTER_STEP    (16)                       // Trading class timer counter increment
#define COLLECTION_REQ_COUNTER_ID      (5)                        // Trading class timer counter ID
//--- Parameters of the timeseries collection timer
#define COLLECTION_TS_PAUSE            (64)                       // Timeseries collection timer pause in milliseconds
#define COLLECTION_TS_COUNTER_STEP     (16)                       // Account timer counter increment
#define COLLECTION_TS_COUNTER_ID       (6)                        // Timeseries timer counter ID
//--- Parameters of the timer of indicator data timeseries collection
#define COLLECTION_IND_TS_PAUSE        (64)                       // Pause of the timer of indicator data timeseries collection in milliseconds
#define COLLECTION_IND_TS_COUNTER_STEP (16)                       // Increment of indicator data timeseries timer counter
#define COLLECTION_IND_TS_COUNTER_ID   (7)                        // ID of indicator data timeseries timer counter
//--- Parameters of the tick series collection timer
#define COLLECTION_TICKS_PAUSE         (64)                       // Tick series collection timer pause in milliseconds
#define COLLECTION_TICKS_COUNTER_STEP  (16)                       // Tick series timer counter increment step
#define COLLECTION_TICKS_COUNTER_ID    (8)                        // Tick series timer counter ID
//--- Parameters of the chart collection timer
#define COLLECTION_CHARTS_PAUSE        (500)                      // Chart collection timer pause in milliseconds
#define COLLECTION_CHARTS_COUNTER_STEP (16)                       // Chart timer counter increment
#define COLLECTION_CHARTS_COUNTER_ID   (9)                        // Chart timer counter ID
//--- Collection list IDs
#define COLLECTION_HISTORY_ID          (0x777A)                   // Historical collection list ID
#define COLLECTION_MARKET_ID           (0x777B)                   // Market collection list ID
#define COLLECTION_EVENTS_ID           (0x777C)                   // Event collection list ID
#define COLLECTION_ACCOUNT_ID          (0x777D)                   // Account collection list ID
#define COLLECTION_SYMBOLS_ID          (0x777E)                   // Symbol collection list ID
#define COLLECTION_SERIES_ID           (0x777F)                   // Timeseries collection list ID
#define COLLECTION_BUFFERS_ID          (0x7780)                   // Indicator buffer collection list ID
#define COLLECTION_INDICATORS_ID       (0x7781)                   // Indicator collection list ID
#define COLLECTION_INDICATORS_DATA_ID  (0x7782)                   // Indicator data collection list ID
#define COLLECTION_TICKSERIES_ID       (0x7783)                   // Tick series collection list ID
#define COLLECTION_MBOOKSERIES_ID      (0x7784)                   // DOM series collection list ID
#define COLLECTION_MQL5_SIGNALS_ID     (0x7785)                   // MQL5 signals collection list ID
#define COLLECTION_CHARTS_ID           (0x7786)                   // Chart collection list ID
//--- Data parameters for file operations
In der Enumeration der ganzzahligen Chart-Eigenschaften entfernen wir die Konstante CHART_PROP_WINDOW_IS_VISIBLE, da ich keine praktische Verwendung dieser Eigenschaft für ein Objekt gefunden habe. Damit wird die Anzahl der Integer-Eigenschaften um 1 reduziert (von 67 auf 66):
#define CHART_PROP_INTEGER_TOTAL (66) // Total number of integer properties
Legen wir noch die Sortierkriterien für Chart-Objekte anhand ihrer Eigenschaften fest, indem wir die Objektsortiereigenschaften hinzufügen:
//+------------------------------------------------------------------+
//| Possible chart sorting criteria                                  |
//+------------------------------------------------------------------+
#define FIRST_CHART_DBL_PROP  (CHART_PROP_INTEGER_TOTAL-CHART_PROP_INTEGER_SKIP)
#define FIRST_CHART_STR_PROP  (CHART_PROP_INTEGER_TOTAL-CHART_PROP_INTEGER_SKIP+CHART_PROP_DOUBLE_TOTAL-CHART_PROP_DOUBLE_SKIP)
enum ENUM_SORT_CHART_MODE
  {
//--- Sort by integer properties
   SORT_BY_CHART_ID = 0,                              // Sort by chart ID
   SORT_BY_CHART_TIMEFRAME,                           // Sort by chart timeframe
   SORT_BY_CHART_SHOW,                                // Sort by the price chart drawing attribute
   SORT_BY_CHART_IS_OBJECT,                           // Sort by chart object (OBJ_CHART) identification attribute
Entfernen wir außerdem die Konstante SORT_BY_CHART_WINDOW_IS_VISIBLE aus der Konstantenliste der Enumeration, da ich diese Eigenschaft im Objekt nicht verwenden werde.
Alle Objekte, deren Kollektionen in der Bibliothek vorhanden sind, verfügen über eigene Listen, die nach verschiedenen Objekteigenschaften sortiert werden können. Die Kollektionsliste des Chart-Objekts wird auch die Sortiermöglichkeit für die Suche und Auswahl von Objekten mit den gewünschten Eigenschaftswerten haben. Für jedes solche Objekt erstellen wir unsere eigenen Sortiermethoden, die in \MQL5\Include\DoEasy\Services\Select.mqh festgelegt sind.
Fügen wir der Klassendatei CSelect neue Methoden hinzu, um die Suche und Sortierung von Chart-Objekten zu organisieren.
Binden wir die Klassendatei der Chart-Objekte in die Klassendatei von CSelect ein:
//+------------------------------------------------------------------+
//| Include files                                                    |
//+------------------------------------------------------------------+
#include <Arrays\ArrayObj.mqh>
#include "..\Objects\Orders\Order.mqh"
#include "..\Objects\Events\Event.mqh"
#include "..\Objects\Accounts\Account.mqh"
#include "..\Objects\Symbols\Symbol.mqh"
#include "..\Objects\PendRequest\PendRequest.mqh"
#include "..\Objects\Series\SeriesDE.mqh"
#include "..\Objects\Indicators\Buffer.mqh"
#include "..\Objects\Indicators\IndicatorDE.mqh"
#include "..\Objects\Indicators\DataInd.mqh"
#include "..\Objects\Ticks\DataTick.mqh"
#include "..\Objects\Book\MarketBookOrd.mqh"
#include "..\Objects\MQLSignalBase\MQLSignal.mqh"
#include "..\Objects\Chart\ChartObj.mqh"
//+------------------------------------------------------------------+
Deklarieren wir die neuen Methoden am Ende des Codes des Klassenhauptteils:
//+------------------------------------------------------------------+
//| Methods of working with chart data                               |
//+------------------------------------------------------------------+
   //--- Return the list of charts with one of (1) integer, (2) real and (3) string properties meeting a specified criterion
   static CArrayObj *ByChartProperty(CArrayObj *list_source,ENUM_CHART_PROP_INTEGER property,long value,ENUM_COMPARER_TYPE mode);
   static CArrayObj *ByChartProperty(CArrayObj *list_source,ENUM_CHART_PROP_DOUBLE property,double value,ENUM_COMPARER_TYPE mode);
   static CArrayObj *ByChartProperty(CArrayObj *list_source,ENUM_CHART_PROP_STRING property,string value,ENUM_COMPARER_TYPE mode);
   //--- Return the chart index with the maximum value of the (1) integer, (2) real and (3) string properties
   static int        FindChartMax(CArrayObj *list_source,ENUM_CHART_PROP_INTEGER property);
   static int        FindChartMax(CArrayObj *list_source,ENUM_CHART_PROP_DOUBLE property);
   static int        FindChartMax(CArrayObj *list_source,ENUM_CHART_PROP_STRING property);
   //--- Return the chart index with the minimum value of the (1) integer, (2) real and (3) string properties
   static int        FindChartMin(CArrayObj *list_source,ENUM_CHART_PROP_INTEGER property);
   static int        FindChartMin(CArrayObj *list_source,ENUM_CHART_PROP_DOUBLE property);
   static int        FindChartMin(CArrayObj *list_source,ENUM_CHART_PROP_STRING property);
//---
  };
//+------------------------------------------------------------------+
Schreiben wir ihre Implementierung außerhalb des Klassenkörpers:
//+------------------------------------------------------------------+
//| Methods of working with chart data                               |
//+------------------------------------------------------------------+
//+------------------------------------------------------------------+
//| Return the list of charts with one integer                       |
//| property meeting the specified criterion                         |
//+------------------------------------------------------------------+
CArrayObj *CSelect::ByChartProperty(CArrayObj *list_source,ENUM_CHART_PROP_INTEGER property,long value,ENUM_COMPARER_TYPE mode)
  {
   if(list_source==NULL) return NULL;
   CArrayObj *list=new CArrayObj();
   if(list==NULL) return NULL;
   list.FreeMode(false);
   ListStorage.Add(list);
   int total=list_source.Total();
   for(int i=0; i<total; i++)
     {
      CChartObj *obj=list_source.At(i);
      if(!obj.SupportProperty(property)) continue;
      long obj_prop=obj.GetProperty(property);
      if(CompareValues(obj_prop,value,mode)) list.Add(obj);
     }
   return list;
  }
//+------------------------------------------------------------------+
//| Return the list of charts with one real                          |
//| property meeting the specified criterion                         |
//+------------------------------------------------------------------+
CArrayObj *CSelect::ByChartProperty(CArrayObj *list_source,ENUM_CHART_PROP_DOUBLE property,double value,ENUM_COMPARER_TYPE mode)
  {
   if(list_source==NULL) return NULL;
   CArrayObj *list=new CArrayObj();
   if(list==NULL) return NULL;
   list.FreeMode(false);
   ListStorage.Add(list);
   for(int i=0; i<list_source.Total(); i++)
     {
      CChartObj *obj=list_source.At(i);
      if(!obj.SupportProperty(property)) continue;
      double obj_prop=obj.GetProperty(property);
      if(CompareValues(obj_prop,value,mode)) list.Add(obj);
     }
   return list;
  }
//+------------------------------------------------------------------+
//| Return the list of charts with one string                        |
//| property meeting the specified criterion                         |
//+------------------------------------------------------------------+
CArrayObj *CSelect::ByChartProperty(CArrayObj *list_source,ENUM_CHART_PROP_STRING property,string value,ENUM_COMPARER_TYPE mode)
  {
   if(list_source==NULL) return NULL;
   CArrayObj *list=new CArrayObj();
   if(list==NULL) return NULL;
   list.FreeMode(false);
   ListStorage.Add(list);
   for(int i=0; i<list_source.Total(); i++)
     {
      CChartObj *obj=list_source.At(i);
      if(!obj.SupportProperty(property)) continue;
      string obj_prop=obj.GetProperty(property);
      if(CompareValues(obj_prop,value,mode)) list.Add(obj);
     }
   return list;
  }
//+------------------------------------------------------------------+
//| Return the chart index in the list                               |
//| with the maximum integer property value                          |
//+------------------------------------------------------------------+
int CSelect::FindChartMax(CArrayObj *list_source,ENUM_CHART_PROP_INTEGER property)
  {
   if(list_source==NULL) return WRONG_VALUE;
   int index=0;
   CChartObj *max_obj=NULL;
   int total=list_source.Total();
   if(total==0) return WRONG_VALUE;
   for(int i=1; i<total; i++)
     {
      CChartObj *obj=list_source.At(i);
      long obj1_prop=obj.GetProperty(property);
      max_obj=list_source.At(index);
      long obj2_prop=max_obj.GetProperty(property);
      if(CompareValues(obj1_prop,obj2_prop,MORE)) index=i;
     }
   return index;
  }
//+------------------------------------------------------------------+
//| Return the chart index in the list                               |
//| with the maximum real property value                             |
//+------------------------------------------------------------------+
int CSelect::FindChartMax(CArrayObj *list_source,ENUM_CHART_PROP_DOUBLE property)
  {
   if(list_source==NULL) return WRONG_VALUE;
   int index=0;
   CChartObj *max_obj=NULL;
   int total=list_source.Total();
   if(total==0) return WRONG_VALUE;
   for(int i=1; i<total; i++)
     {
      CChartObj *obj=list_source.At(i);
      double obj1_prop=obj.GetProperty(property);
      max_obj=list_source.At(index);
      double obj2_prop=max_obj.GetProperty(property);
      if(CompareValues(obj1_prop,obj2_prop,MORE)) index=i;
     }
   return index;
  }
//+------------------------------------------------------------------+
//| Return the chart index in the list                               |
//| with the maximum string property value                           |
//+------------------------------------------------------------------+
int CSelect::FindChartMax(CArrayObj *list_source,ENUM_CHART_PROP_STRING property)
  {
   if(list_source==NULL) return WRONG_VALUE;
   int index=0;
   CChartObj *max_obj=NULL;
   int total=list_source.Total();
   if(total==0) return WRONG_VALUE;
   for(int i=1; i<total; i++)
     {
      CChartObj *obj=list_source.At(i);
      string obj1_prop=obj.GetProperty(property);
      max_obj=list_source.At(index);
      string obj2_prop=max_obj.GetProperty(property);
      if(CompareValues(obj1_prop,obj2_prop,MORE)) index=i;
     }
   return index;
  }
//+------------------------------------------------------------------+
//| Return the chart index in the list                               |
//| with the minimum integer property value                          |
//+------------------------------------------------------------------+
int CSelect::FindChartMin(CArrayObj* list_source,ENUM_CHART_PROP_INTEGER property)
  {
   int index=0;
   CChartObj *min_obj=NULL;
   int total=list_source.Total();
   if(total==0) return WRONG_VALUE;
   for(int i=1; i<total; i++)
     {
      CChartObj *obj=list_source.At(i);
      long obj1_prop=obj.GetProperty(property);
      min_obj=list_source.At(index);
      long obj2_prop=min_obj.GetProperty(property);
      if(CompareValues(obj1_prop,obj2_prop,LESS)) index=i;
     }
   return index;
  }
//+------------------------------------------------------------------+
//| Return the chart index in the list                               |
//| with the minimum real property value                             |
//+------------------------------------------------------------------+
int CSelect::FindChartMin(CArrayObj* list_source,ENUM_CHART_PROP_DOUBLE property)
  {
   int index=0;
   CChartObj *min_obj=NULL;
   int total=list_source.Total();
   if(total== 0) return WRONG_VALUE;
   for(int i=1; i<total; i++)
     {
      CChartObj *obj=list_source.At(i);
      double obj1_prop=obj.GetProperty(property);
      min_obj=list_source.At(index);
      double obj2_prop=min_obj.GetProperty(property);
      if(CompareValues(obj1_prop,obj2_prop,LESS)) index=i;
     }
   return index;
  }
//+------------------------------------------------------------------+
//| Return the chart index in the list                               |
//| with the minimum string property value                           |
//+------------------------------------------------------------------+
int CSelect::FindChartMin(CArrayObj* list_source,ENUM_CHART_PROP_STRING property)
  {
   int index=0;
   CChartObj *min_obj=NULL;
   int total=list_source.Total();
   if(total==0) return WRONG_VALUE;
   for(int i=1; i<total; i++)
     {
      CChartObj *obj=list_source.At(i);
      string obj1_prop=obj.GetProperty(property);
      min_obj=list_source.At(index);
      string obj2_prop=min_obj.GetProperty(property);
      if(CompareValues(obj1_prop,obj2_prop,LESS)) index=i;
     }
   return index;
  }
//+------------------------------------------------------------------+
Ich habe diese Methoden detailliert im Abschnitt "Einrichten der Suche" des Artikels 3 besprochen.
Wenn sich die Anzahl der an den Chart angehängten Fenster ändert, ändern sich die Fensterindizes. Daher benötigen wir manchmal den neuen Fensterindex. Schreiben wir im öffentlichen Abschnitt der Klasse in der Datei \MQL5\Include\DoEasy\Objects\Chart\ChartWnd.mqh des Chart-Fenster-Objekts die neue Methode zum Setzen des Fensterindexes:
//+------------------------------------------------------------------+
//| Chart window indicator object class                              |
//+------------------------------------------------------------------+
class CWndInd : public CObject
  {
private:
   long              m_chart_id;                         // Chart ID
   string            m_name;                             // Indicator short name
   int               m_index;                            // Window index on the chart
   int               m_handle;                           // Indicator handle
public:
//--- Return itself
   CWndInd          *GetObject(void)                     { return &this;         }
//--- Return (1) indicator name, (2) window index and (3) indicator handle
   string            Name(void)                    const { return this.m_name;   }
   int               Index(void)                   const { return this.m_index;  }
   int               Handle(void)                  const { return this.m_handle; }
//--- Set the index of the on-chart window
   void              SetIndex(const int index)           { this.m_index=index;   }

//--- Display the description of object properties in the journal (dash=true - hyphen before the description, false - description only)
   void              Print(const bool dash=false)        { ::Print((dash ? "- " : "")+this.Header());                      }
//--- Return the object short name
   string            Header(void)                  const { return CMessage::Text(MSG_CHART_OBJ_INDICATOR)+" "+this.Name(); }

//--- Compare CWndInd objects with each other by the specified property
   virtual int       Compare(const CObject *node,const int mode=0) const;

//--- Constructors
                     CWndInd(void);
                     CWndInd(const int handle,const string name,const int index) : m_handle(handle),m_name(name),m_index(index) {}
  };
//+------------------------------------------------------------------+
Lassen Sie uns die Chart-Objekt-Klasse in \MQL5\Include\DoEasy\Objects\Chart\ChartObj.mqh leicht verbessern.
Wir entfernen die Deklaration der Methode SetVisible() aus der Liste der privaten Methoden zum Setzen der Objekteigenschaften, um die von der Methode gesetzte Eigenschaft loswerden zu können, da sie hier nicht hilfreich ist:
//--- The methods of setting property values
   bool              SetMode(const string source,const ENUM_CHART_MODE mode,const bool redraw=false);
   bool              SetScale(const string source,const int scale,const bool redraw=false);
   bool              SetModeVolume(const string source,const ENUM_CHART_VOLUME_MODE mode,const bool redraw=false);
   void              SetVisibleBars(void);
   void              SetWindowsTotal(void);
   void              SetVisible(void);
   void              SetFirstVisibleBars(void);
   void              SetWidthInBars(void);
   void              SetWidthInPixels(void);
   void              SetMaximizedFlag(void);
   void              SetMinimizedFlag(void);
   void              SetExpertName(void);
   void              SetScriptName(void);
Jenseits des Klassenhauptteils gibt es die Implementierung, die ebenfalls entfernt wird:
//+-------------------------------------------------------------------+
//|  Set the property                                                 |
//| "The total number of chart windows including indicator subwindows"|
//+-------------------------------------------------------------------+
void CChartObj::SetWindowsTotal(void)
  {
   this.SetProperty(CHART_PROP_WINDOWS_TOTAL,::ChartGetInteger(this.ID(),CHART_WINDOWS_TOTAL));
  }
//+------------------------------------------------------------------+
//| Set the "Subwindow visibility" property                          |
//+------------------------------------------------------------------+
void CChartObj::SetVisible(void)
  {
   this.SetProperty(CHART_PROP_WINDOW_IS_VISIBLE,::ChartGetInteger(this.ID(),CHART_WINDOW_IS_VISIBLE,0));
  }
//+---------------------------------------------------------------------+
//| Set the property "The number of the first visible bar on the chart" |
//+---------------------------------------------------------------------+
void CChartObj::SetFirstVisibleBars(void)
  {
   this.SetProperty(CHART_PROP_FIRST_VISIBLE_BAR,::ChartGetInteger(this.ID(),CHART_FIRST_VISIBLE_BAR));
  }
//+------------------------------------------------------------------+
Die Methode hat einfach die Sichtbarkeitseigenschaft des Hauptfensters des Charts auf die bereits entfernte Integer-Eigenschaft gelegt. Da wir sie nicht verwenden werden, sollten wir alle zugehörigen Methoden loswerden. In jedem Fall kann der Wert der Fenstereigenschaft weiterhin direkt aus der Umgebung und nicht aus den Eigenschaften des Chart-Fenster-Objekts bezogen werden.
Wir deklarieren im privaten Abschnitt der Klasse die Methode zum Erstellen der Liste der an das Chart angehängten Fenster:
//--- The methods of setting property values
   bool              SetMode(const string source,const ENUM_CHART_MODE mode,const bool redraw=false);
   bool              SetScale(const string source,const int scale,const bool redraw=false);
   bool              SetModeVolume(const string source,const ENUM_CHART_VOLUME_MODE mode,const bool redraw=false);
   void              SetVisibleBars(void);
   void              SetWindowsTotal(void);
   void              SetFirstVisibleBars(void);
   void              SetWidthInBars(void);
   void              SetWidthInPixels(void);
   void              SetMaximizedFlag(void);
   void              SetMinimizedFlag(void);
   void              SetExpertName(void);
   void              SetScriptName(void);

//--- Create the list of chart windows
   void              CreateWindowsList(void);

public:
Deklarieren wir im öffentlichen Abschnitt der Klasse die Methode zum Aktualisieren der Eigenschaften des Chart-Objekts und seiner Unterfenster:
//--- Update the chart object and its list of indicator windows
   void              Refresh(void);

//--- Constructors
                     CChartObj(){;}
                     CChartObj(const long chart_id);
Beim Arrangieren der Arbeit mit der Methode, die die Gesamtzahl der Chart-Fenster zurückgibt, stieß ich auf die Tatsache, dass ich die Daten in den Objekteigenschaften sofort nach der Abfrage einstellen muss. Daher entschied ich mich, die Datenanforderung und ihre Aufnahme in die Objekteigenschaft zu kombinieren.
In der Methode WindowsTotal() fügen wir zunächst die Anforderung und das Setzen der Anzahl der Chart-Fenster in der Methode SetWindowsTotal() hinzu. Als Nächstes implementieren wir die Rückgabe des neu gewonnenen Wertes, der in den Objekteigenschaften gespeichert wird. Entfernen wir die Implementierung der Methode Visible():
//--- Return the number of bars on a chart that are available for display
   int               VisibleBars(void)                               const { return (int)this.GetProperty(CHART_PROP_VISIBLE_BARS);       }

//--- Return the total number of chart windows including indicator subwindows
   int               WindowsTotal(void)
                       {
                        this.SetWindowsTotal();
                        return (int)this.GetProperty(CHART_PROP_WINDOWS_TOTAL);
                       }

//--- Return the window visibility
   bool              Visible(void)                                   const { return (bool)this.GetProperty(CHART_PROP_WINDOW_IS_VISIBLE); }
Fügen wir noch eine weitere Methode hinzu, die das Flag zurückgibt, das anzeigt, dass das Chart-Objekt das Hauptobjekt ist — das Chart, an das das bibliotheksbasierte Programm angehängt ist:
//--- Emulate a tick (chart updates - similar to the terminal Refresh command)
   void              EmulateTick(void)                                     { ::ChartSetSymbolPeriod(this.ID(),this.Symbol(),this.Timeframe());}

//--- Return the flag indicating that the chart object belongs to the program chart
   bool              IsMainChart(void)                               const { return(this.m_chart_id==CBaseObj::GetMainChartID());            }
//--- Return the chart window specified by index
   CChartWnd        *GetWindowByIndex(const int index)               const { return this.m_list_wnd.At(index);                               }
Das Basisobjekt CBaseObj aller Bibliotheksobjekte enthält die Variable m_chart_id_main, in der die ID des Charts gespeichert wird, mit dem das Programm gestartet wird. Im Konstruktor erhält die Variable den von der Funktion ChartID() zurückgegebenen Wert. Die aktuelle ID des Charts wird mit der Methode GetMainChartID() der Klasse CBaseObj zurückgegeben, die den in der Variablen m_chart_id_main gesetzten Wert zurückgibt. Wir geben also das Flag zurück, das angibt, dass die aktuelle ID des Charts mit der ID des Programmhauptfensters übereinstimmt. Wenn es eine Übereinstimmung gibt, gibt die Methode true zurück, sonst false.
Aus dem parametrischen Konstruktor entfernen wir die Zeile, durch die der aktuelle Sichtbarkeitswert des Chart-Fensters festgelegt ist:
//+------------------------------------------------------------------+
//| Parametric constructor                                           |
//+------------------------------------------------------------------+
CChartObj::CChartObj(const long chart_id)
  {
//--- Set chart ID to the base object
   CBaseObj::SetChartID(chart_id);
//--- Set integer properties
   this.SetProperty(CHART_PROP_ID,chart_id);                                                             // Chart ID
   this.SetProperty(CHART_PROP_TIMEFRAME,::ChartPeriod(this.ID()));                                      // Chart timeframe
   this.SetProperty(CHART_PROP_SHOW,::ChartGetInteger(this.ID(),CHART_SHOW));                            // Price chart drawing attribute
   this.SetProperty(CHART_PROP_IS_OBJECT,::ChartGetInteger(this.ID(),CHART_IS_OBJECT));                  // Chart object identification attribute
   this.SetProperty(CHART_PROP_BRING_TO_TOP,false);                                                      // Show chart above all others
   this.SetProperty(CHART_PROP_CONTEXT_MENU,::ChartGetInteger(this.ID(),CHART_CONTEXT_MENU));            // Access to the context menu using the right click
   this.SetProperty(CHART_PROP_CROSSHAIR_TOOL,::ChartGetInteger(this.ID(),CHART_CROSSHAIR_TOOL));        // Access the Crosshair tool by pressing the middle mouse button
   this.SetProperty(CHART_PROP_MOUSE_SCROLL,::ChartGetInteger(this.ID(),CHART_MOUSE_SCROLL));            // Scroll the chart horizontally using the left mouse button
   this.SetProperty(CHART_PROP_EVENT_MOUSE_WHEEL,::ChartGetInteger(this.ID(),CHART_EVENT_MOUSE_WHEEL));  // Send messages about mouse wheel events to all MQL5 programs on a chart
   this.SetProperty(CHART_PROP_EVENT_MOUSE_MOVE,::ChartGetInteger(this.ID(),CHART_EVENT_MOUSE_MOVE));    // Send messages about mouse button click and movement events to all MQL5 programs on a chart
   this.SetProperty(CHART_PROP_EVENT_OBJECT_CREATE,::ChartGetInteger(this.ID(),CHART_EVENT_OBJECT_CREATE)); // Send messages about the graphical object creation event to all MQL5 programs on a chart
   this.SetProperty(CHART_PROP_EVENT_OBJECT_DELETE,::ChartGetInteger(this.ID(),CHART_EVENT_OBJECT_DELETE)); // Send messages about the graphical object destruction event to all MQL5 programs on a chart
   this.SetProperty(CHART_PROP_MODE,::ChartGetInteger(this.ID(),CHART_MODE));                            // Type of the chart (candlesticks, bars or line)
   this.SetProperty(CHART_PROP_FOREGROUND,::ChartGetInteger(this.ID(),CHART_FOREGROUND));                // Price chart in the foreground
   this.SetProperty(CHART_PROP_SHIFT,::ChartGetInteger(this.ID(),CHART_SHIFT));                          // Mode of shift of the price chart from the right border
   this.SetProperty(CHART_PROP_AUTOSCROLL,::ChartGetInteger(this.ID(),CHART_AUTOSCROLL));                // The mode of automatic shift to the right border of the chart
   this.SetProperty(CHART_PROP_KEYBOARD_CONTROL,::ChartGetInteger(this.ID(),CHART_KEYBOARD_CONTROL));    // Allow managing the chart using a keyboard
   this.SetProperty(CHART_PROP_QUICK_NAVIGATION,::ChartGetInteger(this.ID(),CHART_QUICK_NAVIGATION));    // Allow the chart to intercept Space and Enter key strokes to activate the quick navigation bar
   this.SetProperty(CHART_PROP_SCALE,::ChartGetInteger(this.ID(),CHART_SCALE));                          // Scale
   this.SetProperty(CHART_PROP_SCALEFIX,::ChartGetInteger(this.ID(),CHART_SCALEFIX));                    // Fixed scale mode
   this.SetProperty(CHART_PROP_SCALEFIX_11,::ChartGetInteger(this.ID(),CHART_SCALEFIX_11));              // 1:1 scale mode
   this.SetProperty(CHART_PROP_SCALE_PT_PER_BAR,::ChartGetInteger(this.ID(),CHART_SCALE_PT_PER_BAR));    // Mode for specifying the scale in points per bar
   this.SetProperty(CHART_PROP_SHOW_TICKER,::ChartGetInteger(this.ID(),CHART_SHOW_TICKER));              // Display a symbol ticker in the upper left corner
   this.SetProperty(CHART_PROP_SHOW_OHLC,::ChartGetInteger(this.ID(),CHART_SHOW_OHLC));                  // Display OHLC values in the upper left corner
   this.SetProperty(CHART_PROP_SHOW_BID_LINE,::ChartGetInteger(this.ID(),CHART_SHOW_BID_LINE));          // Display Bid value as a horizontal line on the chart
   this.SetProperty(CHART_PROP_SHOW_ASK_LINE,::ChartGetInteger(this.ID(),CHART_SHOW_ASK_LINE));          // Display Ask value as a horizontal line on the chart
   this.SetProperty(CHART_PROP_SHOW_LAST_LINE,::ChartGetInteger(this.ID(),CHART_SHOW_LAST_LINE));        // Display Last value as a horizontal line on the chart
   this.SetProperty(CHART_PROP_SHOW_PERIOD_SEP,::ChartGetInteger(this.ID(),CHART_SHOW_PERIOD_SEP));      // Display vertical separators between adjacent periods
   this.SetProperty(CHART_PROP_SHOW_GRID,::ChartGetInteger(this.ID(),CHART_SHOW_GRID));                  // Display the chart grid
   this.SetProperty(CHART_PROP_SHOW_VOLUMES,::ChartGetInteger(this.ID(),CHART_SHOW_VOLUMES));            // Display volumes on the chart
   this.SetProperty(CHART_PROP_SHOW_OBJECT_DESCR,::ChartGetInteger(this.ID(),CHART_SHOW_OBJECT_DESCR));  // Display text descriptions of the objects
   this.SetProperty(CHART_PROP_VISIBLE_BARS,::ChartGetInteger(this.ID(),CHART_VISIBLE_BARS));            // Number of bars on a chart that are available for display
   this.SetProperty(CHART_PROP_WINDOWS_TOTAL,::ChartGetInteger(this.ID(),CHART_WINDOWS_TOTAL));          // The total number of chart windows including indicator subwindows
   this.SetProperty(CHART_PROP_WINDOW_IS_VISIBLE,::ChartGetInteger(this.ID(),CHART_WINDOW_IS_VISIBLE,0));// Window visibility
   this.SetProperty(CHART_PROP_WINDOW_HANDLE,::ChartGetInteger(this.ID(),CHART_WINDOW_HANDLE));          // Chart window handle
   this.SetProperty(CHART_PROP_WINDOW_YDISTANCE,::ChartGetInteger(this.ID(),CHART_WINDOW_YDISTANCE,0));  // Distance in Y axis pixels between the upper frame of the indicator subwindow and the upper frame of the chart main window
   this.SetProperty(CHART_PROP_FIRST_VISIBLE_BAR,::ChartGetInteger(this.ID(),CHART_FIRST_VISIBLE_BAR));  // Number of the first visible bar on the chart
   this.SetProperty(CHART_PROP_WIDTH_IN_BARS,::ChartGetInteger(this.ID(),CHART_WIDTH_IN_BARS));          // Chart width in bars
   this.SetProperty(CHART_PROP_WIDTH_IN_PIXELS,::ChartGetInteger(this.ID(),CHART_WIDTH_IN_PIXELS));      // Chart width in pixels
   this.SetProperty(CHART_PROP_HEIGHT_IN_PIXELS,::ChartGetInteger(this.ID(),CHART_HEIGHT_IN_PIXELS,0));  // Chart height in pixels
   this.SetProperty(CHART_PROP_COLOR_BACKGROUND,::ChartGetInteger(this.ID(),CHART_COLOR_BACKGROUND));    // Chart background color
   this.SetProperty(CHART_PROP_COLOR_FOREGROUND,::ChartGetInteger(this.ID(),CHART_COLOR_FOREGROUND));    // Color of axes, scale and OHLC line
   this.SetProperty(CHART_PROP_COLOR_GRID,::ChartGetInteger(this.ID(),CHART_COLOR_GRID));                // Grid color
   this.SetProperty(CHART_PROP_COLOR_VOLUME,::ChartGetInteger(this.ID(),CHART_COLOR_VOLUME));            // Color of volumes and position opening levels
   this.SetProperty(CHART_PROP_COLOR_CHART_UP,::ChartGetInteger(this.ID(),CHART_COLOR_CHART_UP));        // Color for the up bar, shadows and body borders of bullish candlesticks
   this.SetProperty(CHART_PROP_COLOR_CHART_DOWN,::ChartGetInteger(this.ID(),CHART_COLOR_CHART_DOWN));    // Color for the down bar, shadows and body borders of bearish candlesticks
   this.SetProperty(CHART_PROP_COLOR_CHART_LINE,::ChartGetInteger(this.ID(),CHART_COLOR_CHART_LINE));    // Color of the chart line and the Doji candlesticks
   this.SetProperty(CHART_PROP_COLOR_CANDLE_BULL,::ChartGetInteger(this.ID(),CHART_COLOR_CANDLE_BULL));  // Color of the bullish candle body
   this.SetProperty(CHART_PROP_COLOR_CANDLE_BEAR,::ChartGetInteger(this.ID(),CHART_COLOR_CANDLE_BEAR));  // Color of the bearish candle body
   this.SetProperty(CHART_PROP_COLOR_BID,::ChartGetInteger(this.ID(),CHART_COLOR_BID));                  // Bid price line color
   this.SetProperty(CHART_PROP_COLOR_ASK,::ChartGetInteger(this.ID(),CHART_COLOR_ASK));                  // Ask price line color
   this.SetProperty(CHART_PROP_COLOR_LAST,::ChartGetInteger(this.ID(),CHART_COLOR_LAST));                // Color of the last performed deal's price line (Last)
   this.SetProperty(CHART_PROP_COLOR_STOP_LEVEL,::ChartGetInteger(this.ID(),CHART_COLOR_STOP_LEVEL));    // Color of stop order levels (Stop Loss and Take Profit)
   this.SetProperty(CHART_PROP_SHOW_TRADE_LEVELS,::ChartGetInteger(this.ID(),CHART_SHOW_TRADE_LEVELS));  // Display trade levels on the chart (levels of open positions, Stop Loss, Take Profit and pending orders)
   this.SetProperty(CHART_PROP_DRAG_TRADE_LEVELS,::ChartGetInteger(this.ID(),CHART_DRAG_TRADE_LEVELS));  // Enable the ability to drag trading levels on a chart using mouse
   this.SetProperty(CHART_PROP_SHOW_DATE_SCALE,::ChartGetInteger(this.ID(),CHART_SHOW_DATE_SCALE));      // Display the time scale on the chart
   this.SetProperty(CHART_PROP_SHOW_PRICE_SCALE,::ChartGetInteger(this.ID(),CHART_SHOW_PRICE_SCALE));    // Display the price scale on the chart
   this.SetProperty(CHART_PROP_SHOW_ONE_CLICK,::ChartGetInteger(this.ID(),CHART_SHOW_ONE_CLICK));        // Display the quick trading panel on the chart
   this.SetProperty(CHART_PROP_IS_MAXIMIZED,::ChartGetInteger(this.ID(),CHART_IS_MAXIMIZED));            // Chart window maximized
   this.SetProperty(CHART_PROP_IS_MINIMIZED,::ChartGetInteger(this.ID(),CHART_IS_MINIMIZED));            // Chart window minimized
   this.SetProperty(CHART_PROP_IS_DOCKED,::ChartGetInteger(this.ID(),CHART_IS_DOCKED));                  // Chart window docked
   this.SetProperty(CHART_PROP_FLOAT_LEFT,::ChartGetInteger(this.ID(),CHART_FLOAT_LEFT));                // Left coordinate of the undocked chart window relative to the virtual screen
   this.SetProperty(CHART_PROP_FLOAT_TOP,::ChartGetInteger(this.ID(),CHART_FLOAT_TOP));                  // Upper coordinate of the undocked chart window relative to the virtual screen
   this.SetProperty(CHART_PROP_FLOAT_RIGHT,::ChartGetInteger(this.ID(),CHART_FLOAT_RIGHT));              // Right coordinate of the undocked chart window relative to the virtual screen
   this.SetProperty(CHART_PROP_FLOAT_BOTTOM,::ChartGetInteger(this.ID(),CHART_FLOAT_BOTTOM));            // Bottom coordinate of the undocked chart window relative to the virtual screen
//--- Set real properties
   this.SetProperty(CHART_PROP_SHIFT_SIZE,::ChartGetDouble(this.ID(),CHART_SHIFT_SIZE));                 // Shift size of the zero bar from the right border in %
   this.SetProperty(CHART_PROP_FIXED_POSITION,::ChartGetDouble(this.ID(),CHART_FIXED_POSITION));         // Chart fixed position from the left border in %
   this.SetProperty(CHART_PROP_FIXED_MAX,::ChartGetDouble(this.ID(),CHART_FIXED_MAX));                   // Fixed chart maximum
   this.SetProperty(CHART_PROP_FIXED_MIN,::ChartGetDouble(this.ID(),CHART_FIXED_MIN));                   // Fixed chart minimum
   this.SetProperty(CHART_PROP_POINTS_PER_BAR,::ChartGetDouble(this.ID(),CHART_POINTS_PER_BAR));         // Scale in points per bar
   this.SetProperty(CHART_PROP_PRICE_MIN,::ChartGetDouble(this.ID(),CHART_PRICE_MIN));                   // Chart minimum
   this.SetProperty(CHART_PROP_PRICE_MAX,::ChartGetDouble(this.ID(),CHART_PRICE_MAX));                   // Chart maximum
//--- Set string properties
   this.SetProperty(CHART_PROP_COMMENT,::ChartGetString(this.ID(),CHART_COMMENT));                       // Comment text on the chart
   this.SetProperty(CHART_PROP_EXPERT_NAME,::ChartGetString(this.ID(),CHART_EXPERT_NAME));               // name of an EA launched on the chart
   this.SetProperty(CHART_PROP_SCRIPT_NAME,::ChartGetString(this.ID(),CHART_SCRIPT_NAME));               // name of a script launched on the chart
   this.SetProperty(CHART_PROP_SYMBOL,::ChartSymbol(this.ID()));                                         // Chart symbol

   this.m_digits=(int)::SymbolInfoInteger(this.Symbol(),SYMBOL_DIGITS);
Anstelle der Schleife mit den zum Chart gehörenden Fenster-Objekten,
   this.m_digits=(int)::SymbolInfoInteger(this.Symbol(),SYMBOL_DIGITS);
   int total=this.WindowsTotal();
   for(int i=0;i<total;i++)
     {
      CChartWnd *wnd=new CChartWnd(m_chart_id,i);
      if(wnd==NULL)
         continue;
      m_list_wnd.Sort();
      if(!m_list_wnd.Add(wnd))
         delete wnd;
     }
fügen wir den Aufruf der Methode hinzu, in der die Liste der zum Chart gehörenden Fenster erstellt wird:
   this.m_digits=(int)::SymbolInfoInteger(this.Symbol(),SYMBOL_DIGITS);
   this.CreateWindowsList();
Als Ergebnis sieht der parametrische Konstruktor jetzt wie folgt aus:
//+------------------------------------------------------------------+
//| Parametric constructor                                           |
//+------------------------------------------------------------------+
CChartObj::CChartObj(const long chart_id)
  {
//--- Set chart ID to the base object
   CBaseObj::SetChartID(chart_id);
//--- Set integer properties
   this.SetProperty(CHART_PROP_ID,chart_id);                                                             // Chart ID
   this.SetProperty(CHART_PROP_TIMEFRAME,::ChartPeriod(this.ID()));                                      // Chart timeframe
   this.SetProperty(CHART_PROP_SHOW,::ChartGetInteger(this.ID(),CHART_SHOW));                            // Price chart drawing attribute
   this.SetProperty(CHART_PROP_IS_OBJECT,::ChartGetInteger(this.ID(),CHART_IS_OBJECT));                  // Chart object identification attribute
   this.SetProperty(CHART_PROP_BRING_TO_TOP,false);                                                      // Show chart above all others
   this.SetProperty(CHART_PROP_CONTEXT_MENU,::ChartGetInteger(this.ID(),CHART_CONTEXT_MENU));            // Access to the context menu using the right click
   this.SetProperty(CHART_PROP_CROSSHAIR_TOOL,::ChartGetInteger(this.ID(),CHART_CROSSHAIR_TOOL));        // Access the Crosshair tool by pressing the middle mouse button
   this.SetProperty(CHART_PROP_MOUSE_SCROLL,::ChartGetInteger(this.ID(),CHART_MOUSE_SCROLL));            // Scroll the chart horizontally using the left mouse button
   this.SetProperty(CHART_PROP_EVENT_MOUSE_WHEEL,::ChartGetInteger(this.ID(),CHART_EVENT_MOUSE_WHEEL));  // Send messages about mouse wheel events to all MQL5 programs on a chart
   this.SetProperty(CHART_PROP_EVENT_MOUSE_MOVE,::ChartGetInteger(this.ID(),CHART_EVENT_MOUSE_MOVE));    // Send messages about mouse button click and movement events to all MQL5 programs on a chart
   this.SetProperty(CHART_PROP_EVENT_OBJECT_CREATE,::ChartGetInteger(this.ID(),CHART_EVENT_OBJECT_CREATE)); // Send messages about the graphical object creation event to all MQL5 programs on a chart
   this.SetProperty(CHART_PROP_EVENT_OBJECT_DELETE,::ChartGetInteger(this.ID(),CHART_EVENT_OBJECT_DELETE)); // Send messages about the graphical object destruction event to all MQL5 programs on a chart
   this.SetProperty(CHART_PROP_MODE,::ChartGetInteger(this.ID(),CHART_MODE));                            // Type of the chart (candlesticks, bars or line)
   this.SetProperty(CHART_PROP_FOREGROUND,::ChartGetInteger(this.ID(),CHART_FOREGROUND));                // Price chart in the foreground
   this.SetProperty(CHART_PROP_SHIFT,::ChartGetInteger(this.ID(),CHART_SHIFT));                          // Mode of shift of the price chart from the right border
   this.SetProperty(CHART_PROP_AUTOSCROLL,::ChartGetInteger(this.ID(),CHART_AUTOSCROLL));                // The mode of automatic shift to the right border of the chart
   this.SetProperty(CHART_PROP_KEYBOARD_CONTROL,::ChartGetInteger(this.ID(),CHART_KEYBOARD_CONTROL));    // Allow managing the chart using a keyboard
   this.SetProperty(CHART_PROP_QUICK_NAVIGATION,::ChartGetInteger(this.ID(),CHART_QUICK_NAVIGATION));    // Allow the chart to intercept Space and Enter key strokes to activate the quick navigation bar
   this.SetProperty(CHART_PROP_SCALE,::ChartGetInteger(this.ID(),CHART_SCALE));                          // Scale
   this.SetProperty(CHART_PROP_SCALEFIX,::ChartGetInteger(this.ID(),CHART_SCALEFIX));                    // Fixed scale mode
   this.SetProperty(CHART_PROP_SCALEFIX_11,::ChartGetInteger(this.ID(),CHART_SCALEFIX_11));              // 1:1 scale mode
   this.SetProperty(CHART_PROP_SCALE_PT_PER_BAR,::ChartGetInteger(this.ID(),CHART_SCALE_PT_PER_BAR));    // Mode for specifying the scale in points per bar
   this.SetProperty(CHART_PROP_SHOW_TICKER,::ChartGetInteger(this.ID(),CHART_SHOW_TICKER));              // Display a symbol ticker in the upper left corner
   this.SetProperty(CHART_PROP_SHOW_OHLC,::ChartGetInteger(this.ID(),CHART_SHOW_OHLC));                  // Display OHLC values in the upper left corner
   this.SetProperty(CHART_PROP_SHOW_BID_LINE,::ChartGetInteger(this.ID(),CHART_SHOW_BID_LINE));          // Display Bid value as a horizontal line on the chart
   this.SetProperty(CHART_PROP_SHOW_ASK_LINE,::ChartGetInteger(this.ID(),CHART_SHOW_ASK_LINE));          // Display Ask value as a horizontal line on the chart
   this.SetProperty(CHART_PROP_SHOW_LAST_LINE,::ChartGetInteger(this.ID(),CHART_SHOW_LAST_LINE));        // Display Last value as a horizontal line on the chart
   this.SetProperty(CHART_PROP_SHOW_PERIOD_SEP,::ChartGetInteger(this.ID(),CHART_SHOW_PERIOD_SEP));      // Display vertical separators between adjacent periods
   this.SetProperty(CHART_PROP_SHOW_GRID,::ChartGetInteger(this.ID(),CHART_SHOW_GRID));                  // Display the chart grid
   this.SetProperty(CHART_PROP_SHOW_VOLUMES,::ChartGetInteger(this.ID(),CHART_SHOW_VOLUMES));            // Display volumes on the chart
   this.SetProperty(CHART_PROP_SHOW_OBJECT_DESCR,::ChartGetInteger(this.ID(),CHART_SHOW_OBJECT_DESCR));  // Display text descriptions of the objects
   this.SetProperty(CHART_PROP_VISIBLE_BARS,::ChartGetInteger(this.ID(),CHART_VISIBLE_BARS));            // Number of bars on a chart that are available for display
   this.SetProperty(CHART_PROP_WINDOWS_TOTAL,::ChartGetInteger(this.ID(),CHART_WINDOWS_TOTAL));          // The total number of chart windows including indicator subwindows
   this.SetProperty(CHART_PROP_WINDOW_HANDLE,::ChartGetInteger(this.ID(),CHART_WINDOW_HANDLE));          // Chart window handle
   this.SetProperty(CHART_PROP_WINDOW_YDISTANCE,::ChartGetInteger(this.ID(),CHART_WINDOW_YDISTANCE,0));  // Distance in Y axis pixels between the upper frame of the indicator subwindow and the upper frame of the chart main window
   this.SetProperty(CHART_PROP_FIRST_VISIBLE_BAR,::ChartGetInteger(this.ID(),CHART_FIRST_VISIBLE_BAR));  // Number of the first visible bar on the chart
   this.SetProperty(CHART_PROP_WIDTH_IN_BARS,::ChartGetInteger(this.ID(),CHART_WIDTH_IN_BARS));          // Chart width in bars
   this.SetProperty(CHART_PROP_WIDTH_IN_PIXELS,::ChartGetInteger(this.ID(),CHART_WIDTH_IN_PIXELS));      // Chart width in pixels
   this.SetProperty(CHART_PROP_HEIGHT_IN_PIXELS,::ChartGetInteger(this.ID(),CHART_HEIGHT_IN_PIXELS,0));  // Chart height in pixels
   this.SetProperty(CHART_PROP_COLOR_BACKGROUND,::ChartGetInteger(this.ID(),CHART_COLOR_BACKGROUND));    // Chart background color
   this.SetProperty(CHART_PROP_COLOR_FOREGROUND,::ChartGetInteger(this.ID(),CHART_COLOR_FOREGROUND));    // Color of axes, scale and OHLC line
   this.SetProperty(CHART_PROP_COLOR_GRID,::ChartGetInteger(this.ID(),CHART_COLOR_GRID));                // Grid color
   this.SetProperty(CHART_PROP_COLOR_VOLUME,::ChartGetInteger(this.ID(),CHART_COLOR_VOLUME));            // Color of volumes and position opening levels
   this.SetProperty(CHART_PROP_COLOR_CHART_UP,::ChartGetInteger(this.ID(),CHART_COLOR_CHART_UP));        // Color for the up bar, shadows and body borders of bullish candlesticks
   this.SetProperty(CHART_PROP_COLOR_CHART_DOWN,::ChartGetInteger(this.ID(),CHART_COLOR_CHART_DOWN));    // Color for the down bar, shadows and body borders of bearish candlesticks
   this.SetProperty(CHART_PROP_COLOR_CHART_LINE,::ChartGetInteger(this.ID(),CHART_COLOR_CHART_LINE));    // Color of the chart line and the Doji candlesticks
   this.SetProperty(CHART_PROP_COLOR_CANDLE_BULL,::ChartGetInteger(this.ID(),CHART_COLOR_CANDLE_BULL));  // Color of the bullish candle body
   this.SetProperty(CHART_PROP_COLOR_CANDLE_BEAR,::ChartGetInteger(this.ID(),CHART_COLOR_CANDLE_BEAR));  // Color of the bearish candle body
   this.SetProperty(CHART_PROP_COLOR_BID,::ChartGetInteger(this.ID(),CHART_COLOR_BID));                  // Bid price line color
   this.SetProperty(CHART_PROP_COLOR_ASK,::ChartGetInteger(this.ID(),CHART_COLOR_ASK));                  // Ask price line color
   this.SetProperty(CHART_PROP_COLOR_LAST,::ChartGetInteger(this.ID(),CHART_COLOR_LAST));                // Color of the last performed deal's price line (Last)
   this.SetProperty(CHART_PROP_COLOR_STOP_LEVEL,::ChartGetInteger(this.ID(),CHART_COLOR_STOP_LEVEL));    // Color of stop order levels (Stop Loss and Take Profit)
   this.SetProperty(CHART_PROP_SHOW_TRADE_LEVELS,::ChartGetInteger(this.ID(),CHART_SHOW_TRADE_LEVELS));  // Display trade levels on the chart (levels of open positions, Stop Loss, Take Profit and pending orders)
   this.SetProperty(CHART_PROP_DRAG_TRADE_LEVELS,::ChartGetInteger(this.ID(),CHART_DRAG_TRADE_LEVELS));  // Enable the ability to drag trading levels on a chart using mouse
   this.SetProperty(CHART_PROP_SHOW_DATE_SCALE,::ChartGetInteger(this.ID(),CHART_SHOW_DATE_SCALE));      // Display the time scale on the chart
   this.SetProperty(CHART_PROP_SHOW_PRICE_SCALE,::ChartGetInteger(this.ID(),CHART_SHOW_PRICE_SCALE));    // Display the price scale on the chart
   this.SetProperty(CHART_PROP_SHOW_ONE_CLICK,::ChartGetInteger(this.ID(),CHART_SHOW_ONE_CLICK));        // Display the quick trading panel on the chart
   this.SetProperty(CHART_PROP_IS_MAXIMIZED,::ChartGetInteger(this.ID(),CHART_IS_MAXIMIZED));            // Chart window maximized
   this.SetProperty(CHART_PROP_IS_MINIMIZED,::ChartGetInteger(this.ID(),CHART_IS_MINIMIZED));            // Chart window minimized
   this.SetProperty(CHART_PROP_IS_DOCKED,::ChartGetInteger(this.ID(),CHART_IS_DOCKED));                  // Chart window docked
   this.SetProperty(CHART_PROP_FLOAT_LEFT,::ChartGetInteger(this.ID(),CHART_FLOAT_LEFT));                // Left coordinate of the undocked chart window relative to the virtual screen
   this.SetProperty(CHART_PROP_FLOAT_TOP,::ChartGetInteger(this.ID(),CHART_FLOAT_TOP));                  // Upper coordinate of the undocked chart window relative to the virtual screen
   this.SetProperty(CHART_PROP_FLOAT_RIGHT,::ChartGetInteger(this.ID(),CHART_FLOAT_RIGHT));              // Right coordinate of the undocked chart window relative to the virtual screen
   this.SetProperty(CHART_PROP_FLOAT_BOTTOM,::ChartGetInteger(this.ID(),CHART_FLOAT_BOTTOM));            // Bottom coordinate of the undocked chart window relative to the virtual screen
//--- Set real properties
   this.SetProperty(CHART_PROP_SHIFT_SIZE,::ChartGetDouble(this.ID(),CHART_SHIFT_SIZE));                 // Shift size of the zero bar from the right border in %
   this.SetProperty(CHART_PROP_FIXED_POSITION,::ChartGetDouble(this.ID(),CHART_FIXED_POSITION));         // Chart fixed position from the left border in %
   this.SetProperty(CHART_PROP_FIXED_MAX,::ChartGetDouble(this.ID(),CHART_FIXED_MAX));                   // Fixed chart maximum
   this.SetProperty(CHART_PROP_FIXED_MIN,::ChartGetDouble(this.ID(),CHART_FIXED_MIN));                   // Fixed chart minimum
   this.SetProperty(CHART_PROP_POINTS_PER_BAR,::ChartGetDouble(this.ID(),CHART_POINTS_PER_BAR));         // Scale in points per bar
   this.SetProperty(CHART_PROP_PRICE_MIN,::ChartGetDouble(this.ID(),CHART_PRICE_MIN));                   // Chart minimum
   this.SetProperty(CHART_PROP_PRICE_MAX,::ChartGetDouble(this.ID(),CHART_PRICE_MAX));                   // Chart maximum
//--- Set string properties
   this.SetProperty(CHART_PROP_COMMENT,::ChartGetString(this.ID(),CHART_COMMENT));                       // Comment text on the chart
   this.SetProperty(CHART_PROP_EXPERT_NAME,::ChartGetString(this.ID(),CHART_EXPERT_NAME));               // name of an EA launched on the chart
   this.SetProperty(CHART_PROP_SCRIPT_NAME,::ChartGetString(this.ID(),CHART_SCRIPT_NAME));               // name of a script launched on the chart
   this.SetProperty(CHART_PROP_SYMBOL,::ChartSymbol(this.ID()));                                         // Chart symbol

   this.m_digits=(int)::SymbolInfoInteger(this.Symbol(),SYMBOL_DIGITS);
   this.CreateWindowsList();
  }
//+------------------------------------------------------------------+
Wir entfernen den Code-Block aus der Methode GetPropertyDescription(), die die Beschreibung einer Integer-Eigenschaft eines Objekts zurückgibt,, in dem die Beschreibung des Parameters für die Sichtbarkeit des Fensters erstellt wird, da ich diese Eigenschaft aus dem Objekt entfernt habe:
      property==CHART_PROP_WINDOWS_TOTAL  ?  CMessage::Text(MSG_CHART_OBJ_WINDOWS_TOTAL)+
         (!this.SupportProperty(property) ?  ": "+CMessage::Text(MSG_LIB_PROP_NOT_SUPPORTED) :
          ": "+(string)this.GetProperty(property)
         )  :
      property==CHART_PROP_WINDOW_IS_VISIBLE  ?  CMessage::Text(MSG_CHART_OBJ_WINDOW_IS_VISIBLE)+
         (!this.SupportProperty(property) ?  ": "+CMessage::Text(MSG_LIB_PROP_NOT_SUPPORTED) :
          ": "+(this.GetProperty(property) ? CMessage::Text(MSG_LIB_TEXT_YES) : CMessage::Text(MSG_LIB_TEXT_NO))
         )  :
      property==CHART_PROP_WINDOW_HANDLE  ?  CMessage::Text(MSG_CHART_OBJ_WINDOW_HANDLE)+
         (!this.SupportProperty(property) ?  ": "+CMessage::Text(MSG_LIB_PROP_NOT_SUPPORTED) :
          ": "+(string)this.GetProperty(property)
         )  :
In den Methoden, die die Daten aller Indikatoren in allen Chart-Fenstern und die Eigenschaften aller Chart-Fenster im Journal anzeigen, ersetzen wir die Schleifengröße durch die Anzahl der Chart-Fenster-Objekte in den Listen:
//+-------------------------------------------------------------------+
//| Display data of all indicators of all chart windows in the journal|
//+-------------------------------------------------------------------+
void CChartObj::PrintWndIndicators(void)
  {
   for(int i=0;i<this.m_list_wnd.Total();i++)
     {
      CChartWnd *wnd=m_list_wnd.At(i);
      if(wnd==NULL)
         continue;
      wnd.PrintIndicators(true);
     }
  }
//+------------------------------------------------------------------+
//| Display the properties of all chart windows in the journal       |
//+------------------------------------------------------------------+
void CChartObj::PrintWndParameters(void)
  {
   for(int i=0;i<this.m_list_wnd.Total();i++)
     {
      CChartWnd *wnd=m_list_wnd.At(i);
      if(wnd==NULL)
         continue;
      wnd.PrintParameters(true);
     }
  }
//+------------------------------------------------------------------+
Zuvor wurden die Schleifen bis zu dem von der Methode WindowsTotal() zurückgegebenen Wert gezählt, was nicht ganz korrekt ist. Die Methode gibt den tatsächlichen Wert aus dem Chart zurück, während die Listen entweder mehr oder weniger Objekte im Vergleich zu ihrer tatsächlichen Anzahl enthalten können. Dies geschieht beim Ändern ihrer Anzahl im Terminal Chart. Daher ist die Schleife, die auf der falschen Anzahl von Objekten in der Liste basiert, fehlerbehaftet. Genau das habe ich hier behoben.
Implementieren wir die Methode, die das Chart-Objekt und die Liste seiner Fenster aktualisiert:
//+------------------------------------------------------------------+
//| Update the chart object and its window list                      |
//+------------------------------------------------------------------+
void CChartObj::Refresh(void)
  {
   int change=this.WindowsTotal()-this.m_list_wnd.Total();
   if(change==0)
      return;
   this.CreateWindowsList();
  }
//+------------------------------------------------------------------+
Hier zählen wir die Differenz zwischen der tatsächlichen Anzahl der Chart-Fenster und der Anzahl der Fenster-Objekte in der Liste. Wenn es keine Differenz gibt, gab es keine Änderungen — wir verlassen die Methode, andernfalls erstellen wir erneut die vollständige Liste aller zum Chart-Objekt gehörenden Objekte der Chart-Fenster. Das ist viel einfacher, als nach Unterschieden zwischen Objekten oder fehlenden Chart-Objekten zu suchen, um überflüssige zu entfernen oder neue in die Liste aufzunehmen.
Implementieren wir die Methode, die die Liste der zum Chart-Objekt gehörenden Objekte der Chart-Fenster erstellt:
//+------------------------------------------------------------------+
//| Create the list of chart windows                                 |
//+------------------------------------------------------------------+
void CChartObj::CreateWindowsList(void)
  {
   this.m_list_wnd.Clear();
   int total=this.WindowsTotal();
   for(int i=0;i<total;i++)
     {
      CChartWnd *wnd=new CChartWnd(m_chart_id,i);
      if(wnd==NULL)
         continue;
      this.m_list_wnd.Sort();
      if(!m_list_wnd.Add(wnd))
         delete wnd;
     }
  }
//+------------------------------------------------------------------+
Hier leeren wir die Liste der Fenster-Objekte, erhalten die Gesamtzahl der Chart-Fenster aus seinen Terminal-Parametern und, in der Schleife durch die erhaltene Anzahl von Fenstern, erzeugen ein neues Chart-Fenster-Objekt und hinzufügen es zur Liste. Wenn das Hinzufügen des Objekts zur Liste fehlgeschlagen ist, entfernen wir es, um Speicherlecks zu vermeiden.
Damit ist die Verbesserung der Bibliotheksklassen abgeschlossen.
Beginnen wir mit der Erstellung der Kollektionsklasse der Chart-Objekte.
Die Kollektionsklasse der Chart-Objekte
Ähnlich wie beim Chart-Objekt, wo wir die Änderungen in der Anzahl der Chart-Fenster überprüfen, um die Aktualisierung ihrer Anzahl im Objekt zu aktivieren, werden wir in der Chart-Objekt-Kollektion die Änderungen in der Anzahl der geöffneten Charts überprüfen, um den Neuaufbau der Kollektionsliste der Chart-Objekte zu starten.
Zuerst überprüfen wir die Anzahl der Fenster der vorhandenen Chart-Objekte. Als Nächstes wird die Änderung der Anzahl der geöffneten Charts geprüft. Wenn das Prüfergebnis ungleich Null ist, wird die Kollektion der Chart-Objekte neu erstellt.
Erstellen wir im Bibliotheksordner \MQL5\Include\DoEasy\Collections\ChartObjCollection.mqh die neue Datei der Klasse CChartObjCollection. Die Klasse sollte von der Klasse des Basisobjekts aller Bibliotheksobjekte CBaseObj abgeleitet sein. Die Chart-Objekt-Datei sollte in die Datei der Chart-Objekt-Kollektionsklasse eingebunden werden:
//+------------------------------------------------------------------+
//|                                           ChartObjCollection.mqh |
//|                                  Copyright 2021, MetaQuotes Ltd. |
//|                             https://mql5.com/en/users/artmedia70 |
//+------------------------------------------------------------------+
#property copyright "Copyright 2021, MetaQuotes Ltd."
#property link      "https://mql5.com/en/users/artmedia70"
#property version   "1.00"
//+------------------------------------------------------------------+
//| Include files                                                    |
//+------------------------------------------------------------------+
#include "ListObj.mqh"
#include "..\Services\Select.mqh"
#include "..\Objects\Chart\ChartObj.mqh"
//+------------------------------------------------------------------+
//| MQL5 signal object collection                                    |
//+------------------------------------------------------------------+
class CChartObjCollection : public CBaseObj
  {
  }
Im privaten Teil der Klasse deklarieren wir die CListObj-Liste, in der Chart-Objekte gespeichert werden, die Variable zur Abfrage der bisherigen Anzahl der geöffneten Charts im Terminal und Hilfsmethoden zur Gestaltung des Klassenbetriebs:
//+------------------------------------------------------------------+
//| MQL5 signal object collection                                    |
//+------------------------------------------------------------------+
class CChartObjCollection : public CBaseObj
  {
private:
   CListObj                m_list;                                   // List of chart objects
   int                     m_charts_total_prev;                      // Previous number of charts in the terminal
   //--- Return the number of charts in the terminal
   int                     ChartsTotal(void) const;
   //--- Return the flag indicating the existence of (1) a chart object and (2) a chart
   bool                    IsPresentChartObj(const long chart_id);
   bool                    IsPresentChart(const long chart_id);
   //--- Create a new chart object and add it to the list
   bool                    CreateNewChartObj(const long chart_id,const string source);
   //--- Find the missing chart object, create it and add it to the collection list
   bool                    FindAndCreateMissingChartObj(void);
   //--- Find a chart object not present in the terminal and remove it from the list
   void                    FindAndDeleteExcessChartObj(void);
public:
  }
Richten wir die Standardmethoden im öffentlichen Bereich der Klasse ein:
public:
//--- Return (1) itself and (2) chart object collection list
   CChartObjCollection    *GetObject(void)                                 { return &this;                  }
   CArrayObj              *GetList(void)                                   { return &this.m_list;           }
   //--- Return the list by selected (1) integer, (2) real and (3) string properties meeting the compared criterion
   CArrayObj              *GetList(ENUM_CHART_PROP_INTEGER property,long value,ENUM_COMPARER_TYPE mode=EQUAL)  { return CSelect::ByChartProperty(this.GetList(),property,value,mode);  }
   CArrayObj              *GetList(ENUM_CHART_PROP_DOUBLE property,double value,ENUM_COMPARER_TYPE mode=EQUAL) { return CSelect::ByChartProperty(this.GetList(),property,value,mode);  }
   CArrayObj              *GetList(ENUM_CHART_PROP_STRING property,string value,ENUM_COMPARER_TYPE mode=EQUAL) { return CSelect::ByChartProperty(this.GetList(),property,value,mode);  }
//--- Return the number of chart objects in the list
   int                     DataTotal(void)                           const { return this.m_list.Total();    }
//--- Display (1) the complete and (2) short collection description in the journal
   void                    Print(void);
   void                    PrintShort(void);
//--- Constructor
                           CChartObjCollection();
und die weiteren Methoden:
//--- Return the pointer to the chart object (1) by ID and (2) by an index in the list
   CChartObj              *GetChart(const long id);
   CChartObj              *GetChart(const int index)                       { return this.m_list.At(index);  }
//--- Return the list of chart objects by (1) symbol and (2) timeframe
   CArrayObj              *GetChartsList(const string symbol)              { return this.GetList(CHART_PROP_SYMBOL,symbol,EQUAL);         }
   CArrayObj              *GetChartsList(const ENUM_TIMEFRAMES timeframe)  { return this.GetList(CHART_PROP_TIMEFRAME,timeframe,EQUAL);   }
//--- Return the chart ID with the program
   long                    GetMainChartID(void)                      const { return CBaseObj::GetMainChartID();   }
//--- Create the collection list of chart objects
   bool                    CreateCollection(void);
//--- Update (1) the chart object collection list and (2) the specified chart object
   void                    Refresh(void);
   void                    Refresh(const long chart_id);

  };
//+------------------------------------------------------------------+
Werfen wir einen Blick auf die Implementierung einiger Klassenmethoden.
Im Klassenkonstruktor leeren wir die Liste der Kollektions-Objekte, setzen das Flag "Sortierte Liste" für die Liste, weisen der Chart-Objekt-Kollektions-ID der Liste zu und speichern die Anzahl der aktuell geöffneten Charts im Terminal:
//+------------------------------------------------------------------+
//| Constructor                                                      |
//+------------------------------------------------------------------+
CChartObjCollection::CChartObjCollection()
  {
   this.m_list.Clear();
   this.m_list.Sort();
   this.m_list.Type(COLLECTION_CHARTS_ID);
   this.m_charts_total_prev=this.ChartsTotal();
  }
//+------------------------------------------------------------------+
MQL bietet keine Funktion, die die Anzahl der offenen Charts zurückgibt. Außerdem können wir nicht durch das vorgefertigte Array der offenen Charts in einer Schleife gehen und jeden nachfolgenden Chart durch den Schleifenindex erhalten. Es gibt jedoch eine Funktion, die die ID des allerersten Charts zurückgibt ChartFirst() und die Funktion, die die ID des nächsten Charts nach dem angegebenen zurückgibt ChartNext(). So sind wir in der Lage, eine Schleife durch alle geöffneten Charts zu erstellen, die jeden nachfolgenden Chart nacheinander auf Basis der ID des vorherigen Charts erhält. Die Info zu ChartNext() in der Hilfe enthält ein Beispiel für das Anlegen einer solchen Schleife:
//--- variables for chart identifiers
   long currChart,prevChart=ChartFirst();
   int i=0,limit=100;
   Print("ChartFirst = ",ChartSymbol(prevChart)," ID = ",prevChart);
   while(i<limit)// we probably have no more than 100 open charts
     {
      currChart=ChartNext(prevChart); // get new chart on the basis of the previous one
      if(currChart<0) break;          // the end of chart list is reached
      Print(i,ChartSymbol(currChart)," ID =",currChart);
      prevChart=currChart;// memorize identifier of the current chart for ChartNext()
      i++;// do not forget to increase the counter
     }
Basierend auf einer solchen Schleife werde ich benutzerdefinierte Methoden erstellen, die das Arbeiten mit offenen Charts des Client-Terminals erfordern.
Die Methode, die die Kollektionsliste der Chart-Objekte erstellt:
//+------------------------------------------------------------------+
//| Create the collection list of chart objects                      |
//+------------------------------------------------------------------+
bool CChartObjCollection::CreateCollection(void)
  {
   //--- Clear the list and set the flag of sorting by the chart ID
   m_list.Clear();
   m_list.Sort(SORT_BY_CHART_ID);
   //--- Declare the variables and get the first chart ID
   long curr_chart,prev_chart=::ChartFirst();
   int i=0;
   //--- Create the first chart object and add it to the list
   if(!this.CreateNewChartObj(prev_chart,DFUN))
      return false;
   //--- In the loop by the total number of terminal charts (not more than 100)
   while(i<CHARTS_MAX)
     {
      //--- based on the previous one, get the new chart
      curr_chart=::ChartNext(prev_chart);
      //--- When reaching the end of the chart list, complete the loop
      if(curr_chart<0) break;
      //--- Create the chart object based on the current chart ID in the loop and add it to the list
      if(!this.CreateNewChartObj(curr_chart,DFUN))
         return false;
      //--- remember the current chart ID for ChartNext() and increase the loop counter
      prev_chart=curr_chart;
      i++;
     }
   //--- Filled in the list successfully
   return true;
  }
//+------------------------------------------------------------------+
Die gesamte Methodenlogik ist hier in den Kommentaren zum Code beschrieben. Kurz gesagt, zuerst löschen wir die Kollektionsliste, indem wir zuvor hinzugefügte Objekte entfernen. Dann wird in der obigen Schleife jedes nachfolgende geöffnete Chart abgerufen und seine ID verwendet, um ein neues Chart-Objekt zu erstellen und es der Kollektionsliste hinzuzufügen.
Die Methode zur Aktualisierung der Kollektionsliste der Chart-Objekte:
//+------------------------------------------------------------------+
//| Update the collection list of chart objects                      |
//+------------------------------------------------------------------+
void CChartObjCollection::Refresh(void)
  {
   //--- Get the number of open charts in the terminal and
   int charts_total=this.ChartsTotal();
   //--- calculate the difference between the number of open charts in the terminal
   //--- and chart objects in the collection list. These values are displayed in the chart comment
   int change=charts_total-this.m_list.Total();
   Comment(DFUN,", list total=",DataTotal(),", charts total=",charts_total,", change=",change);
   //--- If there are no changes, leave
   if(change==0)
      return;
   //--- If a chart is added in the terminal
   if(change>0)
     {
      //--- Find the missing chart object, create and add it to the collection list
      this.FindAndCreateMissingChartObj();
      //--- Get the current chart and return to it since
      //--- adding a new chart switches the focus to it
      CChartObj *chart=this.GetChart(GetMainChartID());
      if(chart!=NULL)
         chart.SetBringToTopON(true);
     }
   //--- If a chart is removed from the terminal
   else if(change<0)
    {
     //--- Find an extra chart object in the collection list and remove it from the list
     this.FindAndDeleteExcessChartObj();
    }
   //--- In the loop by the number of chart objects in the list,
   for(int i=0;i<this.m_list.Total();i++)
     {
      //--- get the next chart object and
      CChartObj *chart=this.m_list.At(i);
      if(chart==NULL)
         continue;
      //--- update it
      chart.Refresh();
     }
  }
//+------------------------------------------------------------------+
Die gesamte Methodenlogik ist in den Kommentaren zum Code beschrieben. Kurz gesagt, zuerst wird die Änderung der Anzahl der offenen Charts im Client-Terminal überprüft. Wenn ein Chart hinzugefügt wurde, rufen wir die Methode FindAndCreateMissingChartObj() auf, in der ein fehlendes Chart-Objekt gesucht, erstellt und zur Kollektionsliste hinzugefügt wird. Danach wird der Fokus auf das aktuelle Chart mit dem Programm umgeschaltet (da das Hinzufügen eines neuen Charts im Terminal den Fokus auf dieses schaltet). Wenn das Chart aus dem Client-Terminal entfernt wird, wird die Methode aufgerufen, die nach dem zusätzlichen Chart-Objekt sucht und es aus der Liste entfernt. Schließlich werden alle Chart-Objekte aktualisiert — die Methode Refresh() des Chart-Objekts prüft Änderungen in der Anzahl der an das Chart angehängten Fenster und ändert deren Anzahl in der eigenen Fensterliste, wenn einige Änderungen festgestellt wurden.
Die Methode zum Aktualisieren des Chart-Objekts, das durch die ID:
//+------------------------------------------------------------------+
//| Update the specified chart object                                |
//+------------------------------------------------------------------+
void CChartObjCollection::Refresh(const long chart_id)
  {
   CChartObj *chart=this.GetChart(chart_id);
   if(chart==NULL)
      return;
   chart.Refresh();
  }
//+------------------------------------------------------------------+
Hier holen wir das Chart-Objekt aus der Kollektionsliste nach ID und aktualisieren es.
Die Methode, die die vollständige Kollektionsliste an die Zeitschrift zurückgibt:
//+------------------------------------------------------------------+
//| Display complete collection description to the journal           |
//+------------------------------------------------------------------+
void CChartObjCollection::Print(void)
  {
   //--- Display the header in the journal and print all chart objects in full
   ::Print(CMessage::Text(MSG_CHART_COLLECTION_TEXT_CHART_COLLECTION),":");
   for(int i=0;i<this.m_list.Total();i++)
     {
      CChartObj *chart=this.m_list.At(i);
      if(chart==NULL)
         continue;
      chart.Print();
     }
  }
//+------------------------------------------------------------------+
Hier wird zuerst die Kopfzeile gedruckt, dann, in der Schleife nach der Gesamtzahl der Objekte in der Kollektionsliste, das nächste Chart-Objekt geholt und seine vollständige Beschreibung angezeigt.
Die Methode, die die kurze Kollektionsliste in das Journal schreibt:
//+------------------------------------------------------------------+
//| Display the short collection description in the journal          |
//+------------------------------------------------------------------+
void CChartObjCollection::PrintShort(void)
  {
   //--- Display the header in the journal and print short descriptions of chart objects
   ::Print(CMessage::Text(MSG_CHART_COLLECTION_TEXT_CHART_COLLECTION),":");
   for(int i=0;i<this.m_list.Total();i++)
     {
      CChartObj *chart=this.m_list.At(i);
      if(chart==NULL)
         continue;
      chart.PrintShort(true);
     }
  }
//+------------------------------------------------------------------+
Die Logik der Methode ist identisch mit der oben betrachteten, außer dass das Journal Kurzbeschreibungen von Chart-Objekten anzeigt.
Die Methode gibt die Anzahl der Charts im Terminal zurück:
//+------------------------------------------------------------------+
//| Return the number of charts in the terminal                      |
//+------------------------------------------------------------------+
int CChartObjCollection::ChartsTotal(void) const
  {
   //--- Declare the variables and get the first chart ID
   long currChart,prevChart=::ChartFirst();
   int res=1; // We definitely have one chart - the current one
   //--- In the loop by the total number of terminal charts (not more than 100)
   while(res<CHARTS_MAX)
     {
      //--- based on the previous one, get the new chart
      currChart=::ChartNext(prevChart);
      //--- When reaching the end of the chart list, complete the loop
      if(currChart<0) break;
      prevChart=currChart;
      res++;
     }
   //--- Return the obtained loop counter
   return res;
  }
//+------------------------------------------------------------------+
Die Logik der Methode wird in den Code-Kommentaren beschrieben. Kurz gesagt, wir haben mindestens einen offenen Chart — den, auf dem das Programm läuft. Daher beginnt der Schleifenzähler bei eins. Als Nächstes wird in der Schleife jedes nachfolgende Chart basierend auf dem vorherigen empfangen, während der Zähler erhöht wird. Als Ergebnis wird nach dem Ende der Schleife der in der Schleife erhaltene Zählerwert zurückgegeben.
Die Methode erstellt ein neues Chart-Objekt und fügt es der Kollektionsliste hinzu:
//+------------------------------------------------------------------+
//| Create a new chart object and add it to the list                 |
//+------------------------------------------------------------------+
bool CChartObjCollection::CreateNewChartObj(const long chart_id,const string source)
  {
   ::ResetLastError();
   CChartObj *chart_obj=new CChartObj(chart_id);
   if(chart_obj==NULL)
     {
      CMessage::ToLog(source,MSG_CHART_COLLECTION_ERR_FAILED_CREATE_CHART_OBJ,true);
      return false;
     }
   this.m_list.Sort(SORT_BY_CHART_ID);
   if(!this.m_list.InsertSort(chart_obj))
     {
      CMessage::ToLog(source,MSG_CHART_COLLECTION_ERR_FAILED_ADD_CHART,true);
      delete chart_obj;
      return false;
     }
   return true;
  }
//+------------------------------------------------------------------+
Hier erhält die Methode die ID (chart_id) des Charts, dessen Chart-Objekt erzeugt werden soll, und den Namen (source) der Methode, aus der die Methode aufgerufen wird. Erzeugen wir ein neues Chart-Objekt. Wenn die Erstellung fehlgeschlagen ist, zeigen wir die entsprechende Meldung an und geben false zurück. Wenn das Objekt erfolgreich erstellt wurde, setzen wir das Flag der nach Chart-IDs sortierten Liste auf die Kollektionsliste und versuchen, das Objekt der sortierten Liste hinzuzufügen. Wenn das Hinzufügen des Objekts zur Liste fehlgeschlagen ist, geben wir die entsprechende Meldung aus, entfernen das neu erstellte Objekt und geben false zurück. Im Erfolgsfall geben wir true zurück.
Die Methode gibt den Zeiger auf das Chart-Objekt per Chart-ID zurück:
//+------------------------------------------------------------------+
//| Return the pointer to the chart object by ID                     |
//+------------------------------------------------------------------+
CChartObj *CChartObjCollection::GetChart(const long id)
  {
   CArrayObj *list=CSelect::ByChartProperty(GetList(),CHART_PROP_ID,id,EQUAL);
   return(list!=NULL ? list.At(0) : NULL);
  }
//+------------------------------------------------------------------+
Hier erhalten wir die Liste der Chart-Objekte, die die Eigenschaft "Chart-ID" gleich dem an die Methode übergebenen Wert haben (die Liste kann ein einzelnes Chart-Objekt enthalten, da die Chart-IDs eindeutig sind). Wenn das Objekt in der neuen Liste mit einem einzelnen Element erhalten wurde, geben wir es zurück. In allen anderen Fällen wird NULL zurückgegeben — das Objekt wurde nicht erhalten.
Die Methode gibt das Flag zurück, das die Existenz eines Chart-Objekts anzeigt:
//+------------------------------------------------------------------+
//| Return the flag indicating the existence of a chart object       |
//+------------------------------------------------------------------+
bool CChartObjCollection::IsPresentChartObj(const long chart_id)
  {
   return(this.GetChart(chart_id)!=NULL);
  }
//+------------------------------------------------------------------+
Hier wird, wenn es möglich ist, ein Objekt mit einer angegebenen ID aus der Kollektionsliste zu erhalten (das Anfrageergebnis ist nicht NULL), true zurückgegeben. Andernfalls wird false zurückgegeben.
Die Methode gibt das Flag zurück, das die Existenz eines Charts im Client-Terminal anzeigt:
//+------------------------------------------------------------------+
//| Return the flag indicating the existence of a chart              |
//+------------------------------------------------------------------+
bool CChartObjCollection::IsPresentChart(const long chart_id)
  {
   //--- Declare the variables and get the first chart ID
   long curr_chart,prev_chart=::ChartFirst();
   //--- If the IDs match, return 'true'
   if(prev_chart==chart_id)
      return true;
   int i=0;
   //--- In the loop by the total number of terminal charts (not more than 100)
   while(i<CHARTS_MAX)
     {
      //--- based on the previous one, get the new chart
      curr_chart=::ChartNext(prev_chart);
      //--- When reaching the end of the chart list, complete the loop
      if(curr_chart<0) break;
      //--- If the IDs match, return 'true'
      if(curr_chart==chart_id)
         return true;
      //--- remember the current chart ID for ChartNext() and increase the loop counter
      prev_chart=curr_chart;
      i++;
     }
   return false;
  }
//+------------------------------------------------------------------+
Hier in der Schleife über die Terminal-Charts, die auf Basis der vorherigen Chart-ID erhalten wurden, prüfen wir, ob die ID des aktuell ausgewählten Charts in der Schleife mit dem an die Methode übergebenen Wert übereinstimmt. Wenn die Werte übereinstimmen, ist der Chart mit einer solchen ID vorhanden, und es wird true zurückgegeben.
Nach dem Ende der Schleife wird false zurückgegeben — das Chart mit der angegebenen ID wurde nicht gefunden.
Die Methode, die nach einem fehlenden Chart-Objekt sucht, sowie dieses erstellt und der Kollektionsliste hinzufügt:
//+------------------------------------------------------------------+
//| Find a missing chart object,                                     |
//| create it and add to the collection list                         |
//+------------------------------------------------------------------+
bool CChartObjCollection::FindAndCreateMissingChartObj(void)
  {
   //--- Declare the variables and get the first chart ID
   long curr_chart,prev_chart=::ChartFirst();
   int i=0;
   //--- If the first chart object is not in the list, attempt to create and add it to the list
   if(!this.IsPresentChartObj(prev_chart) && !this.CreateNewChartObj(prev_chart,DFUN))
      return false;
   //--- In the loop by the total number of terminal charts (not more than 100), look for the rest of the charts
   while(i<CHARTS_MAX)
     {
      //--- based on the previous one, get the new chart
      curr_chart=::ChartNext(prev_chart);
      //--- When reaching the end of the chart list, complete the loop
      if(curr_chart<0) break;
      //--- If the object is not in the list, attempt to create and add it to the list
      if(!this.IsPresentChartObj(curr_chart) && !this.CreateNewChartObj(curr_chart,DFUN))
         return false;
      //--- remember the current chart ID for ChartNext() and increase the loop counter
      prev_chart=curr_chart;
      i++;
     }
   return true;
  }
//+------------------------------------------------------------------+
Auch hier verwenden wir die Schleife über die Charts basierend auf der vorherigen Chart-ID. Erst stellen wir das Vorhandensein/Fehlen des Chart-Objekts mit dem Programm in der Kollektionsliste fest, dann suchen wir nach fehlenden Objekten der im Terminal vorhandenen Charts durch alle verbleibenden Charts in der Schleife, um diese der Kollektionsliste hinzufügen.
Die Methode sucht und entfernt ein Chart-Objekt, das im Terminal fehlt, aber in der Kollektionsliste noch vorhanden ist:
//+-----------------------------------------------------------------------------+
//|Find a chart object not present in the terminal and remove it from the list  |
//+-----------------------------------------------------------------------------+
void CChartObjCollection::FindAndDeleteExcessChartObj(void)
  {
   for(int i=this.m_list.Total()-1;i>WRONG_VALUE;i--)
     {
      CChartObj *chart=this.m_list.At(i);
      if(chart==NULL)
         continue;
      if(!this.IsPresentChart(chart.ID()))
        {
         m_list.Delete(i);
        }
     }
  }
//+------------------------------------------------------------------+
Hier, in einer umgekehrten Schleife durch alle Chart-Objekte in der Kollektionsliste, holen wir uns ein anderes Chart-Objekt. Wenn das Client-Terminal aktuell über kein Chart mit einer ID verfügt, die mit der des Chart-Objekts übereinstimmt, entfernen wir das Objekt aus der Kollektionsliste.
Damit ist die Erstellung der ersten Version der Kollektionsklasse für Chart-Objekte abgeschlossen.
Nun müssen wir die Datei der erstellten Chart-Objekt-Kollektionsklasse in die Hauptklasse der Bibliothek CEngine einbinden und die Methoden für den Zugriff auf die Methoden der Chart-Objekt-Kollektionsklasse erstellen, damit wir von unseren Programmen aus mit ihnen arbeiten können.
In \MQL5\Include\DoEasy\Engine.mqh der Klasse CEngine binden wir die Datei einer neu erstellten Chart-Objekt Kollektionsklasse ein:
//+------------------------------------------------------------------+
//|                                                       Engine.mqh |
//|                        Copyright 2020, MetaQuotes Software Corp. |
//|                             https://mql5.com/en/users/artmedia70 |
//+------------------------------------------------------------------+
#property copyright "Copyright 2020, MetaQuotes Software Corp."
#property link      "https://mql5.com/en/users/artmedia70"
#property version   "1.00"
//+------------------------------------------------------------------+
//| Include files                                                    |
//+------------------------------------------------------------------+
#include "Services\TimerCounter.mqh"
#include "Collections\HistoryCollection.mqh"
#include "Collections\MarketCollection.mqh"
#include "Collections\EventsCollection.mqh"
#include "Collections\AccountsCollection.mqh"
#include "Collections\SymbolsCollection.mqh"
#include "Collections\ResourceCollection.mqh"
#include "Collections\TimeSeriesCollection.mqh"
#include "Collections\BuffersCollection.mqh"
#include "Collections\IndicatorsCollection.mqh"
#include "Collections\TickSeriesCollection.mqh"
#include "Collections\BookSeriesCollection.mqh"
#include "Collections\MQLSignalsCollection.mqh"
#include "Collections\ChartObjCollection.mqh"
#include "TradingControl.mqh"
//+------------------------------------------------------------------+
Wir deklarieren im privaten Abschnitt der Klasse das Objekt der Kollektionsklasse Chart:
//+------------------------------------------------------------------+
//| Library basis class                                              |
//+------------------------------------------------------------------+
class CEngine
  {
private:
   CHistoryCollection   m_history;                       // Collection of historical orders and deals
   CMarketCollection    m_market;                        // Collection of market orders and deals
   CEventsCollection    m_events;                        // Event collection
   CAccountsCollection  m_accounts;                      // Account collection
   CSymbolsCollection   m_symbols;                       // Symbol collection
   CTimeSeriesCollection m_time_series;                  // Timeseries collection
   CBuffersCollection   m_buffers;                       // Collection of indicator buffers
   CIndicatorsCollection m_indicators;                   // Indicator collection
   CTickSeriesCollection m_tick_series;                  // Collection of tick series
   CMBookSeriesCollection m_book_series;                 // Collection of DOM series
   CMQLSignalsCollection m_signals_mql5;                 // Collection of MQL5.com Signals service signals
   CChartObjCollection  m_charts;                        // Chart collection
   CResourceCollection  m_resource;                      // Resource list
   CTradingControl      m_trading;                       // Trading management object
   CPause               m_pause;                         // Pause object
   CArrayObj            m_list_counters;                 // List of timer counters
Platzieren wir im öffentlichen Klassenteil die Methoden für den Zugriff auf die Kollektionsklasse der Chart-Objekte:
//--- Display (1) the complete, (2) short collection description in the journal and (3) parameters of the signal copying settings
   void                 SignalsMQL5Print(void)                                         { m_signals_mql5.Print();                             }
   void                 SignalsMQL5PrintShort(const bool list=false,const bool paid=true,const bool free=true)
                                                                                       { m_signals_mql5.PrintShort(list,paid,free);          }
   void                 SignalsMQL5CurrentSubscriptionParameters(void)                 { this.m_signals_mql5.CurrentSubscriptionParameters();}

//--- Current the chart collection
   bool                 ChartCreateCollection(void)                                    { return this.m_charts.CreateCollection();            }
//--- Return (1) the chart collection and (2) the list of charts from the chart collection
   CChartObjCollection *GetChartObjCollection(void)                                    { return &this.m_charts;                              }
   CArrayObj           *GetListCharts(void)                                            { return this.m_charts.GetList();                     }

//--- Return (1) the specified chart object and (2) the chart object with the program
   CChartObj           *ChartGetChartObj(const long chart_id)                          { return this.m_charts.GetChart(chart_id);            }
   CChartObj           *ChartGetMainChart(void)                                        { return this.m_charts.GetChart(this.m_charts.GetMainChartID());}

//--- Update (1) the chart specified by ID and (2) all charts
   void                 ChartRefresh(const long chart_id)                              { this.m_charts.Refresh(chart_id);                    }
   void                 ChartsRefreshAll(void)                                         { this.m_charts.Refresh();                            }

//--- Return the list of chart objects by (1) symbol and (2) timeframe
   CArrayObj           *ChartGetChartsList(const string symbol)                        { return this.m_charts.GetChartsList(symbol);         }
   CArrayObj           *ChartGetChartsList(const ENUM_TIMEFRAMES timeframe)            { return this.m_charts.GetChartsList(timeframe);      }

//--- Return (1) the buffer collection and (2) the buffer list from the collection
Alle neu aktualisierten Methoden geben einfach das Ergebnis des Aufrufs der entsprechenden Methoden der Chart-Objekt Kollektion zurück, die ich oben gerade betrachtet habe. Alle diese Methoden werden in unseren bibliotheksbasierten Programmen sichtbar und verwendbar sein.
Fügen wir im Klassenkonstruktor die Erstellung eines neuen Zählers für die Chart-Objekt Kollektionsklasse hinzu:
//+------------------------------------------------------------------+
//| CEngine constructor                                              |
//+------------------------------------------------------------------+
CEngine::CEngine() : m_first_start(true),
                     m_last_trade_event(TRADE_EVENT_NO_EVENT),
                     m_last_account_event(WRONG_VALUE),
                     m_last_symbol_event(WRONG_VALUE),
                     m_global_error(ERR_SUCCESS)
  {
   this.m_is_hedge=#ifdef __MQL4__ true #else bool(::AccountInfoInteger(ACCOUNT_MARGIN_MODE)==ACCOUNT_MARGIN_MODE_RETAIL_HEDGING) #endif;
   this.m_is_tester=::MQLInfoInteger(MQL_TESTER);
   this.m_program=(ENUM_PROGRAM_TYPE)::MQLInfoInteger(MQL_PROGRAM_TYPE);
   this.m_name=::MQLInfoString(MQL_PROGRAM_NAME);

   this.m_list_counters.Sort();
   this.m_list_counters.Clear();
   this.CreateCounter(COLLECTION_ORD_COUNTER_ID,COLLECTION_ORD_COUNTER_STEP,COLLECTION_ORD_PAUSE);
   this.CreateCounter(COLLECTION_ACC_COUNTER_ID,COLLECTION_ACC_COUNTER_STEP,COLLECTION_ACC_PAUSE);
   this.CreateCounter(COLLECTION_SYM_COUNTER_ID1,COLLECTION_SYM_COUNTER_STEP1,COLLECTION_SYM_PAUSE1);
   this.CreateCounter(COLLECTION_SYM_COUNTER_ID2,COLLECTION_SYM_COUNTER_STEP2,COLLECTION_SYM_PAUSE2);
   this.CreateCounter(COLLECTION_REQ_COUNTER_ID,COLLECTION_REQ_COUNTER_STEP,COLLECTION_REQ_PAUSE);
   this.CreateCounter(COLLECTION_TS_COUNTER_ID,COLLECTION_TS_COUNTER_STEP,COLLECTION_TS_PAUSE);
   this.CreateCounter(COLLECTION_IND_TS_COUNTER_ID,COLLECTION_IND_TS_COUNTER_STEP,COLLECTION_IND_TS_PAUSE);
   this.CreateCounter(COLLECTION_TICKS_COUNTER_ID,COLLECTION_TICKS_COUNTER_STEP,COLLECTION_TICKS_PAUSE);
   this.CreateCounter(COLLECTION_CHARTS_COUNTER_ID,COLLECTION_CHARTS_COUNTER_STEP,COLLECTION_CHARTS_PAUSE);

   ::ResetLastError();
   #ifdef __MQL5__
      if(!::EventSetMillisecondTimer(TIMER_FREQUENCY))
        {
         ::Print(DFUN_ERR_LINE,CMessage::Text(MSG_LIB_SYS_FAILED_CREATE_TIMER),(string)::GetLastError());
         this.m_global_error=::GetLastError();
        }
   //---__MQL4__
   #else
      if(!this.IsTester() && !::EventSetMillisecondTimer(TIMER_FREQUENCY))
        {
         ::Print(DFUN_ERR_LINE,CMessage::Text(MSG_LIB_SYS_FAILED_CREATE_TIMER),(string)::GetLastError());
         this.m_global_error=::GetLastError();
        }
   #endif
   //---
  }
//+------------------------------------------------------------------+
Wir fügen in der Klasse Timer den Codeblock für die Arbeit mit der Kollektion der Chart-Objekte ein:
//+------------------------------------------------------------------+
//| CEngine timer                                                    |
//+------------------------------------------------------------------+
void CEngine::OnTimer(SDataCalculate &data_calculate)
  {
//--- If this is not a tester, work with collection events by timer
   if(!this.IsTester())
     {
   //--- Timer of the collections of historical orders and deals, as well as of market orders and positions
      int index=this.CounterIndex(COLLECTION_ORD_COUNTER_ID);
      CTimerCounter* cnt1=this.m_list_counters.At(index);
      if(cnt1!=NULL)
        {
         //--- If unpaused, work with the order, deal and position collections events
         if(cnt1.IsTimeDone())
            this.TradeEventsControl();
        }
   //--- Account collection timer
      index=this.CounterIndex(COLLECTION_ACC_COUNTER_ID);
      CTimerCounter* cnt2=this.m_list_counters.At(index);
      if(cnt2!=NULL)
        {
         //--- If unpaused, work with the account collection events
         if(cnt2.IsTimeDone())
            this.AccountEventsControl();
        }
   //--- Timer 1 of the symbol collection (updating symbol quote data in the collection)
      index=this.CounterIndex(COLLECTION_SYM_COUNTER_ID1);
      CTimerCounter* cnt3=this.m_list_counters.At(index);
      if(cnt3!=NULL)
        {
         //--- If the pause is over, update quote data of all symbols in the collection
         if(cnt3.IsTimeDone())
            this.m_symbols.RefreshRates();
        }
   //--- Timer 2 of the symbol collection (updating all data of all symbols in the collection and tracking symbl and symbol search events in the market watch window)
      index=this.CounterIndex(COLLECTION_SYM_COUNTER_ID2);
      CTimerCounter* cnt4=this.m_list_counters.At(index);
      if(cnt4!=NULL)
        {
         //--- If the pause is over
         if(cnt4.IsTimeDone())
           {
            //--- update data and work with events of all symbols in the collection
            this.SymbolEventsControl();
            //--- When working with the market watch list, check the market watch window events
            if(this.m_symbols.ModeSymbolsList()==SYMBOLS_MODE_MARKET_WATCH)
               this.MarketWatchEventsControl();
           }
        }
   //--- Trading class timer
      index=this.CounterIndex(COLLECTION_REQ_COUNTER_ID);
      CTimerCounter* cnt5=this.m_list_counters.At(index);
      if(cnt5!=NULL)
        {
         //--- If unpaused, work with the list of pending requests
         if(cnt5.IsTimeDone())
            this.m_trading.OnTimer();
        }
   //--- Timeseries collection timer
      index=this.CounterIndex(COLLECTION_TS_COUNTER_ID);
      CTimerCounter* cnt6=this.m_list_counters.At(index);
      if(cnt6!=NULL)
        {
         //--- If the pause is over, work with the timeseries list (update all except the current one)
         if(cnt6.IsTimeDone())
            this.SeriesRefreshAllExceptCurrent(data_calculate);
        }

   //--- Timer of timeseries collection of indicator buffer data
      index=this.CounterIndex(COLLECTION_IND_TS_COUNTER_ID);
      CTimerCounter* cnt7=this.m_list_counters.At(index);
      if(cnt7!=NULL)
        {
         //--- If the pause is over, work with the timeseries list of indicator data (update all except for the current one)
         if(cnt7.IsTimeDone())
            this.IndicatorSeriesRefreshAll();
        }
   //--- Tick series collection timer
      index=this.CounterIndex(COLLECTION_TICKS_COUNTER_ID);
      CTimerCounter* cnt8=this.m_list_counters.At(index);
      if(cnt8!=NULL)
        {
         //--- If the pause is over, work with the tick series list (update all except the current one)
         if(cnt8.IsTimeDone())
            this.TickSeriesRefreshAllExceptCurrent();
        }
   //--- Chart collection timer
      index=this.CounterIndex(COLLECTION_CHARTS_COUNTER_ID);
      CTimerCounter* cnt9=this.m_list_counters.At(index);
      if(cnt9!=NULL)
        {
         //--- If unpaused, work with the chart list
         if(cnt9.IsTimeDone())
            this.ChartsRefreshAll();
        }
     }
//--- If this is a tester, work with collection events by tick
   else
     {
      //--- work with events of collections of orders, deals and positions by tick
      this.TradeEventsControl();
      //--- work with events of collections of accounts by tick
      this.AccountEventsControl();
      //--- update quote data of all collection symbols by tick
      this.m_symbols.RefreshRates();
      //--- work with events of all symbols in the collection by tick
      this.SymbolEventsControl();
      //--- work with the list of pending orders by tick
      this.m_trading.OnTimer();
      //--- work with the timeseries list by tick
      this.SeriesRefresh(data_calculate);
      //--- work with the timeseries list of indicator buffers by tick
      this.IndicatorSeriesRefreshAll();
      //--- work with the list of tick series by tick
      this.TickSeriesRefreshAll();
     }
  }
//+------------------------------------------------------------------+
Sobald der Zähler des Timers für die Kollektion eine halbe Sekunde zählt, wird die Methode zum Aktualisieren aller Chart-Objekte in ihren Kollektionen aufgerufen. Auf diese Weise habe ich eine automatisierte Verfolgung der Änderungen in der Anzahl der Charts im Terminal und der Fenster, die mit jedem geöffneten Chart verbunden sind.
Testen Sie die Arbeit der heute erstellten Klasse.
Test
Um den Test durchzuführen, verwenden wir den EA aus dem vorigen Artikel und speichern ihn in \MQL5\Experts\TestDoEasy\Part69\ als TestDoEasyPart69.mq5.
Tatsächlich ändere ich nicht viel an der Logik des bisherigen Expert Advisors — ich zeige kurze Beschreibungen aller Chart-Objekte an, deren Charts im Terminal geöffnet sind, während die vollständige Beschreibung für den Haupt-Chart angezeigt wird. Außerdem bietet die Methode zur Aktualisierung der Kollektionsliste der Kollektionsklasse der Chart-Objekte die Anzeige einer Chart-Meldung, die über die Anzahl der Chart-Objekte in der Kollektion, die Anzahl der entsprechenden offenen Charts und die Differenz dieser Zahlen informiert. Ich werde diesen Debugging-Kommentar später entfernen. Im aktuellen Artikel werde ich ihn verwenden, um zu prüfen, ob die Chart-Objekt Kollektionsklasse korrekt funktioniert.
Entfernen wir zunächst die Einbindung der Chart-Objekt-Klassendatei aus dem EA-Code:
//+------------------------------------------------------------------+
//|                                             TestDoEasyPart68.mq5 |
//|                        Copyright 2021, MetaQuotes Software Corp. |
//|                             https://mql5.com/en/users/artmedia70 |
//+------------------------------------------------------------------+
#property copyright "Copyright 2021, MetaQuotes Software Corp."
#property link      "https://mql5.com/en/users/artmedia70"
#property version   "1.00"
//--- includes
#include <DoEasy\Engine.mqh>
#include <DoEasy\Objects\Chart\ChartObj.mqh>
//--- enums
Jetzt ist die Kollektionsklasse der Chart-Objekte mit dem Hauptobjekt der Bibliothek verbunden und alle Chart-Klassen und ihre Kollektionen sind von ihr aus verfügbar.
Fügen wir im Eingabeblock die Variable ein, die das Flag angibt, das die Notwendigkeit der Verwendung der Chart-Objekt Kollektionsklasse im Programm anzeigt:
//--- input variables
input    ushort            InpMagic             =  123;  // Magic number
input    double            InpLots              =  0.1;  // Lots
input    uint              InpStopLoss          =  150;  // StopLoss in points
input    uint              InpTakeProfit        =  150;  // TakeProfit in points
input    uint              InpDistance          =  50;   // Pending orders distance (points)
input    uint              InpDistanceSL        =  50;   // StopLimit orders distance (points)
input    uint              InpDistancePReq      =  50;   // Distance for Pending Request's activate (points)
input    uint              InpBarsDelayPReq     =  5;    // Bars delay for Pending Request's activate (current timeframe)
input    uint              InpSlippage          =  5;    // Slippage in points
input    uint              InpSpreadMultiplier  =  1;    // Spread multiplier for adjusting stop-orders by StopLevel
input    uchar             InpTotalAttempts     =  5;    // Number of trading attempts
sinput   double            InpWithdrawal        =  10;   // Withdrawal funds (in tester)

sinput   uint              InpButtShiftX        =  0;    // Buttons X shift
sinput   uint              InpButtShiftY        =  10;   // Buttons Y shift

input    uint              InpTrailingStop      =  50;   // Trailing Stop (points)
input    uint              InpTrailingStep      =  20;   // Trailing Step (points)
input    uint              InpTrailingStart     =  0;    // Trailing Start (points)
input    uint              InpStopLossModify    =  20;   // StopLoss for modification (points)
input    uint              InpTakeProfitModify  =  60;   // TakeProfit for modification (points)

sinput   ENUM_SYMBOLS_MODE InpModeUsedSymbols   =  SYMBOLS_MODE_CURRENT;            // Mode of used symbols list
sinput   string            InpUsedSymbols       =  "EURUSD,AUDUSD,EURAUD,EURCAD,EURGBP,EURJPY,EURUSD,GBPUSD,NZDUSD,USDCAD,USDJPY";  // List of used symbols (comma - separator)
sinput   ENUM_TIMEFRAMES_MODE InpModeUsedTFs    =  TIMEFRAMES_MODE_LIST;            // Mode of used timeframes list
sinput   string            InpUsedTFs           =  "M1,M5,M15,M30,H1,H4,D1,W1,MN1"; // List of used timeframes (comma - separator)

sinput   ENUM_INPUT_YES_NO InpUseBook           =  INPUT_YES;                       // Use Depth of Market
sinput   ENUM_INPUT_YES_NO InpUseMqlSignals     =  INPUT_YES;                       // Use signal service
sinput   ENUM_INPUT_YES_NO InpUseCharts         =  INPUT_YES;                       // Use Charts control
sinput   ENUM_INPUT_YES_NO InpUseSounds         =  INPUT_YES;                       // Use sounds

//--- global variables
Jetzt entfernen wir aus dem OnTick() des EA den Codeblock, in dem ich die Liste der Chart-Objekte erstellt und ihre Beschreibungen im Journal angezeigt habe:
//+------------------------------------------------------------------+
//| Expert tick function                                             |
//+------------------------------------------------------------------+
void OnTick()
  {
//--- Handle the NewTick event in the library
   engine.OnTick(rates_data);

//--- If working in the tester
   if(MQLInfoInteger(MQL_TESTER))
     {
      engine.OnTimer(rates_data);   // Working in the timer
      PressButtonsControl();        // Button pressing control
      engine.EventsHandling();      // Working with events
     }

//--- If the trailing flag is set
   if(trailing_on)
     {
      TrailingPositions();          // Trailing positions
      TrailingOrders();             // Trailing pending orders
     }

//--- If it is the first launch
   static bool done=false;
   if(!done)
     {
      //--- Create the list object for storing chart objects
      CArrayObj *list=new CArrayObj();
      if(list==NULL)
         return;
      //--- Declare the variables and get the first chart ID
      long currChart,prevChart=ChartFirst();
      int i=0;
      //--- Create the chart object and add it to the list
      CChartObj *chart_first=new CChartObj(prevChart);
      list.Add(chart_first);
      //--- In the loop by the total number of terminal charts (not more than 100)
      while(i<CHARTS_MAX)
        {
         //--- based on the previous one, get the new chart
         currChart=ChartNext(prevChart);
         //--- When reaching the end of the chart list, complete the loop
         if(currChart<0) break;
         //--- Create the chart object based on the current chart ID in the loop and add it to the list
         CChartObj *chart=new CChartObj(currChart);
         list.Add(chart);
         //--- remember the current chart ID for ChartNext() and increase the loop counter
         prevChart=currChart;
         i++;
        }
      Print("");
      //--- From the filled list in the loop, receive the next chart object and display its short description
      int total=list.Total();
      for(int j=0;j<total;j++)
        {
         CChartObj *chart_obj=list.At(j);
         if(chart_obj!=NULL)
            chart_obj.PrintShort();
        }
      Print("");
      //--- Display the full description of the current chart: in the loop by all objects of the created list
      for(int j=0;j<total;j++)
        {
         //--- get the next chart object and
         CChartObj *chart_obj=list.At(j);
         //--- if its symbol matches the current chart symbol, display its full description in the journal
         if(chart_obj!=NULL && chart_obj.Symbol()==Symbol())
            chart_obj.Print();
        }
      //--- Destroy the list of chart objects
      delete list;
      done=true;
     }
//---
  }
//+------------------------------------------------------------------+
Nun wird all dies mit den folgenden Code-Zeilen gemacht:
//+------------------------------------------------------------------+
//| Expert tick function                                             |
//+------------------------------------------------------------------+
void OnTick()
  {
//--- Handle the NewTick event in the library
   engine.OnTick(rates_data);

//--- If working in the tester
   if(MQLInfoInteger(MQL_TESTER))
     {
      engine.OnTimer(rates_data);   // Working in the timer
      PressButtonsControl();        // Button pressing control
      engine.EventsHandling();      // Working with events
     }

//--- If the trailing flag is set
   if(trailing_on)
     {
      TrailingPositions();          // Trailing positions
      TrailingOrders();             // Trailing pending orders
     }

//--- If it is the first launch
   static bool done=false;
   if(!done)
     {
      //--- Get the chart with the EA from the collection and display its full description
      CChartObj *chart_main=engine.ChartGetMainChart();
      Print("");
      chart_main.Print();
      done=true;
     }
//---
  }
//+------------------------------------------------------------------+
Hier sehen wir nur die vollständige Beschreibung eines Charts, auf dem ein EA gestartet wird. Die kurzen Beschreibungen aller Chart-Objekte innerhalb der Kollektion sollen im folgenden Codeblock der Funktion OnInitDoEasy() angezeigt werden:
//--- If working with signals is not enabled or failed to create the signal collection,
//--- disable copying deals by subscription
   else
      engine.SignalsMQL5CurrentSetSubscriptionEnableOFF();

//--- Create the chart collection
//--- If working with charts and the chart collection is created
   if(InpUseCharts && engine.ChartCreateCollection())
     {
      //--- Check created chart objects - display the short collection description in the journal
      engine.GetChartObjCollection().PrintShort();
     }

//--- Create resource text files
In OnBookEvent() des EA, machen wir die Anzeige der Debugging-Daten aus der Kollektionsklasse Market Depth auf dem Chart zu Kommentaren, da wir diese Daten jetzt nicht benötigen (im Moment ist es aufgrund des gelegentlichen seltsamen Terminal-Verhaltens bei der Arbeit mit der Market Depth vorhanden — der EA reagiert manchmal für eine recht lange Zeit nicht, und diese Informationen, die oft ihre Werte ändern, erlauben uns, seine Arbeit zu sehen). Außerdem würde der Kommentar verhindern, dass wir die von der Kollektionsklasse des Chart-Objekts erkannten Änderungen sehen können.
//+------------------------------------------------------------------+
//| OnBookEvent function                                             |
//+------------------------------------------------------------------+
void OnBookEvent(const string& symbol)
  {
   static bool first=true;
   //--- Leave if failed to update the symbol snapshot series
   if(!engine.OnBookEvent(symbol))
      return;
   //--- Work by the current symbol
   if(symbol==Symbol())
     {
      //--- Get the DOM snapshot series of the current symbol
      CMBookSeries *book_series=engine.GetMBookSeries(symbol);
      if(book_series==NULL)
         return;
      //--- Get the last DOM snapshot object from the DOM snapshot series object
      CMBookSnapshot *book=book_series.GetLastMBook();
      if(book==NULL)
         return;
      //--- Get the very first and last DOM order objects from the DOM snapshot object
      CMarketBookOrd *ord_0=book.GetMBookByListIndex(0);
      CMarketBookOrd *ord_N=book.GetMBookByListIndex(book.DataTotal()-1);
      if(ord_0==NULL || ord_N==NULL) return;
      //--- Display the time of the current DOM snapshot in the chart comment,
      //--- the maximum number of displayed orders in DOM for a symbol,
      //--- the obtained number of orders in the current DOM snapshot,
      //--- the total number of DOM snapshots set in the series list and
      //--- the highest and lowest orders of the current DOM snapshot
      //Comment
      //  (
      //   DFUN,book.Symbol(),": ",TimeMSCtoString(book.Time()),
      //   //", symbol book size=",sym.TicksBookdepth(),
      //   ", last book data total: ",book.DataTotal(),
      //   ", series books total: ",book_series.DataTotal(),
      //   "\nMax: ",ord_N.Header(),"\nMin: ",ord_0.Header()
      //  );
      //--- Display the first DOM snapshot in the journal
      if(first)
        {
         //--- series description
         book_series.Print();
         //--- snapshot description
         book.Print();
         first=false;
        }
     }
  }
//+------------------------------------------------------------------+
Kompilieren Sie den EA. Öffnen Sie vier beliebige Charts im Terminal (starten Sie den EA auf dem ersten) und schaffen Sie eine Umgebung, die derjenigen während des Tests im vorherigen Artikel entspricht:
Fügen wir den Fraktal-Indikator in den Chart mit dem EA ein und wir fügen ein weiteres Indikatorfenster hinzu, z.B. DeMarker, das einen anderen Indikator enthält, z.B. AMA, der auf DeMarker-Daten basiert.
Platzieren Sie das Stochastik-Fenster auf den zweiten Chart...
Nach dem Start des EA werden Daten zu den angelegten Chart-Objekten Kollektion Objekte und der Chart mit dem Programm im Journal angezeigt:
Chart collection:
- Main chart window EURUSD H4 ID: 131733844391938630, HWND: 920114, Subwindows: 1
- Main chart window GBPUSD H4 ID: 131733844391938633, HWND: 592798, Subwindows: No
- Main chart window AUDUSD H1 ID: 131733844391938634, HWND: 527424, Subwindows: 2
- Main chart window USDRUB H4 ID: 131733844391938635, HWND: 920468, Subwindows: No
Subscribed to Depth of Market EURUSD
Library initialization time: 00:00:05.922

============= The beginning of the parameter list (Main chart window EURUSD H4) =============
Chart ID: 131733844391938630
Timeframe: H4
Drawing attributes of a price chart: Yes
Object "Chart": No
Chart on top of other charts: No
Accessing the context menu by pressing the right mouse button: Yes
Accessing the "Crosshair tool" by pressing the middle mouse button: Yes
Scrolling the chart horizontally using the left mouse button: Yes
Sending messages about mouse wheel events to all mql5 programs on a chart: No
Send notifications of mouse move and mouse click events to all mql5 programs on a chart: No
Send a notification of an event of new object creation to all mql5-programs on a chart: No
Send a notification of an event of object deletion to all mql5-programs on a chart: No
Chart type: Display as Japanese candlesticks
Price chart in the foreground: No
Price chart indent from the right border: Yes
Automatic moving to the right border of the chart: Yes
Managing the chart using a keyboard: Yes
Allowed to intercept Space and Enter key presses on the chart to activate the quick navigation bar: Yes
Scale: 2
Fixed scale mode: No
Scale 1:1 mode: No
Scale to be specified in points per bar: No
Display a symbol ticker in the upper left corner: Yes
Display OHLC values in the upper left corner: Yes
Display Bid values as a horizontal line in a chart: Yes
Display Ask values as a horizontal line in a chart: Yes
Display Last values as a horizontal line in a chart: No
Display vertical separators between adjacent periods: No
Display grid in the chart: No
Display volume in the chart: Trade volumes
Display textual descriptions of objects: Yes
The number of bars on the chart that can be displayed: 137
The total number of chart windows, including indicator subwindows: 2
Chart window handle: 920114
Number of the first visible bar in the chart: 136
Chart width in bars: 168
Chart width in pixels: 670
 Main chart window:
 - Chart height in pixels: 293
 Chart subwindow 1:
 - The distance between the upper frame of the indicator subwindow and the upper frame of the main chart window: 295
 - Chart height in pixels: 21
Chart background color: clrWhite
Color of axes, scales and OHLC line: clrBlack
Grid color: clrSilver
Color of volumes and position opening levels: clrGreen
Color for the up bar, shadows and body borders of bull candlesticks: clrBlack
Color for the down bar, shadows and body borders of bear candlesticks: clrBlack
Line chart color and color of "Doji" Japanese candlesticks: clrBlack
Body color of a bull candlestick: clrWhite
Body color of a bear candlestick: clrBlack
Bid price level color: clrLightSkyBlue
Ask price level color: clrCoral
Line color of the last executed deal price (Last): clrSilver
Color of stop order levels (Stop Loss and Take Profit): clrOrangeRed
Displaying trade levels in the chart (levels of open positions, Stop Loss, Take Profit and pending orders): Yes
Permission to drag trading levels on a chart with a mouse: Yes
Showing the time scale on a chart: Yes
Showing the price scale on a chart: Yes
Showing the "One click trading" panel on a chart: No
Chart window is maximized: Yes
Chart window is minimized: No
The chart window is docked: Yes
The left coordinate of the undocked chart window relative to the virtual screen: 2028
The top coordinate of the undocked chart window relative to the virtual screen: 100
The right coordinate of the undocked chart window relative to the virtual screen: 2654
The bottom coordinate of the undocked chart window relative to the virtual screen: 329
------
The size of the zero bar indent from the right border in percents: 18.93
Chart fixed position from the left border in percent value: 0.00
Fixed  chart maximum: 1.21320
Fixed  chart minimum : 1.16950
Scale in points per bar: 1.00
Chart minimum: 1.16950
Chart maximum: 1.21320
------
Text of a comment in a chart: ""
The name of the Expert Advisor running on the chart: "TestDoEasyPart69"
The name of the script running on the chart: ""
Indicators in the main chart window:
- Indicator Fractals
Indicators in the chart window 1:
- Indicator DeM(14)
- Indicator AMA(14,2,30)
Symbol: "EURUSD"
============= End of the parameter list (Main chart window EURUSD H4) =============
Fügen Sie zunächst mehrere Charts hinzu und entfernen Sie diese anschließend. Die Chart-Kommentare spiegeln die laufenden Änderungen in der Anzahl der Chart-Objekte innerhalb der Kollektion, die Anzahl der im Terminal geöffneten Charts und die Differenz zwischen der Anzahl der Charts und Objekte wider:
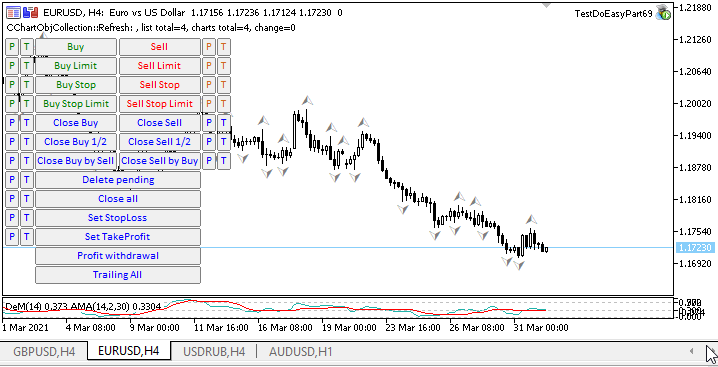
Was kommt als Nächstes?
Im nächsten Artikel werde ich die Funktionalität der Chart-Objekt-Kollektion weiter ausbauen.
Alle Dateien der aktuellen Version der Bibliothek sind unten zusammen mit der Test-EA-Datei für MQL5 zum Testen und Herunterladen angehängt.
Ihre Fragen und Vorschläge schreiben Sie bitte in den Kommentarteil.
*Frühere Artikel dieser Serie:
Andere Klassen in der Bibliothek DoEasy (Teil 67): Objektklasse der Charts
Andere Klassen in der Bibliothek DoEasy (Teil 68): Die Chartfenster-Objektklasse und die Indikator-Objektklassen im Chartfenster
Übersetzt aus dem Russischen von MetaQuotes Ltd.
Originalartikel: https://www.mql5.com/ru/articles/9260
Warnung: Alle Rechte sind von MetaQuotes Ltd. vorbehalten. Kopieren oder Vervielfältigen untersagt.
Dieser Artikel wurde von einem Nutzer der Website verfasst und gibt dessen persönliche Meinung wieder. MetaQuotes Ltd übernimmt keine Verantwortung für die Richtigkeit der dargestellten Informationen oder für Folgen, die sich aus der Anwendung der beschriebenen Lösungen, Strategien oder Empfehlungen ergeben.

 MVC-Entwurfsmuster und seine mögliche Anwendung
 Neuronale Netzwerke leicht gemacht (Teil 13): Batch-Normalisierung
- Freie Handelsapplikationen
- Über 8.000 Signale zum Kopieren
- Wirtschaftsnachrichten für die Lage an den Finanzmärkte
Sie stimmen der Website-Richtlinie und den Nutzungsbedingungen zu.