
マーケットプロファイルインジケーター

内容
マーケットプロファイルとは
マーケットプロファイルの概念は、1980年代にピーター・スタイドルマイヤー(Peter Steidlmayer)がシカゴ・マーカンタイル取引所で開発しました。この手法を使うトレーダーは、市場を深く理解し、取引効率を向上させる上で非常に有用であることを認めています。
マーケットプロファイルは従来のテクニカル指標とは異なり、直接的な売買シグナルを提供するものではありません。しかし、取引システムを補完し、データを整理して市場を誰が支配しているか、公正価値はどこか、価格変動に影響を与える要因は何かを判断することが可能になります。
マーケットプロファイルは、時間、価格、出来高に基づいた取引の組織化を反映します。毎日、買い手と売り手のバランスを表す価格帯によってレンジが形成されます。この価格帯内で価格は変動し、マーケットプロファイルはトレーダーが取引中および取引後にこれらの変化を解釈するのに役立ちます。マーケットプロファイルは正規分布曲線に基づいてプロットされ、価値の約70%が平均値の1標準偏差内に収まります。言い換えれば、特定の価格レベルでの出来高や価格が滞在した時間の分布を示す分析ツールであり、大口取引の発生場所や主要な需給レベルを把握するのに役立ちます。
マーケットプロファイルを使うには、市場の動きに基づきチャート上に直接または間接的に表示されるいくつかの概念を理解する必要があります。分析に推奨される時間足はM30です。
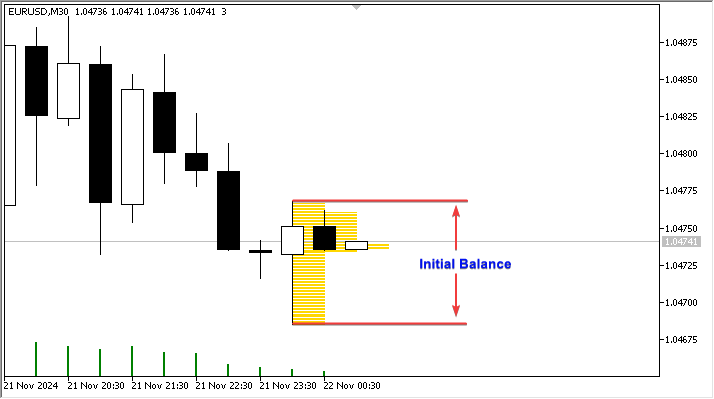
取引日の最初の1時間は、その日の取引パターンを形成し、セッション全体での市場参加者の動きを研究する基礎となります。この時間帯は、買い手と売り手が合意して取引を成立させる価格を見つけるために、市場参加者が何をしているかを判断する上で重要です。
市場参加者には2つのカテゴリがあります。
- 日中取引トレーダー:1日の中で大きな出来高の複数ティック単位で取引するトレーダー
- 他時間足トレーダー:別の時間足で取引し、価格を新しいレベルに動かすトレーダー
マーケットプロファイルをよりよく理解するために、基本的な概念をいくつか見てみましょう。
- 初期レンジ:取引セッションの最初の1時間における市場価格のレンジ(セッション開始後の30分バー2本)
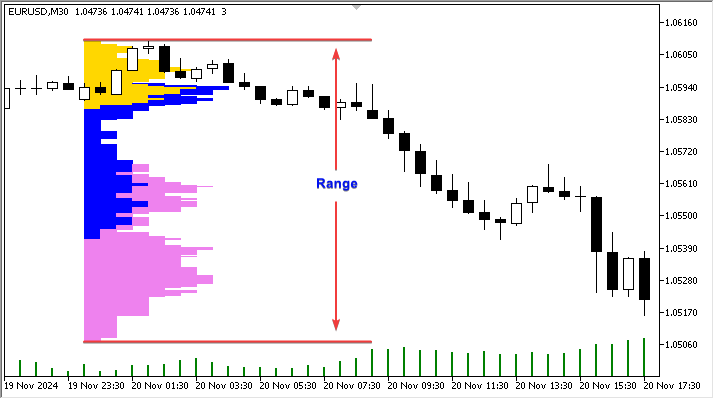
- 範囲:マーケットプロファイル全体の幅、絶対的な高さ。
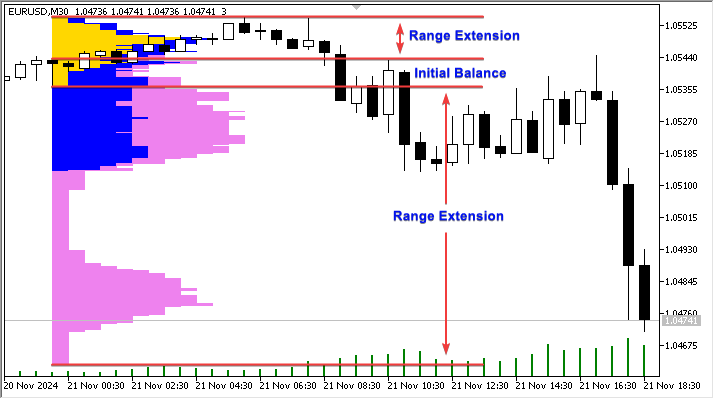
- レンジ拡張:初期レンジから価格が動いたときのレンジの拡大。
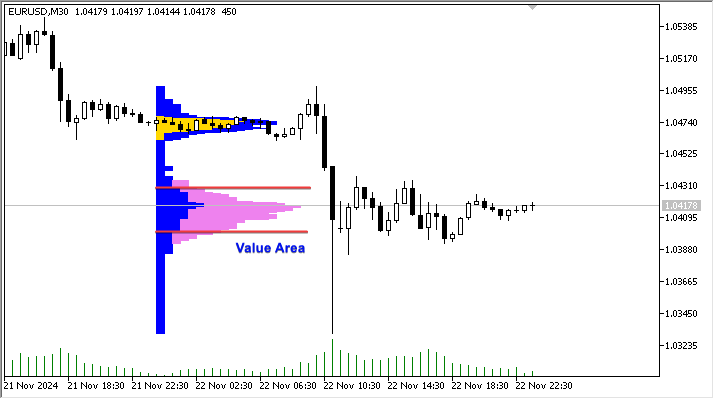
- バリューエリア:価値ゾーン、取引活動の70%を含む価格帯。
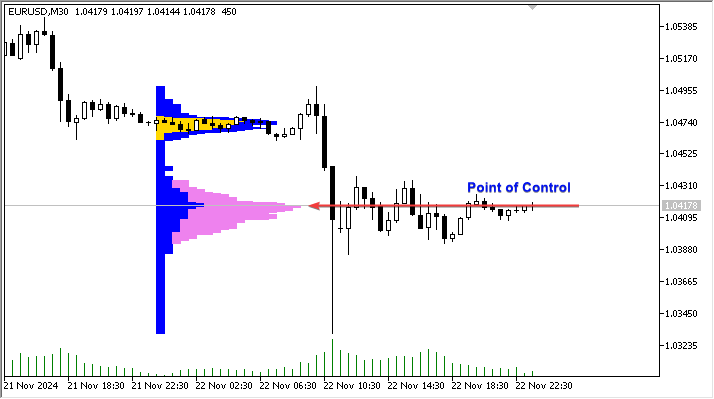
- コントロールポイント(POC):プロファイルラインの中で最も長く、レンジの中心に最も近いライン。
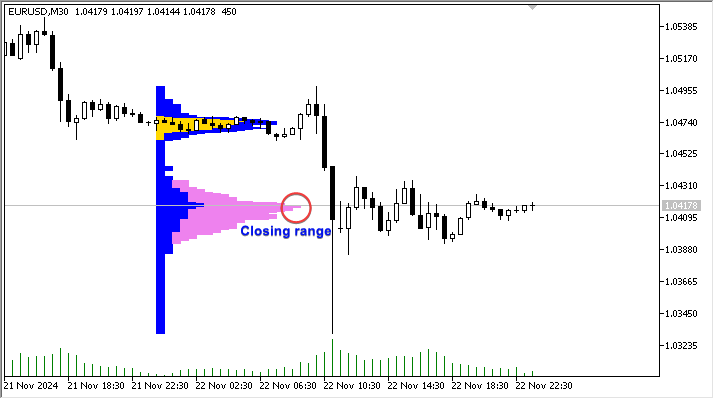
- クローズレンジ:取引セッション終了付近に位置するレンジ。
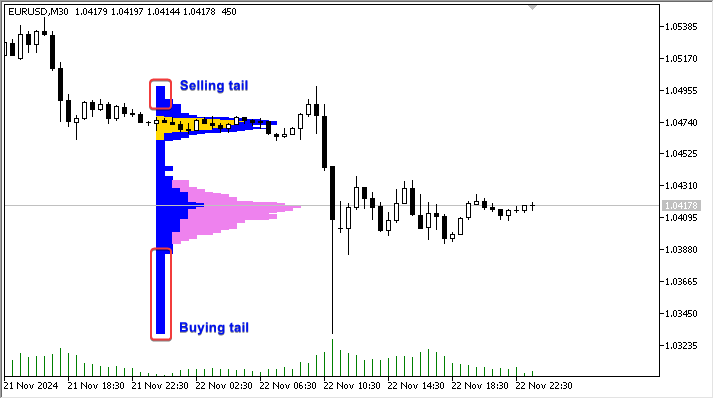
- 買い/売りのテール:このようなテールの存在は、「他時間足トレーダー」の活動が急増していることを示します。
テールが短い場合は、買い手・売り手の双方において「他時間足トレーダー」の十分な攻撃性があることを意味します。
マーケットプロファイルを読むには、次の基本原則に従います。
- 価格と出来高の把握
マーケットプロファイルは、最も出来高が多かった価格レベルを表示します。チャート上のラインやブロック(通常は水平)は、価格が特定のレベルに滞在した時間や取引された出来高を示しています。ラインが長いほど、滞在時間や出来高が多く、これらは重要なサポート・レジスタンスレベルになります。 - コントロールポイント(POC)
期間中に最大の取引量があった価格レベルです。市場参加者にとって最も「受け入れられやすい」価格であるため、強いサポートやレジスタンスとして機能することが多いです。 - 適正価格帯と非適正価格帯(バリューエリアと非バリューエリア)
- バリューエリア:通常、期間中の取引量の約70%を占める価格帯。供給と需要のバランスが最も取れていたレンジです。
- 非バリューエリア:バリューエリアの上下にあるレベルは、関心が低いゾーンと見なされます。価格がここに到達すると、すぐにバリューエリアに戻ることもあれば、供給と需要のアンバランスによって新しい価格帯に移動し続けることもあります。
- トレンドとレンジの検出
- トレンド日:市場が上昇または下降に安定して動くと、マーケットプロファイルは一方向に「拡張」します。この場合、価格は各レベルにとどまらず、推移しながら新しい関心領域を形成します。トレンド日の初期レンジは1日のレンジ全体の25%未満であり、買い手または売り手の優位が顕著です。実際、このときはどちらか一方向に大幅なレンジ拡大が見られます。
- レンジ日:プロファイルは特定のレベル周辺に集中し、バリューエリアは狭いままです。これは市場が均衡しており、強いトレンドが存在しないことを示します。
- 非トレンド日:狭い初期レンジが、その後1日の価格レンジ全体を包含します。
- 通常日:広い初期レンジが、1日のレンジの約80%に相当します。これは最も一般的な取引日のタイプです。
- 通常日の通常の変化:初期レンジは1日のレンジの約50%に相当します。この場合、レンジの拡張がいずれか一方向に形成されます。
- 中立的な日:初期レンジでは特徴付けられず、レンジ拡張が両方向に起こり、1日の終値はレンジの中心付近で終了します。
- トレンド日:市場が上昇または下降に安定して動くと、マーケットプロファイルは一方向に「拡張」します。この場合、価格は各レベルにとどまらず、推移しながら新しい関心領域を形成します。トレンド日の初期レンジは1日のレンジ全体の25%未満であり、買い手または売り手の優位が顕著です。実際、このときはどちらか一方向に大幅なレンジ拡大が見られます。
- 極値と価格反応の理解
- 価格が低出来高で新しいレベルに到達し、すぐにPOCやバリューエリアに戻る場合、反発の可能性を示します。
- 価格がバリューエリア外で継続的に取引され、新しいPOCを形成する場合、新しいトレンドの始まりを示唆します。
- マーケットプロファイルの実践
- エントリポイントの特定:POCやバリューエリアの境界を使ってサポート・レジスタンスを特定し、プルバックやトレンド方向へのブレイクアウトを狙います。
- 損切りと目標の設定:POCやバリューエリアの高値・安値を保護ストップや利食いの目安として使用します。
古典的なマーケットプロファイルはTPOs (Time-Price Opportunities)に基づいており、ラテンアルファベットの大文字で表されます。各文字は取引セッションの30分を表します。
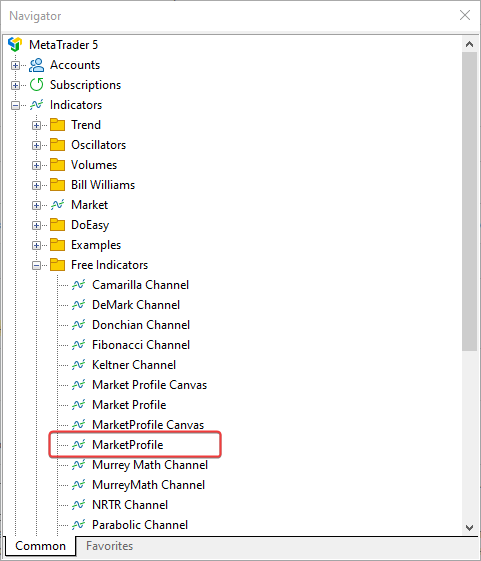
MetaTrader 5端末でのマーケットプロファイル
MetaTrader 5クライアント端末では、\MQL5\Indicators\Free Indicators\ディレクトリにシンプルなマーケットプロファイルが用意されています。そのコードはMarketProfile.mq5にあります。このインジケーターは、従来の古典的なマーケットプロファイルとは異なり、セッションごと(アジア、ヨーロッパ、アメリカ)の縦型出来高プロファイルを作成し、価格がより多くの時間滞在したゾーンを可視化します。インジケーターは日中のバーを分析し、異なる市場セッションを反映する3つの時間帯に分けます。そして、各セッションにおける各価格レベルでの滞在時間を計算し、チャート上に矩形として表示します。
このインジケーターを読むためのポイント
- 取引セッションの分割
- 1日全体は、アジア、ヨーロッパ、アメリカの3つのセッションに分かれています。
- チャート上の色分けされたゾーンは、それぞれのセッションにおける価格レベルでの滞在時間を示しています。
- 価格レベル
- 各価格レベルは、セッションごとに色分けされ、価格がそのレベルに滞在した時間の長さで表示されます。価格が長く滞在したレベルは、活発な取引があった重要なレベルと見なされます。
- POC(コントロールポイント)
- このインジケーターはPOCを直接計算しませんが、色分けゾーンの最も長いレベルを視覚的にハイライトすることで、供給と需要の重要なレベルを示すコントロールポイントとして捉えることができます。
- バリューエリア
- 標準的なマーケットプロファイルと同様に、出来高が集中していたエリア(価格の滞在時間が長いゾーン)は、価格が再び戻る可能性のあるレベルとして捉えられます。
したがって、このコードのマーケットプロファイルインジケーターは、1日の主要な取引活動がどの価格レベルに集中していたかを理解し、各取引セッションのサポートおよびレジスタンスレベルを把握するのに役立ちます。
インジケーターの動作を確認してみましょう。
構造と原則
このインジケーターの入力パラメータには以下が含まれます。
- 表示するプロファイルの日数
- 現在の日に最も近い日のインデックス
- 0:当日
- 1:前日
- 2:前々日、など
- 各セッションの表示色(アジア、ヨーロッパ、アメリカ)
- ヨーロッパおよびアメリカのセッション開始時刻(アジアセッションは当日開始時刻に開く)
- ヒストグラムセグメントの長さの倍率
//--- input parameters
input uint  InpStartDate       =0;           /* day number to start calculation */  // 0 - current, 1 - previous, etc.
input uint  InpShowDays        =3;           /* number of days to display */        // starting with and including the day in InpStartDate
input int   InpMultiplier      =1;           /* histogram length multiplier */
input color InpAsiaSession     =clrGold;     /* Asian session */
input color InpEuropeSession   =clrBlue;     /* European session */
input color InpAmericaSession  =clrViolet;   /* American session */
input uint  InpEuropeStartHour =8;           /* European session opening hour */
input uint  InpAmericaStartHour=14;          /* American session opening hour */
インジケーターの初期化時には、システム起動から経過したミリ秒数の下4桁を使って、オブジェクト名の一意のIDを作成します。
//+------------------------------------------------------------------+
//| Custom indicator initialization function                         |
//+------------------------------------------------------------------+
int OnInit()
  {
//--- create a prefix for object names
   string number=StringFormat("%I64d", GetTickCount64());
   ExtPrefixUniq=StringSubstr(number, StringLen(number)-4);
   Print("Indicator \"Market Profile\" started, prefix=", ExtPrefixUniq);

   return(INIT_SUCCEEDED);
  }
この番号は、インジケーターのグラフィカルオブジェクト名を作成する際に使用され、初期化解除の際には同じプレフィックスを使ってオブジェクトが削除されます。
//+------------------------------------------------------------------+
//| Custom indicator deinitialization function                       |
//+------------------------------------------------------------------+
void OnDeinit(const int reason)
  {
//--- after use, delete all graphical objects created by the indicator
   Print("Indicator \"Market Profile\" stopped, delete all objects with prefix=", ExtPrefixUniq);
   ObjectsDeleteAll(0, ExtPrefixUniq, 0, OBJ_RECTANGLE);
   ChartRedraw(0);
  }
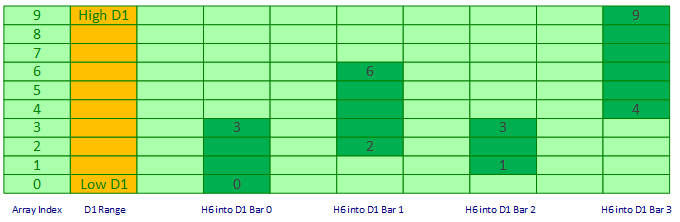
では、このインジケーターはどのように動作するのでしょうか。描画のロジックはどのようになっているのでしょうか。日足の安値から高値までの全体のサイズをテーブルのサイズと仮定します。すると、テーブルの行は価格レベルに対応します。各価格ポイントがテーブルの1行となります。テーブルの列は、最も単純なバージョンでは日中のバー間の距離を表します。インデックス0の行は最も低い価格で、バーの安値に等しいです。インデックス1の価格は、バーの安値に1ポイントを足した価格です。したがって、バーの高値を定義する行は、バーの安値のインデックスに安値から高値までのポイント数を加えた行となります。
このテーブルの行に対応するシンプルな配列を作成すると、そのインデックス0には、1日の価格変動の中でバーの安値価格に到達した回数が格納されます。同様に、配列の他のセルには、それぞれの価格レベルに価格が到達した回数が格納されます。
では、これをどうやって計算するのでしょうか。非常に簡単です。当日開始時の日中足の安値が配列のインデックス0となるので、他のすべての日中足のインデックスは計算可能です。開始バーの次のバーに対応する行のインデックスは、そのバーの安値から当日開始バーの安値を引いたポイント数となります。このバーの最後のインデックスは、そのバーの高値から当日開始バーの安値を引いた値です。
下図は、6時間の4本の日中足(Bar0、Bar1、Bar2、Bar3)の配列における開始インデックスと終了インデックスを示しています。
この配列に、各価格レベルに滞在したバーの数をマークし、マーケットプロファイルの矩形を描画すると、配列上およびチャート上で次のようなイメージが得られます。
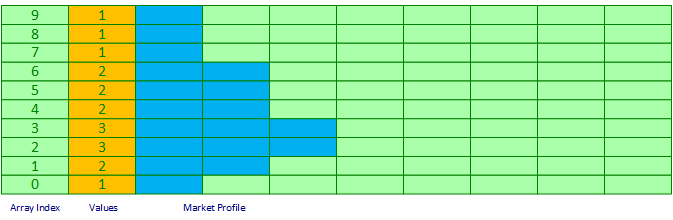
配列は新しいティックごとにクリアされ、日足バーの新しいレンジサイズが設定されます。そして、各価格レベルに滞在したバーの数の値でインデックスが再度埋められます。このようにして、マーケットプロファイルは動的に更新され、チャート上に市場の最新の状態が表示されます。価格があるレベルに長く滞在するほど(そのレベルを含むバーの数が多いほど)、そのレベルを示すラインも長く表示されます。
次に、このロジックがインジケーターのコード内でどのように実装されているかを見てみましょう。
//+------------------------------------------------------------------+
//| Custom indicator iteration function                              |
//+------------------------------------------------------------------+
int OnCalculate(const int rates_total,
                const int prev_calculated,
                const datetime &time[],
                const double &open[],
                const double &high[],
                const double &low[],
                const double &close[],
                const long &tick_volume[],
                const long &volume[],
                const int &spread[])
  {
//--- opening time of the current daily bar
   datetime static open_time=0;

//--- number of the last day for calculations
//--- (if InpStartDate = 0 and InpShowDays = 3, lastday = 3)
//--- (if InpStartDate = 1 and InpShowDays = 3, lastday = 4) etc ...
   uint lastday=InpStartDate+InpShowDays;

//--- if the first calculation has already been made
   if(prev_calculated!=0)
     {
      //--- get the opening time of the current daily bar
      datetime current_open=iTime(Symbol(), PERIOD_D1, 0);

      //--- if we do not calculate the current day
      if(InpStartDate!=0)
        {
         //--- if the opening time was not received, leave
         if(current_open==open_time)
            return(rates_total);
        }
      //--- update opening time
      open_time=current_open;
      //--- we will only calculate one day from now on, since all other days have already been calculated during the first run
      lastday=InpStartDate+1;
     }

//--- in a loop for the specified number of days (either InpStartDate+InpShowDays on first run, or InpStartDate+1 on each tick)
   for(uint day=InpStartDate; day<lastday; day++)
     {
      //--- get the data of the day with index day into the structure
      MqlRates day_rate[];
      //--- if the indicator is launched on weekends or holidays when there are no ticks, you should first open the daily chart of the symbol
      //--- if we have not received bar data for the day index of the daily period, we leave until the next call to OnCalculate()
      if(CopyRates(Symbol(), PERIOD_D1, day, 1, day_rate)==-1)
         return(prev_calculated);

      //--- get daily range (Range) in points
      double high_day=day_rate[0].high;
      double low_day=day_rate[0].low;
      double point=SymbolInfoDouble(Symbol(), SYMBOL_POINT);
      int    day_size=(int)((high_day-low_day)/point);

      //--- prepare arrays for storing price level rectangles
      int boxes_asia[], boxes_europe[], boxes_america[];
      //--- array sizes equal to the number of points in the day range
      ArrayResize(boxes_asia, day_size);
      ArrayResize(boxes_europe, day_size);
      ArrayResize(boxes_america, day_size);
      //--- zero out the arrays
      ZeroMemory(boxes_asia);
      ZeroMemory(boxes_europe);
      ZeroMemory(boxes_america);

      //--- get all intraday bars of the current day
      MqlRates bars_in_day[];
      datetime start_time=day_rate[0].time+PeriodSeconds(PERIOD_D1)-1;
      datetime stop_time=day_rate[0].time;
      //--- if the indicator is launched on weekends or holidays when there are no ticks, you should first open the daily chart of the symbol
      //--- if it was not possible to get the bars of the current timeframe for the specified day, leave until the next call of OnCalculate()
      if(CopyRates(Symbol(), PERIOD_CURRENT, start_time, stop_time, bars_in_day)==-1)
         return(prev_calculated);

      //--- we go through all the bars of the current day in a loop and mark the price cells that the bars fall into
      int size=ArraySize(bars_in_day);
      for(int i=0; i<size; i++)
        {
         //--- calculate the range of price level indices in the daily range
         int         start_box=(int)((bars_in_day[i].low-low_day)/point);  // index of the first cell of the price array corresponding to the Low price of the current i bar
         int         stop_box =(int)((bars_in_day[i].high-low_day)/point); // index of the last cell of the price array corresponding to the High price of the current i bar

         //--- get the bar hour by the loop index
         MqlDateTime bar_time;
         TimeToStruct(bars_in_day[i].time, bar_time);
         uint        hour=bar_time.hour;

         //--- determine which session the bar belongs to by the bar hour
         //--- American session
         if(hour>=InpAmericaStartHour)
           {
            //--- in the American session array, in cells from start_box to stop_box, increase the bar counters
            for(int ind=start_box; ind<stop_box; ind++)
               boxes_america[ind]++;
           }
         //--- Europe or Asia
         else
           {
            //--- European session
            if(hour>=InpEuropeStartHour && hour<InpAmericaStartHour)
               //--- in the European session array, in cells from start_box to stop_box, increase the bar counters
               for(int ind=start_box; ind<stop_box; ind++)
                  boxes_europe[ind]++;
            //--- Asian session
            else
               //--- in the Asian session array, in cells from start_box to stop_box, increase the bar counters
               for(int ind=start_box; ind<stop_box; ind++)
                  boxes_asia[ind]++;
           }
        }

      //--- draw a market profile based on the created arrays of price levels
      //---  market profile on the chart is drawn with segments of colored lines using the color specified in the settings for each trading session
      //--- segments are drawn as rectangle objects with the height of the rectangle equal to one price point and the width equal to the distance to the next bar to the right

      //--- define the day for the name of the graphical object and the width of the rectangle
      string day_prefix=TimeToString(day_rate[0].time, TIME_DATE);
      int    box_length=PeriodSeconds(PERIOD_CURRENT);

      //--- Asian session
      //--- in a loop by the number of points of the daily bar
      for(int ind=0; ind<day_size; ind++)
        {
         //--- if the Asian session array is full
         if(boxes_asia[ind]>0)
           {
            //--- get the next price by adding the number of 'ind' points to the Low price of the daily bar
            //--- get the start time of the segment (opening time of the daily bar)
            //--- and the end time of the segment (opening time of the daily bar + the number of bars stored in the 'ind' cell of the boxes_asia[] array)
            double   price=low_day+ind*point;
            datetime time1=day_rate[0].time;
            datetime time2=time1+boxes_asia[ind]*box_length*InpMultiplier;
            //--- create a prefix for the name of the Asian session graphical object
            string   prefix=ExtPrefixUniq+"_"+day_prefix+"_Asia_"+StringFormat("%.5f", price);

            //--- draw a rectangle (line segment) at the calculated coordinates with the color for the Asian session
            DrawBox(prefix, price, time1, time2, InpAsiaSession);
           }
        }

      //--- European session
      for(int ind=0; ind<day_size; ind++)
        {
         //--- if the European session array is full
         if(boxes_europe[ind]>0)
           {
            //--- get the next price by adding the number of 'ind' points to the Low price of the daily bar
            //--- get the start time of the segment (opening time of the daily bar + time of the right edge of the Asian session profile)
            //--- and the end time of the segment (start time of the European session segment + the number of bars stored in the 'ind' cell of the boxes_europe[] array)
            double   price=low_day+ind*point;
            datetime time1=day_rate[0].time+boxes_asia[ind]*box_length*InpMultiplier;
            datetime time2=time1+boxes_europe[ind]*box_length*InpMultiplier;
            //--- create a prefix for the name of the graphical object of the European session
            string   prefix=ExtPrefixUniq+"_"+day_prefix+"_Europe_"+StringFormat("%.5f", price);

            //--- draw a rectangle (line segment) at the calculated coordinates with the color for the European session
            DrawBox(prefix, price, time1, time2, InpEuropeSession);
           }
        }

      //--- American session
      for(int ind=0; ind<day_size; ind++)
        {
         //--- if the American session array is full
         if(boxes_america[ind]>0)
           {
            //--- get the next price by adding the number of 'ind' points to the Low price of the daily bar
            //--- get the start time of the segment (opening time of the daily bar + time of the right edge of the Asian session profile + time of the right edge of the European session profile)
            //--- and the end time of the segment (start time of the American session segment + the number of bars stored in the 'ind' cell of the boxes_america[] array)
            double   price=low_day+ind*point;
            datetime time1=day_rate[0].time+(boxes_asia[ind]+boxes_europe[ind])*box_length*InpMultiplier;
            datetime time2=time1+boxes_america[ind]*box_length*InpMultiplier;
            //--- create a prefix for the name of the American session graphical object
            string   prefix=ExtPrefixUniq+"_"+day_prefix+"_America_"+StringFormat("%.5f", price);

            //--- draw a rectangle (line segment) at the calculated coordinates with the color for the American session
            DrawBox(prefix, price, time1, time2, InpAmericaSession);
           }
        }
     }

//--- when the loop is complete, redraw the chart
   ChartRedraw(0);

//--- return the number of bars for the next OnCalculate call
   return(rates_total);
  }
コードには十分なコメントが付けられています。このインジケーターは、複数の日のプロファイルを同時に描画することが可能です。表示する日数に応じて、すべてループで描画されます。
メインアルゴリズム
上記コードのアルゴリズムをもう少し詳しく見てみましょう。日ごとの描画は以下のようにおこなわれます。
- インジケーターが動作しているチャートの時間足に応じて、表示されている日付に含まれるバーを取得します。
MqlRates day_rate[];
if(CopyRates(Symbol(), PERIOD_D1, day, 1, day_rate)==-1)
   return(prev_calculated);

MqlRates bars_in_day[];
datetime start_time=day_rate[0].time+PeriodSeconds(PERIOD_D1)-1;
datetime stop_time=day_rate[0].time;

if(CopyRates(Symbol(), PERIOD_CURRENT, start_time, stop_time, bars_in_day)==-1)
   return(prev_calculated);
- 日中足の数に応じてループ処理をおこないます。
int size=ArraySize(bars_in_day);
for(int i=0; i<size; i++)
- ループ内で選択された現在のバーについて、日足バー内でそのバーが位置する価格レンジの開始インデックスと終了インデックスを計算します。
int         start_box=(int)((bars_in_day[i].low-low_day)/point);  // index of the first cell of the price array corresponding to the Low price of the current i bar
int         stop_box =(int)((bars_in_day[i].high-low_day)/point); // index of the last cell of the price array corresponding to the High price of the current i bar
- 次に、ループ内で選択されたバーが属するセッションを判定し、対応する配列の中で、その日中足の価格レンジに含まれるすべてのセルのバーカウンタを増加させます。
MqlDateTime bar_time;
TimeToStruct(bars_in_day[i].time, bar_time);
uint        hour=bar_time.hour;

if(hour>=InpAmericaStartHour)
  {
   for(int ind=start_box; ind<stop_box; ind++)
      boxes_america[ind]++;
  }
else
  {
   if(hour>=InpEuropeStartHour && hour<InpAmericaStartHour)
      for(int ind=start_box; ind<stop_box; ind++)
         boxes_europe[ind]++;
   else
      for(int ind=start_box; ind<stop_box; ind++)
         boxes_asia[ind]++;
   }
- すべての日中足をループ処理した後、各セッション配列のセルには、その価格に到達したバーの数が記録されます。すべてのセッション配列は同じサイズを持ち、日足ローソク足の安値から高値までの価格ポイントの数に等しくなりますが、各配列はそのセッションで到達した価格レベルに応じて埋められます。
- 次に、すべての埋められたセッション配列をループ処理し、計算された座標に従ってチャート上にグラフィカルオブジェクトを表示します。
for(int ind=0; ind<day_size; ind++)
  {
   if(boxes_asia[ind]>0)
     {
      double   price=low_day+ind*point;
      datetime time1=day_rate[0].time;
      datetime time2=time1+boxes_asia[ind]*box_length*InpMultiplier;
      string   prefix=ExtPrefixUniq+"_"+day_prefix+"_Asia_"+StringFormat("%.5f", price);
      DrawBox(prefix, price, time1, time2, InpAsiaSession);
     }
  }

for(int ind=0; ind<day_size; ind++)
  {
   if(boxes_europe[ind]>0)
     {
      double   price=low_day+ind*point;
      datetime time1=day_rate[0].time+boxes_asia[ind]*box_length*InpMultiplier;
      datetime time2=time1+boxes_europe[ind]*box_length*InpMultiplier;
      string   prefix=ExtPrefixUniq+"_"+day_prefix+"_Europe_"+StringFormat("%.5f", price);
      DrawBox(prefix, price, time1, time2, InpEuropeSession);
     }
  }

for(int ind=0; ind<day_size; ind++)
  {
   if(boxes_america[ind]>0)
     {
      double   price=low_day+ind*point;
      datetime time1=day_rate[0].time+(boxes_asia[ind]+boxes_europe[ind])*box_length*InpMultiplier;
      datetime time2=time1+boxes_america[ind]*box_length*InpMultiplier;
      string   prefix=ExtPrefixUniq+"_"+day_prefix+"_America_"+StringFormat("%.5f", price);
      DrawBox(prefix, price, time1, time2, InpAmericaSession);
     }
  }
- その結果、チャートには1日分のマーケットプロファイルが表示されます。
以下は、ラインセグメントを描画する関数です。
//+------------------------------------------------------------------+
//| Draw color box                                                   |
//+------------------------------------------------------------------+
void DrawBox(string bar_prefix, double price, datetime time1, datetime time2, color clr)
  {
   ObjectCreate(0, bar_prefix, OBJ_RECTANGLE, 0, time1, price, time2, price);
   ObjectSetInteger(0, bar_prefix, OBJPROP_COLOR, clr);
   ObjectSetInteger(0, bar_prefix, OBJPROP_STYLE, STYLE_SOLID);
   ObjectSetInteger(0, bar_prefix, OBJPROP_WIDTH, 1);
   ObjectSetString(0, bar_prefix, OBJPROP_TOOLTIP, "\n");
   ObjectSetInteger(0, bar_prefix, OBJPROP_BACK, true);
  }
セグメントはグラフィカルオブジェクトである矩形を使って描画されます(「左方向への光線」と「右方向への光線」のプロパティを無効にすることで、トレンドラインで描画することも可能です)。関数は矩形の座標を、開始時刻と終了時刻、および矩形の両端で共通の価格として受け取ります。これにより、入力で指定された色の通常のラインが描画されます。
EURUSDのM30チャートでインジケーターを実行すると、マーケットプロファイルは次のように表示されます。
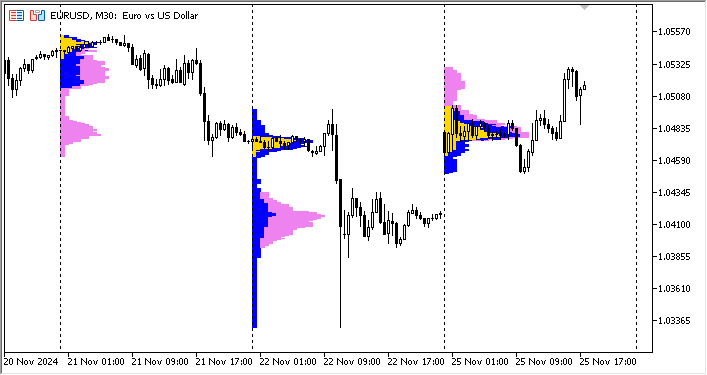
過去の各日(その日のコントロールポイント)からラインを引くと、「適正価格」のレベルがはっきりと見えます。これらはサポートやレジスタンスレベル、あるいは価格の吸引点として機能することもあります(当日のギャップは前日のPOCにより埋められる可能性が高いです)。
結論
マーケットプロファイルを学ぶことで、市場の動向をより深く理解し、重要な価格レベルを特定し、効率的なエントリーおよびエグジットポイントを見つけることができます。マーケットプロファイルはティックチャートとは異なり、価格・出来高・時間をひと目でわかる形にまとめています。これにより、価格の均衡レベルを特定し、現在市場を誰が支配しているかを分析することができます。この情報は、トレーダーの適正価格評価の変化に応じて取引判断を調整する際に有利に働きます。
MetaTrader 5クライアント端末に付属するマーケットプロファイルインジケーターに触れることで、その動作のシンプルさ、構築ロジックを理解し、提供されている形式で市場状況を評価するだけでなく、このインジケーターを基により高度で複雑なものを作成することも可能です。
より深く理解し、他の概念と比較するためには、mql5.comに掲載されているマーケットプロファイルに関する他の資料も参照できます。
- プライスヒストグラム(マーケットプロファイル)とMQL5への導入
- Market Profile:MetaTrader 4用インジケーター
- MarketProfile:MetaTrader 4用インジケーター
- MarketProfile:MetaTrader 5用インジケーター
この記事で検討されているインジケーターの完全にコメントされたコードは、ダウンロードして研究できるように以下に添付されています。
MetaQuotes Ltdによってロシア語から翻訳されました。
元の記事: https://www.mql5.com/ru/articles/16461
警告: これらの資料についてのすべての権利はMetaQuotes Ltd.が保有しています。これらの資料の全部または一部の複製や再プリントは禁じられています。
この記事はサイトのユーザーによって執筆されたものであり、著者の個人的な見解を反映しています。MetaQuotes Ltdは、提示された情報の正確性や、記載されているソリューション、戦略、または推奨事項の使用によって生じたいかなる結果についても責任を負いません。

- 無料取引アプリ
- 8千を超えるシグナルをコピー
- 金融ニュースで金融マーケットを探索
インジケータは良く、トレーダーにとって非常に有用です、
しかし、コンパイル後、エラーは出ません、
しかし、mt5のチャートに適用した後、mt5がハングアップし、閉じる必要があります。
この問題を解決してください。
はい、計算アルゴリズムは同じです。
このインジケータは、トレーダーにとって非常に便利で良いものです、
しかし、コンパイル後、エラーは出ません、
しかし、mt5のチャートに適用した後、mt5がハングアップし、閉じる必要があり、ウィンドウが反応しません。
この問題を解決してください。
このインジケーターは優れており、トレーダーにとって非常に有用である、
しかし、コンパイル後にエラーが発生しない、
しかし、mt5のチャートに適用した後、mt5がハングアップし、閉じる必要があり、「not responding」ウィンドウが表示されます。
この問題を解決する
確認しました。どちらのインジケーターもチャート上で問題なく動作しています。
どこで、どのようにインジケーターを動かしているのか、もっとデータが必要です。