
マーケットプロファイルインジケーター(第2回):キャンバス上の最適化と描画

内容
はじめに
前回の記事では、マーケットプロファイルインジケーターについて詳しく説明しました。通常のグラフィカルオブジェクトを使ってマーケットプロファイル図を作成すると、かなりのリソースを消費することが分かりました。具体的には、日足バーの安値から高値までの各価格ポイントが、その日にその価格水準に到達した日中バーの本数に応じて、矩形のグラフィカルオブジェクトで埋められます。これはすべての項目に当てはまり、それぞれ多数のグラフィカルオブジェクトを含み、プロファイル図が描かれる各日に対してこれらのオブジェクトが作成され描画されます。インジケーターが何千ものグラフィカルオブジェクトを作成すると、他のグラフィカルオブジェクトの処理やチャートの再描画において、大幅な遅延が発生する可能性があります。
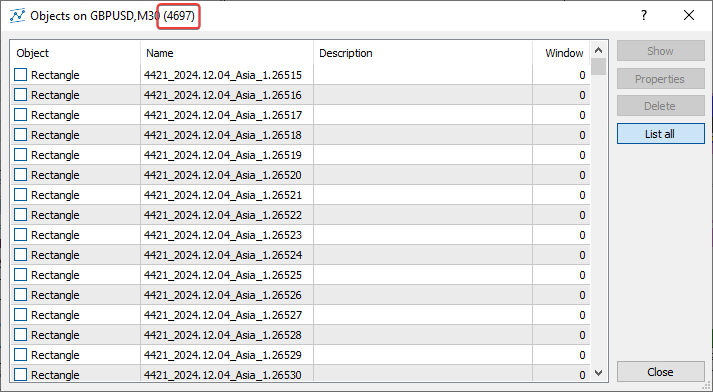
M30チャートでインジケーターを起動し、わずか3日分のマーケットプロファイルを作成した場合:
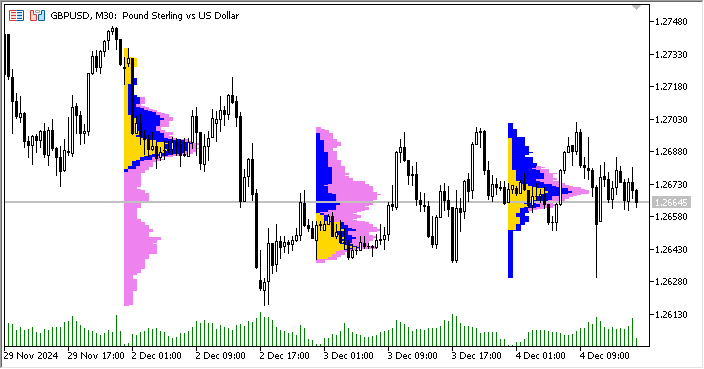
4697個の矩形グラフィックオブジェクトが作成されます。
これは非常に非効率的なリソースの使い方です。設定で表示日数を増やすと、チャート上で各表示日のマーケットプロファイル図を描画するために作成されるオブジェクトの数は劇的に増加します。
しかし、ここでは単にグラフィカルオブジェクト(矩形)を使って図を描いているだけです。プロファイルヒストグラムの短い1本の線分が1つのグラフィカルオブジェクトに相当します。つまり、チャート上に直接描画するのではなく、必要な座標に配置した1つのグラフィカルオブジェクト、すなわちキャンバス上に描くことができるのです。これにより、1日分のデータに対してたった1つのグラフィカルオブジェクトで済みます。3日分なら3つのオブジェクトで済み、4,697個ものオブジェクトを作る必要はありません。この違いは大きいです。この描画方法は、クライアント端末標準ライブラリの一部として提供されるカスタム画像の簡易描画用クラスであるCCanvasを使うことで実現できます。
マーケットプロファイルインジケーターの、プロファイルヒストグラムをキャンバス上に描画するバージョンは、端末内の\MQL5\Indicators\Free Indicators\MarketProfile Canvas.mq5ファイルで利用可能です。コードを見てみると、初期バージョン(MarketProfile.mq5)とは異なり、描画はCCanvasクラスのオブジェクト上でおこなわれていることが分かります。インジケーターのロジック自体は同じであり、前回の記事の「構造と原理」セクションで既に説明した内容と同じです。描画はCMarketProfileクラスを通じておこなわれ、このクラス内でCCanvas上に描画されます。
操作ロジックは非常にシンプルです。
- 指定された日数分のループで処理をおこなう
- ループ内の現在の日付に対応するCMarketProfileクラスのオブジェクトを作成または取得
- その日のプロファイルをキャンバス上に描画または再描画
プロファイル図の描画に関する主な処理はCMarketProfileクラス内でおこなわれます。このクラスの構造と動作を見てみましょう。
CMarketProfileクラス
ファイル「\MQL5\Indicators\Free Indicators\MarketProfile Canvas.mq5」を開き、その中のCMarketProfileクラスのコードを見つけます。どのような内容があるのか確認し、その目的を見ていきましょう。
//+------------------------------------------------------------------+
//| Class to store and draw Market Profile for the daily bar         |
//+------------------------------------------------------------------+
class CMarketProfile
  {
public:
                     CMarketProfile() {};
                     CMarketProfile(string prefix, datetime time1, datetime time2, double high, double low, MqlRates &bars[]);
                    ~CMarketProfile(void);

   //--- checks if the object was created for the specified date
   bool              Check(string prefix, datetime time);
   //--- set high/low and array of intraday bars
   void              SetHiLoBars(double high, double low, MqlRates &bars[]);
   //--- set canvas dimensions and drawing options
   void              UpdateSizes(void);
   //--- is the profile in the visible part of the chart?
   bool              isVisibleOnChart(void);
   //--- has the graph scale changed?
   bool              isChartScaleChanged(void);
   //--- calculates profile by sessions
   bool              CalculateSessions(void);
   //--- draws a profile
   void              Draw(double multiplier=1.0);
   //---
protected:
   CCanvas           m_canvas;      // CCanvas class object for drawing profile
   uchar             m_alpha;       // alpha channel value that sets transparency
   string            m_prefix;      // unique prefix of the OBJ_BITMAP object
   string            m_name;        // name of the OBJ_BITMAP object used in m_canvas
   double            m_high;        // day's High
   double            m_low;         // day's Low
   datetime          m_time1;       // start time of the day
   datetime          m_time2;       // end time of the day
   int               m_day_size_pt; // daily bar height in points
   int               m_height;      // daily bar height in pixels on the chart
   int               m_width;       // daily bar width in pixels on the chart
   MqlRates          m_bars[];      // array of bars of the current timeframe between m_time1 and m_time2
   vector            m_asia;        // array of bar counters for the Asian session
   vector            m_europe;      // array of bar counters for the European session
   vector            m_america;     // array of bar counters for the American session
   double            m_vert_scale;  // vertical scaling factor
   double            m_hor_scale;   // horizontal scaling factor
  };
クラスで宣言されているpublicメソッド
- Check:特定の日に作成されたマーケットプロファイルオブジェクトの存在を確認するために使用されます。
- SetHiLoBars:その日の高値および安値の価格値をマーケットプロファイルオブジェクトに設定し、日中バーの配列をオブジェクトに渡すために使用されます。
- UpdateSizesキャンバスの寸法や、マーケットプロファイルオブジェクト上で矩形を描画するためのスケーリング係数を設定します。
- isVisibleOnChart:マーケットプロファイルがチャートの可視範囲内にあるかどうかを示すフラグを返します。
- isChartScaleChanged:クラスで宣言されていますが、実装されていません。
- CalculateSessions:取引セッションのパラメータを計算し、セッションバーの配列に値を格納します。
- Draw:すべての取引セッションのデータに基づいて、キャンバス上にマーケットプロファイルヒストグラムを描画します。
クラスのprotectedセクションで宣言されている変数の目的は比較的明確です。ここでは特に、セッションバーのカウンタ配列に注目します。
これらはすべてvector型として宣言されており、データ配列として扱うことができます。
ベクトルや行列、あるいはそれらの型に対応した特殊メソッドを使うことで、コードをより簡潔で明瞭に書くことができ、数学的な表記に近づけることができます。行列とベクトルのメソッドを使用すると、計算でネストされたループを作成したり配列で正しいインデックスを作成したりする必要がなくなるため、複雑なプログラムの開発における信頼性と速度が向上します。
宣言されたクラスメソッドの実装を考えてみましょう。
コンストラクタ
//+------------------------------------------------------------------+
//| Constructor                                                      |
//+------------------------------------------------------------------+
void CMarketProfile::CMarketProfile(string prefix, datetime time1, datetime time2, double high, double low, MqlRates &bars[]):
   m_prefix(prefix),
   m_time1(time1),
   m_time2(time2),
   m_high(high),
   m_low(low),
   m_vert_scale(NULL),
   m_hor_scale(NULL)
  {
//--- copy the array of intraday bars to the array of MqlRates structures,
//--- create a name for the graphical object and define the size of the daily candle
   ArrayCopy(m_bars, bars);
   m_name=ExtPrefixUniq+"_MP_"+TimeToString(time1, TIME_DATE);
   m_day_size_pt=(int)((m_high-m_low)/SymbolInfoDouble(Symbol(), SYMBOL_POINT));
//--- set vector sizes for trading sessions
   m_asia=vector::Zeros(m_day_size_pt);
   m_europe=vector::Zeros(m_day_size_pt);
   m_america=vector::Zeros(m_day_size_pt);
//--- set the width and height of the canvas
   UpdateSizes();
//--- if this is the first tick at the beginning of the day, then the canvas dimensions will be zero - set the dimensions to 1 pixel in height and width
   m_height=m_height?m_height:1;
   m_width=m_width?m_width:1;
//--- create a graphical object
   if(m_canvas.CreateBitmap(m_name, m_time1, m_high, m_width, m_height, COLOR_FORMAT_ARGB_NORMALIZE))
      ObjectSetInteger(0, m_name, OBJPROP_BACK, true);
   else
     {
      Print("Error creating canvas: ", GetLastError());
      Print("time1=", m_time1, "  high=", m_high, "  width=", m_width, "  height=", m_height);
     }
  }
パラメトリックコンストラクタは、作成されるキャンバスオブジェクトの名前の接頭辞(そのキャンバス上に日次プロファイルを描画するためのもの)、日付の開始時刻と終了時刻、当日の最高価格と最安価格、および日中バーの配列を受け取ります。これらの変数の値は、初期化リストで対応するクラス変数に設定されます。次におこなわれる処理は以下の通りです。
- 参照で渡された配列はクラス配列にコピーされ、グラフィカルオブジェクトの一意な名前が、入力で渡された接頭辞、「MP」の略語、日付のオープニング時間から作成されます。また、日足バーはポイント単位で計算されます。
- 各取引セッション用の配列は、日次バーのポイントサイズと同じサイズに設定され、同時にゼロで初期化されます。
- プロファイル描画用のキャンバスの寸法が設定されます。このとき、当日の最初のティックの場合はサイズは0となり、幅と高さは最小許容寸法の1ピクセルに設定されます。
- 指定された寸法に基づいて描画用キャンバスが作成されます。
以下は、特定の日に作成されたマーケットプロファイルオブジェクトの存在を確認するためのメソッドです。
//+------------------------------------------------------------------+
//| Checks if CMarketProfile object is for the specified 'time' date |
//+------------------------------------------------------------------+
bool CMarketProfile::Check(string prefix, datetime time)
  {
   string calculated= prefix+"_MP_"+TimeToString(time, TIME_DATE);
   return (m_name==(calculated));
  };
各プロファイルキャンバスオブジェクトの名前はクラスコンストラクタ内で設定されており、その名前には日付の開始時刻の文字列表現が使われています。したがって、特定の時間に対してオブジェクトが作成されているかを確認するには、メソッドにその日の開始時刻を渡し、オブジェクト名と同一の文字列を作成し、生成された文字列と実際のオブジェクト名を比較します。チェックの結果はメソッドから返されます。
以下は、日中の高値および安値をマーケットプロファイルオブジェクトに設定し、日中バーの配列をオブジェクトに渡すメソッドです。
//+------------------------------------------------------------------+
//| Sets High/Low and a set of current-timeframe bars                |
//+------------------------------------------------------------------+
void CMarketProfile::SetHiLoBars(double high, double low, MqlRates &bars[])
  {
//--- if the maximum of the day has changed, move the OBJ_BITMAP object to the new Y coordinate
   if(high>m_high)
     {
      m_high=high;
      if(!ObjectSetDouble(0, m_name, OBJPROP_PRICE, m_high))
         PrintFormat("Failed to update canvas for %s, error %d", TimeToString(m_time1, TIME_DATE), GetLastError());
     }
   ArrayCopy(m_bars, bars);
   m_high=high;
   m_low=low;
//--- daily range in points
   m_day_size_pt=(int)((m_high-m_low)/SymbolInfoDouble(Symbol(), SYMBOL_POINT));
//--- reset vector sizes for trading sessions
   m_asia=vector::Zeros(m_day_size_pt);
   m_europe=vector::Zeros(m_day_size_pt);
   m_america=vector::Zeros(m_day_size_pt);
  }
このメソッドは、日足バーの高値および安値の値と、MqlRates構造体形式の日中バーの配列を参照渡しで受け取ります。
- 高値がオブジェクト変数に書き込まれ、キャンバスが新しい座標に移動されます。
- 日中バーは渡された配列から内部配列にコピーされます。
- その日の安値がクラス変数に設定されます。
- 日中バーの新しいサイズがポイント単位で計算されます。
- 取引セッション用の配列は、計算された日中バーのサイズ分だけ増加され、ゼロで初期化されます。
ここで、ベクトルの初期化にはZerosメソッドが使われています。このメソッドは、ベクトルのサイズを設定すると同時に、配列全体をゼロで埋めます。
通常の配列であれば、ArrayResize()およびArrayInitialize()の2つの操作をおこなう必要があります。
以下は、マーケットプロファイルオブジェクトにおけるキャンバスの寸法および長方形描画用スケーリング係数を設定するメソッドです。
//+------------------------------------------------------------------+
//|  Sets drawing parameters                                         |
//+------------------------------------------------------------------+
void CMarketProfile::UpdateSizes(void)
  {
//--- convert time/price to x/y coordinates
   int x1, y1, x2, y2;
   ChartTimePriceToXY(0, 0, m_time1, m_high, x1, y1);
   ChartTimePriceToXY(0, 0, m_time2, m_low,  x2, y2);
//--- calculate canvas dimensions
   m_height=y2-y1;
   m_width =x2-x1;
//--- calculate ratios for transforming vertical price levels
//--- and horizontal bar counters to chart pixels
   m_vert_scale=double(m_height)/(m_day_size_pt);
   m_hor_scale =double(m_width*PeriodSeconds(PERIOD_CURRENT))/PeriodSeconds(PERIOD_D1);

//--- change the canvas size
   m_canvas.Resize(m_width, m_height);
  }
このメソッドのロジックはコード内にコメントされています。スケーリング比率は、キャンバスサイズとチャートウィンドウサイズの比率に基づいて、キャンバス上に描画される長方形のサイズを設定するために使用されます。
計算された比率は、描画される長方形の高さと幅の計算に加えられます。
以下は、マーケットプロファイルがチャートの可視範囲内にあるかどうかを示すフラグを返すメソッドです。
//+------------------------------------------------------------------+
//|  Checks that the profile is in the visible part of the chart     |
//+------------------------------------------------------------------+
bool CMarketProfile::isVisibleOnChart(void)
  {
   long last_bar=ChartGetInteger(0, CHART_FIRST_VISIBLE_BAR);        // last visible bar on the chart on the left
   long first_bar=last_bar+-ChartGetInteger(0, CHART_VISIBLE_BARS);  // first visible bar on the chart on the right
   first_bar=first_bar>0?first_bar:0;
   datetime left =iTime(Symbol(), Period(), (int)last_bar);          // time of the left visible bar on the chart
   datetime right=iTime(Symbol(), Period(), (int)first_bar);         // time of the right visible bar on the chart

//--- return a flag that the canvas is located inside the left and right visible bars of the chart
   return((m_time1>= left && m_time1 <=right) || (m_time2>= left && m_time2 <=right));
  }
ここでは、チャート上で左端および右端に見えているバーの番号を取得し、それぞれのバーの時間を取得します。そして、キャンバスの左端と右端の時間がチャート上の可視バーの範囲内にあるかどうかのフラグを返します。
以下は、取引セッションのパラメータを計算し、セッション配列に値を格納するメソッドです。
//+------------------------------------------------------------------+
//| Prepares profile arrays by sessions                              |
//+------------------------------------------------------------------+
bool CMarketProfile::CalculateSessions(void)
  {
   double point=SymbolInfoDouble(Symbol(), SYMBOL_POINT);   // one point value
//--- if the array of intraday bars is not filled, leave
   if(ArraySize(m_bars)==0)
      return(false);
//---- iterate over all the bars of the current day and mark the cells of the arrays (vectors) that contain the bars being iterated over in the loop
   int size=ArraySize(m_bars);
   for(int i=0; i<size; i++)
     {
      //--- get the bar hour
      MqlDateTime bar_time;
      TimeToStruct(m_bars[i].time, bar_time);
      uint        hour     =bar_time.hour;
      //--- calculate price levels in points from the Low of the day reached by the price on each bar of the loop
      int         start_box=(int)((m_bars[i].low-m_low)/point);   // index of the beginning of price levels reached by the price on the bar
      int         stop_box =(int)((m_bars[i].high-m_low)/point);  // index of the end of price levels reached by the price on the bar

      //--- American session
      if(hour>=InpAmericaStartHour)
        {
         //--- in the loop from the beginning to the end of price levels, fill the counters of bars where the price was at this level
         for(int ind=start_box; ind<stop_box; ind++)
            m_america[ind]++;
        }
      else
        {
         //--- European session
         if(hour>=InpEuropeStartHour && hour<InpAmericaStartHour)
            //--- in the loop from the beginning to the end of price levels, fill the counters of bars where the price was at this level
            for(int ind=start_box; ind<stop_box; ind++)
               m_europe[ind]++;
         //--- Asian session
         else
            //--- in the loop from the beginning to the end of price levels, fill the counters of bars where the price was at this level
            for(int ind=start_box; ind<stop_box; ind++)
               m_asia[ind]++;
        }
     }
//--- vectors of all sessions are ready
   return(true);
  }
前回の記事では、取引セッション内で日中の安値から高値までの価格レベルに到達したバーの数を定義するロジックを詳しく考察しました。前バージョンのインジケーターでは、これらすべての処理がインジケーターのメインループ内でおこなわれていましたが、ここではこの計算全体を日次プロファイルオブジェクトの別メソッドとして切り出しています。このメソッドのポイントは、安値から高値までの各価格レベル(ポイント単位)を横切ったバーの数をカウントし、配列(ベクトル)の各セルに書き込むことです。メソッドの処理が完了すると、すべてのベクトルは価格レベルに沿った価格変動に従って埋められます。各レベルを横切ったバーの数が、配列(ベクトル)の対応するセルに設定されます。
以下は、すべての取引セッションのデータに基づいてキャンバス上にマーケットプロファイルヒストグラムを描画するメソッドです。
//+------------------------------------------------------------------+
//|  Draw Market Profile on the canvas                               |
//+------------------------------------------------------------------+
void CMarketProfile::Draw(double multiplier=1.0)
  {
//--- sum up all sessions for rendering
   vector total_profile=m_asia+m_europe+m_america;   // profile that combines all sessions
   vector europe_asia=m_asia+m_europe;               // profile that combines only the European and Asian sessions

//--- set a completely transparent background for the canvas
   m_canvas.Erase(ColorToARGB(clrBlack, 0));

//--- variables for drawing rectangles
   int x1=0;                           // X coordinate of the left corner of the rectangle always starts at zero
   int y1, x2, y2;                     // rectangle coordinates
   int size=(int)total_profile.Size(); // size of all sessions

//--- render the American session with filled rectangles
   for(int i=0; i<size; i++)
     {
      //--- skip zero vector values
      if(total_profile[i]==0)
         continue;
      //--- calculate two points to draw a rectangle, x1 is always 0 (X of the lower left corner of the rectangle)
      y1=m_height-int(i*m_vert_scale);                    // Y coordinate of the lower left corner of the rectangle
      y2=(int)(y1+m_vert_scale);                          // Y coordinate of the upper right corner of the rectangle
      x2=(int)(total_profile[i]*m_hor_scale*multiplier);  // X coordinate of the upper right corner of the rectangle
      //--- draw a rectangle at the calculated coordinates with the color and transparency set for the American session
      m_canvas.FillRectangle(x1, y1, x2, y2, ColorToARGB(InpAmericaSession, InpTransparency));
     }

//--- render the European session with filled rectangles
   for(int i=0; i<size; i++)
     {
      //--- skip zero vector values
      if(total_profile[i]==0)
         continue;
      //--- calculate two points to draw a rectangle
      y1=m_height-int(i*m_vert_scale);
      y2=(int)(y1+m_vert_scale);
      x2=(int)(europe_asia[i]*m_hor_scale*multiplier);
      //--- draw a rectangle over the rendered American session using the calculated coordinates
      //--- with color and transparency set for the European session
      m_canvas.FillRectangle(x1, y1, x2, y2, ColorToARGB(InpEuropeSession, InpTransparency));
     }

//--- draw the Asian session with filled rectangles
   for(int i=0; i<size; i++)
     {
      //--- skip zero vector values
      if(total_profile[i]==0)
         continue;
      //--- calculate two points to draw a rectangle
      y1=m_height-int(i*m_vert_scale);
      y2=(int)(y1+m_vert_scale);
      x2=(int)(m_asia[i]*m_hor_scale*multiplier);
      //--- draw a rectangle over the rendered European session using the calculated coordinates
      //--- with color and transparency set for the Asian session
      m_canvas.FillRectangle(x1, y1, x2, y2, ColorToARGB(InpAsiaSession, InpTransparency));
     }
//--- update the OBJ_BITMAP object without redrawing the chart
   m_canvas.Update(false);
  }
メソッドのロジックは、コードコメントで詳しく説明されています。簡単に言うと、アジア、ヨーロッパ、アメリカの3つのセッションの配列(ベクトル)を計算し、埋めています。そして、各セッションのプロファイルヒストグラムを描画する必要があります。描画の順序は、まずアメリカセッション、次にヨーロッパセッション、最後にアジアセッションの順でおこなわれます。
なぜセッションの実行時間とは逆の順序で描画するのでしょうか。
- アメリカセッションのヒストグラムは、前の2つのセッションの既に取引された時間とアメリカセッション自体の時間の両方を含んでいます。つまり、1日の全体プロファイルの最も完全なヒストグラムになります。それが最初に描画される理由です。
- 次にヨーロッパセッションを描画します。このヒストグラムは既に取引されたアジアセッションの時間を含むため、アメリカセッションのX軸上では短くなります。そのため、アメリカセッションの上に重ねて描画する必要があります。
- 最後に、X軸上で最も短いアジアセッションのヒストグラムを描画します。
ここで、ベクトルを使用すると配列データを結合するのが非常に便利である点も注目に値します。
//--- sum up all sessions for rendering
   vector total_profile=m_asia+m_europe+m_america;   // profile that combines all sessions
   vector europe_asia=m_asia+m_europe;               // profile that combines only the European and Asian sessions
本質的には、同じサイズの複数の配列を要素ごとに結合して1つの配列にまとめる操作であり、以下のコードで表すことができます。
#define SIZE   3

double array_1[SIZE]={0,1,2};
double array_2[SIZE]={3,4,5};
double array_3[SIZE]={6,7,8};

Print("Contents of three arrays:");
ArrayPrint(array_1);
ArrayPrint(array_2);
ArrayPrint(array_3);

for(int i=0; i<SIZE; i++)
  {
   array_1[i]+=array_2[i]+=array_3[i];
  }

Print("\nResult of the merge:");
ArrayPrint(array_1);
/*
Contents of three arrays:
0.00000 1.00000 2.00000
3.00000 4.00000 5.00000
6.00000 7.00000 8.00000

Result of the merge:
 9.00000 12.00000 15.00000
*/
以下のコードは、上で説明したメソッドのコード行と同じことをおこないます。
vector total_profile=m_asia+m_europe+m_america; // profile that combines all sessions
コードがどれほど便利で簡潔になったかを説明するまでもないでしょう。
作成されたキャンバスオブジェクトは、クラスのデストラクタで削除され、チャートが再描画されて変更が反映されます。
//+------------------------------------------------------------------+
//| Destructor                                                       |
//+------------------------------------------------------------------+
void CMarketProfile::~CMarketProfile(void)
  {
//--- delete all graphical objects after use
   ObjectsDeleteAll(0, m_prefix, 0, OBJ_BITMAP);
   ChartRedraw();
  }
これで、インジケーターのループ内でグラフィカルオブジェクトを使って描画する代わりに、各日足バーに対して説明したクラスのインスタンスを1つ作成し、すべてのセッションのデータを計算して、キャンバス上に日ごとのマーケットプロファイルヒストグラムを描画するだけで十分です。作成されるグラフィカルオブジェクトの数は、プロファイル表示設定で指定された日数に依存します。前バージョンのインジケーターでは、ヒストグラムの各線がそれぞれ独自のグラフィカルオブジェクトで描画されていましたが、それとは異なります。
インジケーターの最適化
次に、マーケットプロファイルクラスを使ってインジケーターがどのように作られているかを見てみましょう。インジケーターファイル「\MQL5\Indicators\Free Indicators\MarketProfile Canvas.mq5」を最初から開き、内容を確認します。
まず最初に、カスタムCCanvas描画を簡単に作成するためのクラスファイルと、厳密に型付けされたCArrayList<T>リストを作成するためのクラスファイルがインクルードされています。
//+------------------------------------------------------------------+
//|                                         MarketProfile Canvas.mq5 |
//|                              Copyright 2009-2024, MetaQuotes Ltd |
//|                                             https://www.mql5.com |
//+------------------------------------------------------------------+
#property copyright "Copyright 2022, MetaQuotes Ltd."
#property link      "https://www.mql5.com"
#property version   "1.00"
#property indicator_chart_window
#property indicator_plots 0

#include <Canvas\Canvas.mqh>
#include <Generic\ArrayList.mqh>

//--- input parameters
次に、インジケーターの入力リスト、グラフィカルオブジェクトの一意の接頭子、宣言されたマーケットプロファイルクラス、および宣言されたクラスオブジェクトのリストが続きます。
//--- input parameters
input uint  InpStartDate       =0;           /* day number to start calculation */  // 0 - current, 1 - previous, etc.
input uint  InpShowDays        =7;           /* number of days to display */        // starting with and including the day in InpStartDate
input int   InpMultiplier      =1;           /* histogram length multiplier */
input color InpAsiaSession     =clrGold;     /* Asian session */
input color InpEuropeSession   =clrBlue;     /* European session */
input color InpAmericaSession  =clrViolet;   /* American session */
input uchar InpTransparency    =150;         /* Transparency, 0 = invisible */      // market profile transparency, 0 = fully transparent
input uint  InpEuropeStartHour =8;           /* European session opening hour */
input uint  InpAmericaStartHour=14;          /* American session opening hour */

//--- unique prefix to identify graphical objects belonging to the indicator
string ExtPrefixUniq;

//--- declare CMarketProfile class
class CMarketProfile;
//--- declare a list of pointers to objects of the CMarketProfile class
CArrayList<CMarketProfile*> mp_list;
マーケットプロファイルクラスはインジケーターコードの後に記述されているため、コンパイル時に「不明な変数型」のエラーを避けるために、クラスの前方宣言が必要です。
'CMarketProfile' - unexpected token
厳密に型付けされたリストには、後述のCMarketProfileクラス型オブジェクトへのポインタが格納されます。
OnInitハンドラ内では、グラフィカルオブジェクトの接頭辞として、システム起動後に経過したミリ秒数の末尾4桁を作成します。
//+------------------------------------------------------------------+
//| Custom indicator initialization function                         |
//+------------------------------------------------------------------+
int OnInit()
  {
//--- create a prefix for object names
   string number=StringFormat("%I64d", GetTickCount64());
   ExtPrefixUniq=StringSubstr(number, StringLen(number)-4);
   Print("Indicator \"Market Profile Canvas\" started, prefix=", ExtPrefixUniq);

   return(INIT_SUCCEEDED);
  }
OnCalculateハンドラの完全なコードを見てみましょう。
//+------------------------------------------------------------------+
//| Custom indicator iteration function                              |
//+------------------------------------------------------------------+
int OnCalculate(const int rates_total,
                const int prev_calculated,
                const datetime &time[],
                const double &open[],
                const double &high[],
                const double &low[],
                const double &close[],
                const long &tick_volume[],
                const long &volume[],
                const int &spread[])
  {
//--- opening time of the current daily bar
   datetime static open_time=0;

//--- number of the last day for calculations
//--- (if InpStartDate = 0 and InpShowDays = 3, lastday = 3)
//--- (if InpStartDate = 1 and InpShowDays = 3, lastday = 4) etc ...
   uint lastday=InpStartDate+InpShowDays;

//--- if the first calculation has already been made
   if(prev_calculated!=0)
     {
      //--- get the opening time of the current daily bar
      datetime current_open=iTime(Symbol(), PERIOD_D1, 0);

      //--- if we do not calculate the current day
      if(InpStartDate!=0)
        {
         //--- if the opening time was not received, leave
         if(open_time==current_open)
            return(rates_total);
        }
      //--- update opening time
      open_time=current_open;
      //--- we will only calculate one day from now on, since all other days have already been calculated during the first run
      lastday=InpStartDate+1;
     }

//--- in a loop for the specified number of days (either InpStartDate+InpShowDays on first run, or InpStartDate+1 on each tick)
   for(uint day=InpStartDate; day<lastday; day++)
     {
      //--- get the data of the day with index day into the structure
      MqlRates day_rate[];
      //--- if the indicator is launched on weekends or holidays when there are no ticks, you should first open the daily chart of the symbol
      //--- if we have not received bar data for the day index of the daily period, we leave until the next call to OnCalculate()
      if(CopyRates(Symbol(), PERIOD_D1, day, 1, day_rate)==-1)
         return(prev_calculated);

      //---  get day start and end time
      datetime start_time=day_rate[0].time;
      datetime stop_time=start_time+PeriodSeconds(PERIOD_D1)-1;

      //--- get all intraday bars of the current day
      MqlRates bars_in_day[];
      if(CopyRates(Symbol(), PERIOD_CURRENT, start_time, stop_time, bars_in_day)==-1)
         return(prev_calculated);

      CMarketProfile *market_profile;
      //--- if the Market Profile has already been created and its drawing has been performed earlier
      if(prev_calculated>0)
        {
         //--- find the Market Profile object (CMarketProfile class) in the list by the opening time of the day with the 'day' index
         market_profile=GetMarketProfileByDate(ExtPrefixUniq, start_time);
         //--- if the object is not found, return zero to completely recalculate the indicator
         if(market_profile==NULL)
           {
            PrintFormat("Market Profile not found for %s. Indicator will be recalculated for all specified days",
                        TimeToString(start_time, TIME_DATE));
            return(0);
           }
         //--- CMarketProfile object is found in the list; set it to High and Low values of the day and pass the array of intraday bars
         //--- in this case, the object is shifted to a new coordinate corresponding to the High of the daily candle, and all arrays (vectors) are reinitialized
         market_profile.SetHiLoBars(day_rate[0].high, day_rate[0].low, bars_in_day);
        }
      //--- if this is the first calculation
      else
        {
         //--- create a new object of the CMarketProfile class to store the Market Profile of the day with 'day' index
         market_profile = new CMarketProfile(ExtPrefixUniq, start_time, stop_time, day_rate[0].high, day_rate[0].low, bars_in_day);
         //--- add a pointer to the created CMarketProfile object to the list
         mp_list.Add(market_profile);
        }
      //--- set canvas dimensions and line drawing parameters
      market_profile.UpdateSizes();
      //--- calculate profiles for each trading session
      market_profile.CalculateSessions();
      //--- draw the Market Profile
      market_profile.Draw(InpMultiplier);
     }
//--- redraw the chart after the loop has been completed and all objects have been created and updated
   ChartRedraw(0);

//--- return the number of bars for the next OnCalculate call
   return(rates_total);
  }
ハンドラのロジックはコード内のコメントで詳細に説明されています。簡単にまとめると以下の通りです。
- 表示するマーケットプロファイルの日数分のループを実行する
- ループインデックスに対応する日付を構造体に取得する
- ループで選択された日付に含まれる、現在チャート期間のバーの数を取得する
- 選択された日のマーケットプロファイルオブジェクトが既に作成されていれば取得し、まだリストにない場合は新規作成する
- 日中バーの安値から高値までのサイズをチャートピクセル単位で取得し、取引セッションの配列(ベクトル)を再初期化する
- 選択日のバーの新しいサイズに応じて、キャンバスのサイズを変更する
- セッションごとに日次マーケットプロファイルを再計算する
- キャンバス上に各取引セッションのプロファイルを再描画する
- ループの終了時に、チャートを再描画する
インジケーターのOnDeinitハンドラハンドラでは、作成されたすべてのグラフィカルオブジェクトを削除します。
//+------------------------------------------------------------------+
//| Custom indicator deinitialization function                       |
//+------------------------------------------------------------------+
void OnDeinit(const int reason)
  {
//--- delete all Market Profile graphical objects after use
   Print("Indicator \"Market Profile Canvas\" stopped, delete all objects CMarketProfile with prefix=", ExtPrefixUniq);

//--- in a loop by the number of CMarketProfile objects in the list
   int size=mp_list.Count();
   for(int i=0; i<size; i++)
     {
      //--- get the pointer to the CMarketProfile object from the list by the loop index
      CMarketProfile *market_profile;
      mp_list.TryGetValue(i, market_profile);
      //--- if the pointer is valid and the object exists, delete it
      if(market_profile!=NULL)
         if(CheckPointer(market_profile)!=POINTER_INVALID)
            delete market_profile;
     }
//--- redraw the chart to display the result immediately
   ChartRedraw(0);
  }
OnChartEventイベントハンドラで、マーケットプロファイルの各日のキャンバスサイズを変更します。
//+------------------------------------------------------------------+
//| Custom indicator chart's event handler                           |
//+------------------------------------------------------------------+
void OnChartEvent(const int id, const long& lparam, const double& dparam, const string& sparam)
  {
//--- if this is a user event, leave
   if(id>=CHARTEVENT_CUSTOM)
      return;

//--- if there is a chart change, update the sizes of all objects of the CMarketProfile class with redrawing the chart
   if(CHARTEVENT_CHART_CHANGE==id)
     {
      //--- in a loop by the number of CMarketProfile objects in the list
      int size=mp_list.Count();
      for(int i=0; i<size; i++)
        {
         //--- get the pointer to the CMarketProfile object by the loop index
         CMarketProfile *market_profile;
         mp_list.TryGetValue(i, market_profile);
         //--- if the object is received and if it is in the visible area of the chart
         if(market_profile)
            if(market_profile.isVisibleOnChart())
              {
               //--- update canvas dimensions and redraw market profile histograms
               market_profile.UpdateSizes();
               market_profile.Draw(InpMultiplier);
              }
        }
      //--- update the chart after recalculating all Profiles
      ChartRedraw();
     }
  }
チャートの表示スケールは縦横に変更できるため、取引セッションのヒストグラムを描画したグラフィカルオブジェクトも、新しいチャートサイズに合わせてリサイズする必要があります。そのため、チャートが変更された際のイベントハンドラでは、CMarketProfileクラスのすべてのオブジェクトをサイズ更新し、新しいチャートスケールに応じてサイズ変更されたキャンバス上に再描画する必要があります。
以下は、指定された日の開始時刻に作成されたマーケットプロファイルオブジェクトを返す関数です。
//+------------------------------------------------------------------+
//| Returns CMarketProfile or NULL by the date                       |
//+------------------------------------------------------------------+
CMarketProfile* GetMarketProfileByDate(string prefix, datetime time)
  {
//--- in a loop by the number of CMarketProfile objects in the list
   int size=mp_list.Count();
   for(int i=0; i<size; i++)
     {
      //--- get the pointer to the CMarketProfile object by the loop index
      CMarketProfile *market_profile;
      mp_list.TryGetValue(i, market_profile);
      //--- if the pointer is valid and the object exists,
      if(market_profile!=NULL)
         if(CheckPointer(market_profile)!=POINTER_INVALID)
           {
            //--- if the Market Profile object obtained by the pointer was created for the required time, return the pointer
            if(market_profile.Check(prefix, time))
               return(market_profile);
           }
     }
//--- nothing found - return NULL
   return(NULL);
  }
この関数は、インジケーターの取引日ループ内で使用され、特定の日のオープニング時間に対応する日足バー用に作成されたCMarketProfileクラスオブジェクトへのポインタをリストから返します。この関数を使うことで、時間に基づいて必要なオブジェクトを取得し、さらに更新することが可能です。
結論
インジケーターコードの最適化によって、リソース消費を削減する方法を考察しました。これにより、何千ものグラフィカルオブジェクトを廃止し、マーケットプロファイルを描画する各日ごとに1つのグラフィカルオブジェクトに置き換えました。
最適化の結果、設定で指定された日数(デフォルトは7日)ごとに、それぞれの取引日が独自のキャンバス(OBJ_BITMAPオブジェクト)上に表示され、3つの取引セッション(アジア、ヨーロッパ、アメリカ)がヒストグラムとして描画されます。それぞれのセッションは設定で指定された色で表示されます。3営業日分のマーケットプロファイルは最終的にこのような形になります。
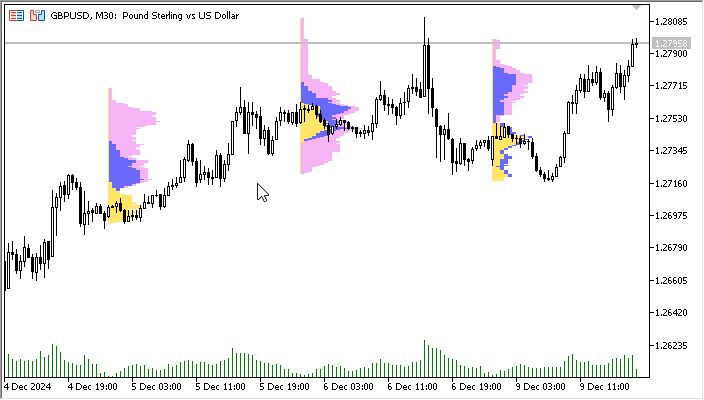
ここでは、わずか3つのグラフィカルオブジェクト上に、CCanvasクラスを使って取引セッションのヒストグラムが描画されています。たとえ3つのBitmapグラフィカルオブジェクトだけでも、リアルタイムで再描画すると目に見えるチラつきや画像の揺れが発生することがあります。これは、さらなるコード最適化の余地がまだあることを示しています。いずれにせよ、以前の何千ものグラフィカルオブジェクトに比べて、現在はわずか3つしかないため、リソース消費は大幅に削減されます。視覚的なアーティファクトは、コードをさらに分析することで改善可能です(例として、CMarketProfileクラスの未実装メソッドisChartScaleChangedを活用し、チャートスケールが実際に変化したときのみ再描画するようにする方法など)。
まとめると、どんなコードでも最適化は常に可能です。ただし、そのためには視覚コンポーネントの構築概念を変更する必要がある場合もあります。本インジケーターではまさにその手法が用いられています。
この記事には、コメント付きのインジケーターファイルが付属しており、自分でダウンロードして学習したり、さらに最適化を続けたりすることができます。
MetaQuotes Ltdによってロシア語から翻訳されました。
元の記事: https://www.mql5.com/ru/articles/16579
警告: これらの資料についてのすべての権利はMetaQuotes Ltd.が保有しています。これらの資料の全部または一部の複製や再プリントは禁じられています。
この記事はサイトのユーザーによって執筆されたものであり、著者の個人的な見解を反映しています。MetaQuotes Ltdは、提示された情報の正確性や、記載されているソリューション、戦略、または推奨事項の使用によって生じたいかなる結果についても責任を負いません。

- 無料取引アプリ
- 8千を超えるシグナルをコピー
- 金融ニュースで金融マーケットを探索
なぜ完璧な出来高プロフィールを書かないのか
完璧」とはどういう意味か?
なぜ完璧なボリュームプロファイルを書かないのか
これは興味深いトピックだ。私もプロフィールの表示をキャンバスに切り替えました。 しかし、この方法にはいくつかの欠点があります。図が「描画されたまま忘れ去られる」場合、mt5はチャートの移動、TFの変更などのアクションの際に勝手にスケーリングしてしまうので、キャンバスはCHARTEVENT_CHART_CHANGE時に、たとえVPが履歴のどこかにあったとしても、すでに変更されていないデータに対して常に再描画されなければなりません。そして、これらのデータを取得しなければなりませんが、常にそれら(ティックデータ)がmt5のキャッシュにあるとは限りません。ここでは、メモリを保存してVPの境界が変更されたかどうかをチェックするか、常にmt5にリクエストします(現在、私はそのように実装しています)。
描画は問題の一部です。第二の部分は、トレーダーは常に賞賛するための画像だけを必要とするわけではなく、POC、VHL、VLL、「空白へのエントリー」など、この画像に基づくシグナルを必要とするということです。そして、イベントをグラフィカルなオブジェクトにのみバインドすることができます(条件付きで、それらをインジケータのどこかの配列に保持することができますが、それでも、このレベルがどこにあるか、どこでアラートがトリガーされたかを視覚化することが望ましいです)。つまり、もちろんグラフィカル オブジェクトを通じて VP を表示する場合よりも 1 桁、あるいは数桁少なくなりますが、それでも kanvas VP にはグラフィカル オブジェクトが必要です。
つまり、mt5 からは(まだ?)ボリューメトリックなターミナルは得られません(クラスターやデルタなども必要です)。
画像はインパルス波でVPがどのように見えるかの例で、POCは線で示されている。シニアTFのティック・ボリュームとリアル・ボリュームを比較する練習が示しているように、高値または安値のローソク足を通過する大きなボリュームのケースを除いて、それらは一致するか、または非常に近い。
これは興味深いトピックだ。私もプロフィールの表示をキャンバスに切り替えました。 しかし、この方法にはいくつかの欠点があります。図が「描画されたまま忘れ去られる」場合、mt5はチャートの移動、TFの変更などのアクションの際に勝手にスケーリングしてしまうので、キャンバスはCHARTEVENT_CHART_CHANGE時に、たとえVPが履歴のどこかにあったとしても、すでに変更されていないデータに対して常に再描画されなければなりません。このデータは必ず取得しなければならず、常にmt5のキャッシュにあるわけではなく、メモリを保存してVPの境界が変わったかどうかをチェックするか、常にmt5にリクエストするか(現在、私はこのように実装しています)、どちらかですが、これはすぐには機能せず、データが完全に与えられるとは限りません。
描画は問題の一部です。第二の部分は、トレーダーは常にそれを賞賛するために絵だけを必要としないことであり、彼はPOC、VHL、VLL、 "ボイドへのエントリ "など、この画像に基づいてシグナルを必要とします。そして、イベントをグラフィカル・オブジェクトにのみバインドすることができます(条件付きで、それらをインジケータのどこかの配列に保持することができますが、それでも、このレベルがどこにあるのか、どこでアラートがトリガーされたのかを視覚化することが望ましいです)。つまり、キャンバスのVPにはまだグラフィカル・オブジェクトが必要なのですが、もちろん、グラフィカル・オブジェクトを通してVPを表示する場合に比べて、その数は1桁、あるいは数桁少なくなります。
一般的に、要約すると以下のようになります。mt5からボリュメトリック・ターミナルを取得することはできません(クラスター、デルタなどが必要です)。
画像はインパルス波でVPがどのように見えるかの例で、POCは線で示されている。シニアTFのティック・ボリュームとリアル・ボリュームを比較する練習が示しているように、高値または安値のローソク足を通過する大きなボリュームのケースを除いて、それらは一致するか、または非常に近い。
正確にはそのようなことはありません。これらはデメリットではなく、ツールを最大限の可能性と自由な行動で使用するために知っておく必要がある機能です。
3Dクラスタであっても、すべてが可能です。
OpenCLを使用せずにCanvasのみを使用したMQL5の 例です。OpenCL(つまりグラフィックカード)を使用すれば、大幅なスピードアップ(数十倍)が実現できます。