
MQL5での移動平均をゼロから作成する:単純明快

内容
はじめに
移動平均とは、一定期間の通貨ペアの平均価格をバー数で表したものです。これは最も古いテクニカル指標の1つであり、おそらく最も人気があり頻繁に使われているインジケーターでもあります。なぜなら、他の多くのインジケーターが移動平均を基に構築されているからです。
移動平均はさまざまな応用問題の解決に広く使われています。数学的には、単純移動平均は与えられた数値系列の算術平均です。MetaTrader 5の端末で各種インジケーターやスクリプト、EAを作成する際にも、何らかの形で移動平均が計算に用いられます。移動平均はトレンドの方向性を判断したり、小さな価格変動(ノイズ)を平滑化したり、移動平均やその他のインジケーターを用いた取引戦略を作成するための、シンプルかつ非常に効果的なツールです。これらのインジケーターはクライアント端末やmql5.comで広く提供されています。
興味深いことに、移動平均は金融市場だけでなく、気象学や経済学といった他の分野でも広く利用されています。機械学習モデルの中にも、時系列予測の特徴の一つとして移動平均の概念を取り入れているものがあります。
移動平均は、正しく使うことで取引の成果やデータ分析を大幅に向上させる強力なツールです。
単純移動平均(SMA)
単純移動平均は、たとえばバーの終値のような一定数の数値の算術平均として計算されます。計算の各ポイントにおいて、移動平均の値は計算対象の数値系列の隣接するポイントと同じ重みを持っています。SMAインジケーターについて言えば、インジケーターラインの各バー(N)では、左隣のバーの値と合わせて平均値を算出します。つまり、(N + N-1 + N-2 + N-3 + … + N-x) / x で、xは平均化期間(計算対象のバー数)です。
SMAの特徴
- 計算方法が単純で、計算および理解が容易である
- シンプルなため、特に長い計算期間を使う場合は価格変動に遅れが生じやすい
- シグナルを確認するために他のインジケーターと組み合わせて使われることが多い

図1:終値での単純移動平均(SMA)、計算期間10の場合
計算
バーの終値に基づくSMAインジケーターの計算は、次のように表すことができます。
SMA = SUM(CLOSE(i), N) / N
ここで
- SUM:合計
- CLOSE(i):現在の期間の終値
- N:計算期間(バー)の数
このインジケーターでは、単純移動平均の計算は次のようになります。
double result=0;
for(int j=0; j<period; j++)
   result+=close[i-j];
result/=period;
ここで
- result:SMAの計算結果を格納する変数
- period:SMAの計算期間であり、計算対象となるデータ数(ここではバーの終値の数)
- i:インジケーターのメインループのインデックス
- j:i番目のバーから左側(過去側)のバーの終値を合計するためのループインデックス
つまり、平滑化期間が5の場合、i番目のバーから過去4本のバー(i、i-1、i-2、i-3、i-4)の終値をすべて足し合わせます。
すべての終値の合計を期間の数で割ることで、期間分の終値の単純算術平均が求まります。
インジケーターコード
//+------------------------------------------------------------------+
//|                                           SMAonPriceCloseRAW.mq5 |
//|                                  Copyright 2024, MetaQuotes Ltd. |
//|                                             https://www.mql5.com |
//+------------------------------------------------------------------+
#property copyright "Copyright 2024, MetaQuotes Ltd."
#property link      "https://www.mql5.com"
#property version   "1.00"
#property indicator_chart_window
#property indicator_buffers 1
#property indicator_plots   1

//--- plot MA
#property indicator_label1  "SMA"
#property indicator_type1   DRAW_LINE
#property indicator_color1  clrRed
#property indicator_style1  STYLE_SOLID
#property indicator_width1  1

//--- input parameters
input int      InpPeriod   =  10;   // SMA Period

//--- indicator buffers
double         MABuffer[];
//+------------------------------------------------------------------+
//| Custom indicator initialization function                         |
//+------------------------------------------------------------------+
int OnInit()
  {
//--- indicator buffers mapping
   SetIndexBuffer(0,MABuffer,INDICATOR_DATA);

//--- successful initialization
   return(INIT_SUCCEEDED);
  }
//+------------------------------------------------------------------+
//| Custom indicator iteration function                              |
//+------------------------------------------------------------------+
int OnCalculate(const int rates_total,
                const int prev_calculated,
                const datetime &time[],
                const double &open[],
                const double &high[],
                const double &low[],
                const double &close[],
                const long &tick_volume[],
                const long &volume[],
                const int &spread[])
  {
//--- in the loop from the value of InpPeriod to the current history bar
   for(int i=InpPeriod; i<rates_total; i++)
     {
      //--- calculate average close prices for InpPeriod bars
      double result=0;
      for(int j=0; j<InpPeriod; j++)
         result+=close[i-j];
      result/=InpPeriod;

      //--- Write the calculation result to the buffer
      MABuffer[i]=result;
     }
//--- return value of prev_calculated for the next call
   return(rates_total);
  }
これは、チャート上に設定で指定された期間(InpPeriod)の終値の平均値を各バーごとに表示する最もシンプルなインジケーターです。平均値は価格チャート上にラインとして表示されます。
指定されたバー数の平均価格を計算するには、現在のバー(ループ内のインデックス)から必要な数の終値をループで合計し、その合計をバーの数で割ることで算術平均を求めます。
つまり、履歴の先頭からループを回し、各i番目のバーについて、左側のバーの終値をj番目のループで平均計算します。このため、メインループは0から始まらず、平均を計算するバー数の値(期間)から始まります。そうすることで、SMA計算の開始時点に必要なバー数分のデータが左側に確保されます。
上記では最も単純で、かつ最適化されていないコード例を示しました。このようなインジケーターのループ構造では、毎回履歴全体の計算をやり直すため、各バーで平均価格計算の別ループが発生し処理が非常に重くなります。結果として、以下のようなログメッセージが表示される場合が多いでしょう。
indicator is too slow, 66141 ms. rewrite the indicator, please
当然ながら、これを最適化する必要があります。まずは、よりリソースを節約した計算方法を実装することが重要となります。
SMAonPriceCloseRAW.mq5インジケーターファイルは、この記事に添付されたファイルの中にあります。
計算の最適化
リソースを節約したインジケーターの計算とは、以下のような計算の流れを指します。
- インジケーターが初めて起動されたとき(または銘柄の履歴データに変更があったとき)、利用可能な全履歴に対してインジケーターを完全に計算します。
- 完全計算が終わると、計算されたすべてのデータがチャート上に描画されます。以降は、新しいティックが来たときに現在のバーに対してのみ計算・更新をおこないます。
インジケーターの計算は、Calculateイベントを受け取ったときに開始されます。このときOnCalculateイベントハンドラが呼び出されます。
通常、このイベントは対象銘柄の新しいティックを受け取ったときに発生します。
OnCalculateハンドラには2つの定義方法があり、1つのインジケーター内で両方を使うことはできません。
最初の呼び出し形式は、単一のデータバッファで計算できるインジケーター向けのものです。
int OnCalculate (const int rates_total,      // price[] array size
                 const int prev_calculated,  // handled bars at the previous call
                 const int begin,            // where significant data starts
                 const double& price[]       // array for calculation
   );
価格の時系列データの1つや、何らかのインジケーターで計算されたバッファがprice[]配列として渡される場合があります。
ユーザーは、インジケーターを起動するときのパラメータタブで、必要な時系列データやインジケーターをprice[]配列として選択します。
一方、2つ目の呼び出し形式は、計算に複数の時系列データを使うすべてのインジケーター向けに用意されています。
int OnCalculate (const int rates_total,      // size of input time series
                 const int prev_calculated,  // handled bars at the previous call
                 const datetime& time[],     // Time
                 const double& open[],       // Open
                 const double& high[],       // High
                 const double& low[],        // Low
                 const double& close[],      // Close
                 const long& tick_volume[],  // Tick Volume
                 const long& volume[],       // Real Volume
                 const int& spread[]         // Spread
   );
- open[]、high[]、low[]、close[]パラメータには、それぞれ現在の時間足の始値、高値、安値、終値の配列が格納されています。
- time[]パラメータは、各バーの始値時間の配列を持ちます。
- spread[]パラメータは、スプレッドの履歴(もしその取引銘柄にスプレッドがある場合)を格納する配列です。
- volume[]とtick_volume[]パラメータは、それぞれ取引量とティックボリュームの履歴を含みます。
- rates_totalは、インジケーターが計算可能なバーの総数であり、チャート上に存在するバーの数と対応しています。
- 関数呼び出し時のprev_calculatedパラメータは、前回のOnCalculate呼び出し時に返された値を保持します。これにより、前回の呼び出し以降に変化のなかったバーの計算を繰り返さない、リソース節約型のカスタムインジケーター計算が可能になります。通常は、現在呼び出しで扱っているバー数であるrates_totalの値を返せば十分です。もし履歴データが前回呼び出し以降に変更された場合(履歴が追加されたりギャップが埋められた場合)、端末側で自動的にprev_calculatedの値が0にリセットされます。
このように、prev_calculatedの値を利用して計算の最適化ができます。初回起動や履歴変更時はprev_calculatedは0なので、その場合はインジケーター全体を計算し、すべての履歴分の値をバッファに書き込みます。それ以降は、現在のバーだけを計算するように制御できます。
インジケーターのループは履歴データの一部(例:Periodの値)から「rates_total - 1」まで回ります。したがって、前回までに計算済みのバー数(prev_calculatedの値)を知ることで、ループ開始位置を制御できます。
たとえば、start変数に、インジケーターループを開始すべきバーのインデックスを保持するとします。初回の呼び出しではprev_calculatedは0なので、ループは0からインジケータが動作する銘柄のバー数まで走ります。
ただし注意点があります。移動平均の値を計算するためには、現在のバーから履歴の左側(過去側)に遡って指定期間分のバーの終値を参照し平均を計算します。メインループを0から開始した場合、バー0の左側には履歴が存在しないため必要なバー数が足りず、正しい値が計算できません。そのため、メインループは履歴の先頭から計算期間(例:Period)分だけずらした位置から開始する必要があります。
バーの計算開始位置をstartにセットする処理は以下のようになります。
//--- If this is the first run or a change in historical data
   if(prev_calculated==0)
     {
      //--- initialize the indicator buffer with an empty value and
      //--- set the start of the calculation to the Period value
      ArrayInitialize(MABuffer,EMPTY_VALUE);
      start=Period;
     }
//--- If this is not the first run, the calculation will start at the current bar
   else
      start=prev_calculated-1;
インジケーターが初めて起動されるとき、まずバッファに初期化値が書き込まれます。ここではEMPTY_VALUEが使われており、これは描画に参加しない空の値です。その後、インジケーターのメインループを開始するバーのインデックスをstart変数にセットします。もし初回起動でなければ、prev_calculatedには前回のOnCalculate呼び出し時に計算済みのバー数が入っています。したがって、この場合はループ開始バーのインデックスを現在のバーとしてセットし、通常は「prev_calculated - 1」となります。
OnCalculateハンドラから何らかの値(通常はrates_total)が返されることで、次回のハンドラ呼び出し時に計算すべきバーの数を調整できます。rates_totalに保存されている、計算済みバー数の値を返すと、次回の呼び出し時にその値がprev_calculatedに渡されます。これにより、ループ開始位置を「prev_calculated - 1」と指定すると、現在のバーでは現在バーのインデックス、そして新しいバーが開くと前のバーのインデックスが指定されることになります。まとめると、ループ開始バーのインデックスは以下のように指定します。
- 初回起動時:インジケーター計算期間の値から開始
- 新しいバーの出現時:前のバーから開始(前バーと現在バーの両方を計算)
- 現在のバーでは、新しいティックごとにそのバーのみを計算
完全なインジケーターコードを見てみましょう。
//+------------------------------------------------------------------+
//|                                           SMAonPriceCloseECO.mq5 |
//|                                  Copyright 2024, MetaQuotes Ltd. |
//|                                             https://www.mql5.com |
//+------------------------------------------------------------------+
#property copyright "Copyright 2024, MetaQuotes Ltd."
#property link      "https://www.mql5.com"
#property version   "1.00"
#property indicator_chart_window
#property indicator_buffers 1
#property indicator_plots   1

//--- plot MA
#property indicator_label1  "SMA"
#property indicator_type1   DRAW_LINE
#property indicator_color1  clrRed
#property indicator_style1  STYLE_SOLID
#property indicator_width1  1

//--- input parameters
input int      InpPeriod   =  10;   // SMA Period

//--- indicator buffers
double         MABuffer[];

//--- global variables
int   ExtPeriod;  // SMA calculation period
//+------------------------------------------------------------------+
//| Custom indicator initialization function                         |
//+------------------------------------------------------------------+
int OnInit()
  {
//--- indicator buffers mapping
   SetIndexBuffer(0,MABuffer,INDICATOR_DATA);

//--- successful initialization
   return(INIT_SUCCEEDED);
  }
//+------------------------------------------------------------------+
//| Custom indicator iteration function                              |
//+------------------------------------------------------------------+
int OnCalculate(const int rates_total,
                const int prev_calculated,
                const datetime &time[],
                const double &open[],
                const double &high[],
                const double &low[],
                const double &close[],
                const long &tick_volume[],
                const long &volume[],
                const int &spread[])
  {
//--- Adjust the entered value of the SMA calculation period
   ExtPeriod=(InpPeriod<1 ? 10 : InpPeriod);

//--- If there is not enough historical data for calculation, return 0
   if(rates_total<ExtPeriod)
      return 0;

   int start=0;   // calculation start bar

//--- If this is the first run or a change in historical data
   if(prev_calculated==0)
     {
      //--- initialize the indicator buffer with an empty value and
      //--- set the start of the calculation to ExtPeriod
      ArrayInitialize(MABuffer,EMPTY_VALUE);
      start=ExtPeriod;
     }
//--- If this is not the first run, the calculation will start at the current bar
   else
      start=prev_calculated-1;

//--- in the loop from the 'start' value to the current history bar
   for(int i=start; i<rates_total; i++)
     {
      //--- calculate average close prices for ExtPeriod bars
      double result=0;
      for(int j=0; j<ExtPeriod; j++)
         result+=close[i-j];
      result/=ExtPeriod;

      //--- Write the calculation result to the buffer
      MABuffer[i]=result;
     }

//--- return the number of bars calculated for the next OnCalculate call
   return(rates_total);
  }
SMAonPriceCloseECO.mq5インジケーターファイルは、この記事に添付されたファイルの中にあります。
これでインジケーターを銘柄のチャート上で動かしても、「動作が遅い」というメッセージは表示されなくなりました。ですが、まだ一つ最適化の余地があります。現在のバーで計算をおこなう際、期間分のバーの平均価格を求めるループが毎回実行されている点です。単純移動平均(SMA)は、指定されたバー数の合計をその数で割ったものなので、このループを現在バーの計算時だけ省略できます。
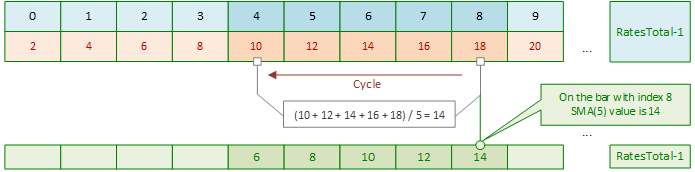
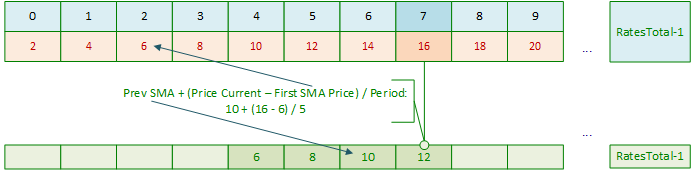
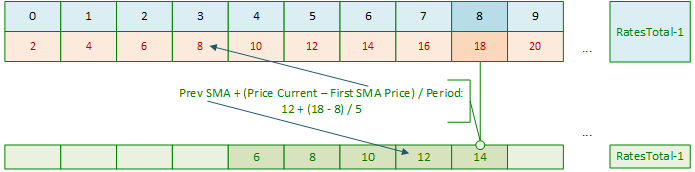
では、現状のSMAインジケーターが履歴上でどのように計算されているか見てみましょう。例として、計算期間が5バーの単純移動平均の計算開始部分を示します。
インジケーターの計算は、履歴の0番目のバーからではなく、SMA計算期間のバー数から1引いた位置(つまり「Period - 1」)のバーから開始されます。
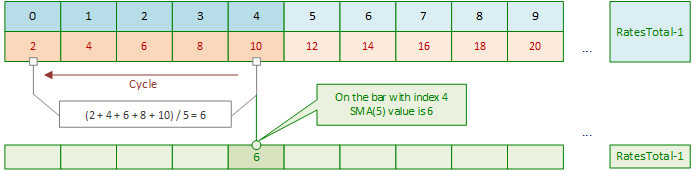
メインループはインデックス4のバーから始まります。このバーでのSMA値を計算するために、インデックス4、3、2、1、0のバーに対してループが実行されます。これらのバーの価格値を合計し、その合計をSMAの計算期間(ここでは5)で割ります。計算を分かりやすくするために、バーの価格値としてそれぞれ整数の2、4、6、8、10を例にしています。その結果、インデックス4のバーでのSMA値は「6 = (2+4+6+8+10)/5」になります。
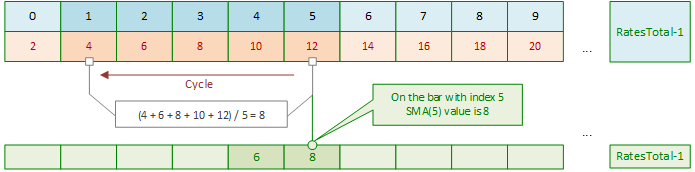
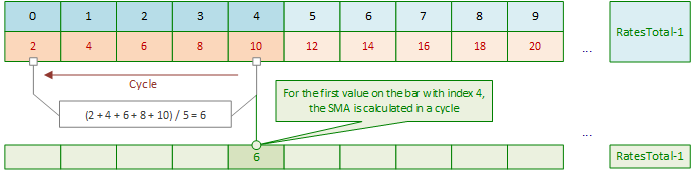
次に、メインのSMA計算ループのインデックスを1つ進めたバー(インデックス5)でのSMA値も同様にループで計算されます。
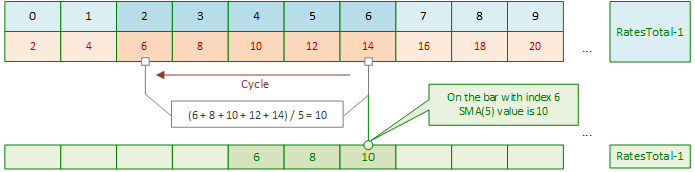
メインループの次の反復では、内部ループのインデックス6のバーのSMAが再度計算されます。
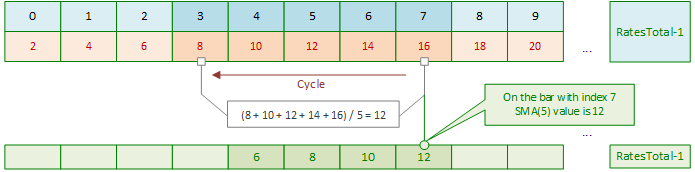
次に、同じパターンを繰り返します。メインループインデックスの各後続のシフトで、後続の各バーの内部ループでSMA値が計算されます。
メインループが現在のバーに到達するまで、これを繰り返します。
現在のバーでSMAを計算する際、新しいティックが来るたびに内部ループでSMAを計算しています。
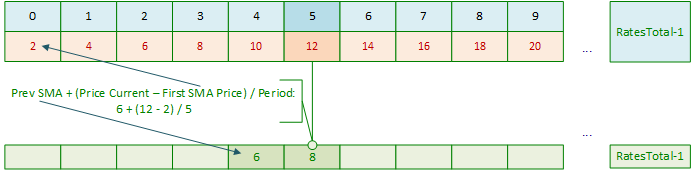
そもそもSMAとは、一定期間の価格の算術平均です。1本のバーのSMAを計算するには、前のPeriod本の価格の合計をPeriodで割れば良いことはすでに知っています。インジケーターを起動したときは、ループでPeriod本分の価格を足し合わせ、その合計をPeriodで割って最初のSMA値を計算します。 しかし、その後は、スライディングウィンドウ(移動窓)を右にずらす際に、毎回ループで価格を合計して割る必要はありません。なぜなら、前のバーのSMA値がすでに計算されているからです。
この値から平均値の計算に関係する最初の価格を差し引き、その結果に現在の価格を加算し、あらかじめ期間で割るだけで十分です。これで準備が整います。つまり、最初のSMAバーは、Period分の価格をループで加算し、その合計をPeriodの値で割ることで計算されます。その後は、足し算、引き算、割り算の算術演算だけで計算がおこなわれます。
最初のSMA値の計算
次に、メインループのインデックスをシフトするときに、次の計算を実行します。
新しいデータで繰り返します。
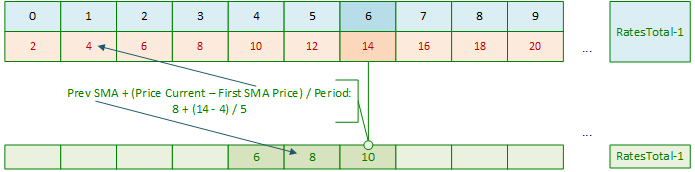
そしてメインループのインデックスの各オフセットで
前回計算されたSMA値から新しいSMA値を取得するたびに
次のインジケーターを考えてみましょう。
//+------------------------------------------------------------------+
//|                                              SMAonPriceClose.mq5 |
//|                                  Copyright 2024, MetaQuotes Ltd. |
//|                                             https://www.mql5.com |
//+------------------------------------------------------------------+
#property copyright "Copyright 2024, MetaQuotes Ltd."
#property link      "https://www.mql5.com"
#property version   "1.00"
#property indicator_chart_window
#property indicator_buffers 1
#property indicator_plots   1

//--- plot MA
#property indicator_label1  "SMA"
#property indicator_type1   DRAW_LINE
#property indicator_color1  clrRed
#property indicator_style1  STYLE_SOLID
#property indicator_width1  1

//--- input parameters
input int      InpPeriod   =  10;   // SMA Period

//--- indicator buffers
double         MABuffer[];

//--- global variables
int   ExtPeriod;  // SMA calculation period
//+------------------------------------------------------------------+
//| Custom indicator initialization function                         |
//+------------------------------------------------------------------+
int OnInit()
  {
//--- indicator buffers mapping
   SetIndexBuffer(0,MABuffer,INDICATOR_DATA);

//--- successful initialization
   return(INIT_SUCCEEDED);
  }
//+------------------------------------------------------------------+
//| Custom indicator iteration function                              |
//+------------------------------------------------------------------+
int OnCalculate(const int rates_total,
                const int prev_calculated,
                const datetime &time[],
                const double &open[],
                const double &high[],
                const double &low[],
                const double &close[],
                const long &tick_volume[],
                const long &volume[],
                const int &spread[])
  {
//--- Adjust the entered value of the SMA calculation period
   ExtPeriod=(InpPeriod<1 ? 10 : InpPeriod);

//--- If there is not enough historical data for calculation, return 0
   if(rates_total<ExtPeriod)
      return 0;

   int start=0;   // calculation start bar

//--- If this is the first run or a change in historical data
   if(prev_calculated==0)
     {
      //--- initialize the indicator buffer with an empty value,
      //--- set the start of the calculation to ExtPeriod and
      //--- calculate average close prices for ExtPeriod bars for the first SMA value on the start-1 bar
      ArrayInitialize(MABuffer,EMPTY_VALUE);
      start=ExtPeriod;
      double value=0;
      for(int i=0; i<start; i++)
         value+=close[i];
      MABuffer[start-1]=value/ExtPeriod;
     }
//--- If this is not the first run, the calculation will start at the current bar
   else
      start=prev_calculated-1;

//--- in the loop from the 'start' value to the current history bar
   for(int i=start; i<rates_total; i++)
     {
      //--- define prices for calculating SMA
      double ma_prev=MABuffer[i-1];             // Previous calculated SMA value
      double price_first=close[i-ExtPeriod];    // Close price ExtPeriod bars ago
      //--- Set the current SMA value to the buffer calculated as
      //--- (past SMA value + (current close price - close price ExtPeriod bars ago) / SMA ExtPeriod calculation period)
      MABuffer[i]=ma_prev+(close[i]-price_first)/ExtPeriod;
     }

//--- return the number of bars calculated for the next OnCalculate call
   return(rates_total);
  }
同じ計算期間を設定して、チャート上でこのインジケーターと標準のSMAを比較してみます。このインジケーターは、起動時にMAの計算期間分だけのループを一度だけ実行し、その後は最初に計算したSMA値を元に、メインループで履歴全体のSMA値を計算します。現在のバーでは、各ティックごとにSMA値の数学的な計算をおこないます。
以下がSMAonPriceClose.mq5インジケーターファイルです。
指数移動平均(EMA)
指数平滑移動平均は、現在の終値の一定割合を前回計算した移動平均値に加えることで算出されます。EMAでは、最新の終値がより重視されます。計算時には、計算に使われるバーの価格の重みが、平滑化定数k(1 > k > 0)によって指数関数的に減少します。通常、kは移動平均の計算期間Nを使って「k = 2.0 / (N + 1)」のように求められます。
EMAの特徴は以下の通りです。
- 価格変動に対して反応が速く、短期取引に適している
- 最新のデータを反映するため、トレンドや売買シグナルの識別に効果的である
- 他のEMA(例:50期間と200期間)のクロスオーバーで買い・売りポイントの判断に使われることが多い

図2:指数移動平均終値での指数移動平均(EMA)、計算期間10の場合
計算
Pパーセント指数移動平均は以下のように表されます。
EMA = (CLOSE(i) * P) + (EMA(i - 1) * (1 - P))
ここで
- CLOSE(i):現在の期間の終値
- EMA(i - 1):前期間の移動平均の値
- P:価格値を使用する割合(平滑化定数)
指数移動平均の計算を示す簡単なインジケーターを書いてみましょう。
//+------------------------------------------------------------------+
//|                                           EMAonPriceCloseRAW.mq5 |
//|                                  Copyright 2024, MetaQuotes Ltd. |
//|                                             https://www.mql5.com |
//+------------------------------------------------------------------+
#property copyright "Copyright 2024, MetaQuotes Ltd."
#property link      "https://www.mql5.com"
#property version   "1.00"
#property indicator_chart_window
#property indicator_buffers 1
#property indicator_plots   1
//--- plot MA
#property indicator_label1  "EMA"
#property indicator_type1   DRAW_LINE
#property indicator_color1  clrRed
#property indicator_style1  STYLE_SOLID
#property indicator_width1  1

//--- input parameters
input int      InpPeriod   =  10;   // EMA Period

//--- indicator buffers
double         MABuffer[];
//+------------------------------------------------------------------+
//| Custom indicator initialization function                         |
//+------------------------------------------------------------------+
int OnInit()
  {
//--- indicator buffers mapping
   SetIndexBuffer(0,MABuffer,INDICATOR_DATA);

//--- successful initialization
   return(INIT_SUCCEEDED);
  }
//+------------------------------------------------------------------+
//| Custom indicator iteration function                              |
//+------------------------------------------------------------------+
int OnCalculate(const int rates_total,
                const int prev_calculated,
                const datetime &time[],
                const double &open[],
                const double &high[],
                const double &low[],
                const double &close[],
                const long &tick_volume[],
                const long &volume[],
                const int &spread[])
  {
//--- in the loop from zero (the beginning of history) to the current bar
   for(int i=0; i<rates_total; i++)
     {
      double result=0;
      double smf=2.0/(InpPeriod+1.0);                       // smoothing factor
      double prev_value=(i>=1 ? MABuffer[i-1] : close[i]);  // previous calculated EMA value

      //--- calculate EMA based on the Close price of the bar, the previous EMA value and the smoothing factor
      result=close[i]*smf+prev_value*(1-smf);

      //--- Write the calculation result to the buffer
      MABuffer[i]=result;
     }
//--- return value of prev_calculated for the next call
   return(rates_total);
  }
単純移動平均と同様に、ここでは計算期間のチェックやリソース節約の計算処理を考慮せずにEMAの計算を示しています。初回起動時には利用可能な全履歴を計算し、その後はティックごとに再度全履歴を計算し直すため、「インジケーターが遅すぎる」というメッセージが表示されることになります。
EMAonPriceCloseRAW.mq5インジケーターは添付ファイルにあります。
計算の最適化
リソースを節約する計算を実装しましょう。初回起動時には履歴全体を計算し、その後は新しいティックごとに現在のバーのみを再計算する方法です。
//+------------------------------------------------------------------+
//|                                              EMAonPriceClose.mq5 |
//|                                  Copyright 2024, MetaQuotes Ltd. |
//|                                             https://www.mql5.com |
//+------------------------------------------------------------------+
#property copyright "Copyright 2024, MetaQuotes Ltd."
#property link      "https://www.mql5.com"
#property version   "1.00"
#property indicator_chart_window
#property indicator_buffers 1
#property indicator_plots   1
//--- plot MA
#property indicator_label1  "EMA"
#property indicator_type1   DRAW_LINE
#property indicator_color1  clrRed
#property indicator_style1  STYLE_SOLID
#property indicator_width1  1

//--- input parameters
input int      InpPeriod   =  10;   // EMA Period

//--- indicator buffers
double         MABuffer[];

//--- global variables
int   ExtPeriod;  // EMA calculation period
//+------------------------------------------------------------------+
//| Custom indicator initialization function                         |
//+------------------------------------------------------------------+
int OnInit()
  {
//--- indicator buffers mapping
   SetIndexBuffer(0,MABuffer,INDICATOR_DATA);

//--- successful initialization
   return(INIT_SUCCEEDED);
  }
//+------------------------------------------------------------------+
//| Custom indicator iteration function                              |
//+------------------------------------------------------------------+
int OnCalculate(const int rates_total,
                const int prev_calculated,
                const datetime &time[],
                const double &open[],
                const double &high[],
                const double &low[],
                const double &close[],
                const long &tick_volume[],
                const long &volume[],
                const int &spread[])
  {
//--- Adjust the entered value of the EMA calculation period
   ExtPeriod=(InpPeriod<1 ? 10 : InpPeriod);

//--- If there is not enough historical data for calculation, return 0
   if(rates_total<ExtPeriod)
      return 0;

   int start=0;   // calculation start bar

//--- If this is the first run or a change in historical data
   if(prev_calculated==0)
     {
      //--- initialize the indicator buffer with an empty value and set the start of the calculation to 0
      ArrayInitialize(MABuffer,EMPTY_VALUE);
      start=0;
     }
//--- If this is not the first run, the calculation will start at the current bar
   else
      start=prev_calculated-1;

//--- in the loop from the 'start' value to the current history bar
   for(int i=start; i<rates_total; i++)
     {
      double result=0;
      double smf=2.0/(ExtPeriod+1.0);                       // smoothing factor
      double prev_value=(i>=1 ? MABuffer[i-1] : close[i]);  // previous calculated EMA value

      //--- calculate the EMA value for the current loop bar
      result=close[i]*smf+prev_value*(1-smf);

      //--- Write the calculation result to the buffer
      MABuffer[i]=result;
     }

//--- return the number of bars calculated for the next OnCalculate call
   return(rates_total);
  }
計算期間の入力値が1未満の場合、移動平均のデフォルト値を10に設定します。
指数移動平均(EMA)の計算は、前のバーで計算済みのEMA値を使用します。
初回起動時は前回の計算値が存在しないため、代わりに終値を初期データとして使用します。
このインジケーターはリソース節約型の計算を実装しており、初回起動時に利用可能な全履歴を計算し、その後のOnCalculate呼び出し時には現在のバーのみを計算します。
以下がEMAonPriceClose.mq5インジケーターファイルです。
平滑移動平均(SMMA)
平滑移動平均(SMMA)は、単純移動平均(SMA)とは異なり、価格変動に対する感度が低く、価格の全体的な動きの方向性をより重視します。
SMMAの特徴は以下の通りです。
- SMAやEMAに比べて価格の変動に対して鈍感であり、より安定したトレンドの分析に適している
- 急激な価格変動を平滑化するため、長期分析に向いている
- より信頼性の高い売買シグナルの生成に利用できる
図3:平滑移動平均(SMMA)終値でのSMMA、計算期間10の場合
計算
平滑移動平均(SMMA)の最初の値は、単純移動平均(SMA)として計算されます。
SUM1  = SUM(CLOSE(i), N)
SMMA1 = SUM1 / N
2番目の移動平均は、次の式に従って計算されます。
SMMA(i) = (SMMA1*(N-1) + CLOSE(i)) / N移動平均のその後のすべての値は、次の式を使用して計算されます。
PREVSUM = SMMA(i - 1) * N
SMMA(i) =(PREVSUM - SMMA(i - 1) + CLOSE(i)) / N
ここで
- SUM:合計
- SUM1:前のバーから始まるN期間の終値の合計
- PREVSUM:前のバーの平滑化された合計
- SMMA(i-1):前のバーの平滑移動平均
- SMMA(i):現在のバーの平滑移動平均(最初のバーを除く)
- CLOSE(i):現在の終値
- N:平滑化期間
この式は算術変換を適用することで簡略化できます。
SMMA(i) = (SMMA(i - 1) * (N - 1) + CLOSE(i)) / N
平滑化移動平均(SMMA)を計算する簡単なインジケーターを記述してみましょう。
//+------------------------------------------------------------------+
//|                                          SMMAonPriceCloseRAW.mq5 |
//|                                  Copyright 2024, MetaQuotes Ltd. |
//|                                             https://www.mql5.com |
//+------------------------------------------------------------------+
#property copyright "Copyright 2024, MetaQuotes Ltd."
#property link      "https://www.mql5.com"
#property version   "1.00"
#property indicator_chart_window
#property indicator_buffers 1
#property indicator_plots   1

//--- plot MA
#property indicator_label1  "SMMA"
#property indicator_type1   DRAW_LINE
#property indicator_color1  clrRed
#property indicator_style1  STYLE_SOLID
#property indicator_width1  1

//--- input parameters
input int      InpPeriod=10;  // SMMA Period

//--- indicator buffers
double         MABuffer[];
//+------------------------------------------------------------------+
//| Custom indicator initialization function                         |
//+------------------------------------------------------------------+
int OnInit()
  {
//--- indicator buffers mapping
   SetIndexBuffer(0,MABuffer,INDICATOR_DATA);

//---
   return(INIT_SUCCEEDED);
  }
//+------------------------------------------------------------------+
//| Custom indicator iteration function                              |
//+------------------------------------------------------------------+
int OnCalculate(const int rates_total,
                const int prev_calculated,
                const datetime &time[],
                const double &open[],
                const double &high[],
                const double &low[],
                const double &close[],
                const long &tick_volume[],
                const long &volume[],
                const int &spread[])
  {
//---
   double result=0.0;
   for(int i=InpPeriod-1; i<rates_total; i++)
     {
      //--- first calculation
      if(i==InpPeriod-1)
        {
         //--- calculate a simple moving average for the InpPeriod first bars
         for(int j=0; j<InpPeriod; j++)
           {
            double price=close[i-j];
            result+=price;
           }
         result/=InpPeriod;
         //--- write the first displayed SMMA value calculated as SMA
         MABuffer[InpPeriod-1]=result;
        }
      //--- all subsequent calculations
      else
         result=(MABuffer[i-1]*(InpPeriod-1)+close[i])/InpPeriod;

      //--- Write the calculation result to the buffer
      MABuffer[i]=result;
     }
//--- return value of prev_calculated for the next call
   return(rates_total);
  }
このインジケーターは、初回起動時と新しいティックごとに利用可能な全履歴のバーをすべて計算してSMMAを表示しますが、これは最適ではなく動作も遅くなります。そのため、計算の最適化が必要です。
計算の最適化
計算の最適化としては、SMMA計算期間の入力値を適切に管理し、初回起動時に全履歴を一度だけ計算した後は、新しいティックごとに現在のバーのみを計算するようにします。
//+------------------------------------------------------------------+
//|                                             SMMAonPriceClose.mq5 |
//|                                  Copyright 2024, MetaQuotes Ltd. |
//|                                             https://www.mql5.com |
//+------------------------------------------------------------------+
#property copyright "Copyright 2024, MetaQuotes Ltd."
#property link      "https://www.mql5.com"
#property version   "1.00"
#property indicator_chart_window
#property indicator_buffers 1
#property indicator_plots   1
//--- plot MA
#property indicator_label1  "SMMA"
#property indicator_type1   DRAW_LINE
#property indicator_color1  clrRed
#property indicator_style1  STYLE_SOLID
#property indicator_width1  1

//--- input parameters
input int      InpPeriod=10;

//--- indicator buffers
double         MABuffer[];

//--- global variables
int   ExtPeriod;  // SMMA calculation period
//+------------------------------------------------------------------+
//| Custom indicator initialization function                         |
//+------------------------------------------------------------------+
int OnInit()
  {
//--- indicator buffers mapping
   SetIndexBuffer(0,MABuffer,INDICATOR_DATA);

//--- successful initialization
   return(INIT_SUCCEEDED);
  }
//+------------------------------------------------------------------+
//| Custom indicator iteration function                              |
//+------------------------------------------------------------------+
int OnCalculate(const int rates_total,
                const int prev_calculated,
                const datetime &time[],
                const double &open[],
                const double &high[],
                const double &low[],
                const double &close[],
                const long &tick_volume[],
                const long &volume[],
                const int &spread[])
  {
//--- Adjust the entered value of the SMMA calculation period
   ExtPeriod=(InpPeriod<1 ? 10 : InpPeriod);

//--- If there is not enough historical data for calculation, return 0
   if(rates_total<ExtPeriod)
      return 0;

   double result=0;
   int    start =0;

//--- If this is the first run or a change in historical data
   if(prev_calculated==0)
     {
      //--- initialize the indicator buffer with an empty value and set the start of the calculation to ExtPeriod
      ArrayInitialize(MABuffer,EMPTY_VALUE);
      start=ExtPeriod;

      //--- calculate a simple moving average for the ExtPeriod first bars
      for(int i=0; i<start; i++)
         result+=close[i];
      result/=ExtPeriod;
      //--- write the first displayed SMMA value calculated as SMA
      MABuffer[start-1]=result;
     }
   else
      start=prev_calculated-1;

//--- in the loop from the 'start' value to the current history bar
//--- calculate the SMMA value for the loop current bar
   for(int i=start; i<rates_total; i++)
      MABuffer[i]=(MABuffer[i-1]*(ExtPeriod-1)+close[i])/ExtPeriod;

//--- return the number of bars calculated for the next OnCalculate call
   return(rates_total);
  }
これでインジケーターは履歴と現在のバーを効率的に計算できるようになりました。以下がSMMAonPriceClose.mq5インジケーターのファイルです。
線形加重移動平均(LWMA)
加重移動平均の場合、最新のデータがより重要視されるため、LWMAは最近の価格変動に対してより敏感に反応します。この移動平均では、バーの価格の重みが線形に減少します。つまり、現在(インデックス0)のバーが最大の重みを持ち、N-1番目のバーは重みが0になります。
LWMAの特徴は以下の通りです。
- 従来のSMAよりも価格変動に対してより積極的に反応する
- 最新の変化が計算に最も大きな影響を与えるようデータを分析できる
- 特にボラティリティが高い状況でのトレーディング戦略の作成に役立つ
図4:終値での線形加重移動平均(LWMA)、計算期間10の場合
計算
加重移動平均は、対象となる終値それぞれに重み係数を掛け、その総和を重み係数の合計で割って求めます。
LWMA = SUM(CLOSE(i) * i, N) / SUM(i, N)
ここで
- SUM:合計
- CLOSE(i):現在の終値
- SUM(i, N):重み係数の合計
- N:平滑化期間
線形加重移動平均を計算して表示する簡単なインジケーターを書いてみましょう。
//+------------------------------------------------------------------+
//|                                          LWMAonPriceCloseRAW.mq5 |
//|                                  Copyright 2024, MetaQuotes Ltd. |
//|                                             https://www.mql5.com |
//+------------------------------------------------------------------+
#property copyright "Copyright 2024, MetaQuotes Ltd."
#property link      "https://www.mql5.com"
#property version   "1.00"
#property indicator_chart_window
#property indicator_buffers 1
#property indicator_plots   1
//--- plot MA
#property indicator_label1  "LWMA"
#property indicator_type1   DRAW_LINE
#property indicator_color1  clrRed
#property indicator_style1  STYLE_SOLID
#property indicator_width1  1
//--- input parameters
input int      InpPeriod=10;  // LWMA Period
//--- indicator buffers
double         MABuffer[];
//+------------------------------------------------------------------+
//| Custom indicator initialization function                         |
//+------------------------------------------------------------------+
int OnInit()
  {
//--- indicator buffers mapping
   SetIndexBuffer(0,MABuffer,INDICATOR_DATA);

//---
   return(INIT_SUCCEEDED);
  }
//+------------------------------------------------------------------+
//| Custom indicator iteration function                              |
//+------------------------------------------------------------------+
int OnCalculate(const int rates_total,
                const int prev_calculated,
                const datetime &time[],
                const double &open[],
                const double &high[],
                const double &low[],
                const double &close[],
                const long &tick_volume[],
                const long &volume[],
                const int &spread[])
  {
//--- in the loop from InpPeriod-1 to the current bar
   double result=0.0;
   for(int i=InpPeriod-1; i<rates_total; i++)
     {
      //--- calculate weights (wsum) and the sum of weight coefficients (sum) of InpPeriod bars
      double sum =0.0;
      int    wsum=0;
      for(int j=InpPeriod; j>0; j--)
        {
         wsum+=j;
         sum +=close[i-j+1]*(InpPeriod-j+1);
        }
      //--- get the LWMA value for the current bar of the loop
      result=sum/wsum;
      //--- Write the calculation result to the buffer
      MABuffer[i]=result;
     }
//--- return value of prev_calculated for the next call
   return(rates_total);
  }
このインジケーターは、履歴の各バーについてLWMAの計算結果をチャート上に表示しますが、新しいティックごとに全履歴を再計算するため非常に遅く、非効率です。そこで、計算をリソース節約型に最適化し、入力値のチェックも追加しましょう。
LWMAonPriceCloseRAW.mq5インジケーターファイルは、この記事に添付されたファイル内にあります。
計算の最適化
インジケーターの計算を最適化して、新しいティックごとに全履歴を再計算しないようにし、さらにLWMAの計算期間の入力値が妥当かどうかをチェックする機能を追加します。
//+------------------------------------------------------------------+
//|                                             LWMAonPriceClose.mq5 |
//|                                  Copyright 2024, MetaQuotes Ltd. |
//|                                             https://www.mql5.com |
//+------------------------------------------------------------------+
#property copyright "Copyright 2024, MetaQuotes Ltd."
#property link      "https://www.mql5.com"
#property version   "1.00"
#property indicator_chart_window
#property indicator_buffers 1
#property indicator_plots   1
//--- plot MA
#property indicator_label1  "LWMA"
#property indicator_type1   DRAW_LINE
#property indicator_color1  clrRed
#property indicator_style1  STYLE_SOLID
#property indicator_width1  1

//--- input parameters
input int      InpPeriod   =  10;   // LWMA Period

//--- indicator buffers
double         MABuffer[];

//--- global variables
int   ExtPeriod;  // LWMA calculation period
//+------------------------------------------------------------------+
//| Custom indicator initialization function                         |
//+------------------------------------------------------------------+
int OnInit()
  {
//--- indicator buffers mapping
   SetIndexBuffer(0,MABuffer,INDICATOR_DATA);

//--- successful initialization
   return(INIT_SUCCEEDED);
  }
//+------------------------------------------------------------------+
//| Custom indicator iteration function                              |
//+------------------------------------------------------------------+
int OnCalculate(const int rates_total,
                const int prev_calculated,
                const datetime &time[],
                const double &open[],
                const double &high[],
                const double &low[],
                const double &close[],
                const long &tick_volume[],
                const long &volume[],
                const int &spread[])
  {
//--- Adjust the entered value of the LWMA calculation period
   ExtPeriod=(InpPeriod<1 ? 10 : InpPeriod);

//--- If there is not enough historical data for calculation, return 0
   if(rates_total<ExtPeriod)
      return 0;

   double result=0;
   int    start =0;

//--- If this is the first run or a change in historical data
   if(prev_calculated==0)
     {
      //--- initialize the indicator buffer with an empty value and set the start of the calculation to ExtPeriod-1
      ArrayInitialize(MABuffer,EMPTY_VALUE);
      start=ExtPeriod-1;
     }
//--- If this is not the first run, the calculation will start at the current bar
   else
      start=prev_calculated-1;

//--- in the loop from the 'start' value to the current history bar
//--- calculate the LWMA value for the loop current bar
   for(int i=start; i<rates_total; i++)
     {
      //--- calculate weights (wsum) and the sum of weight coefficients (sum) of ExtPeriod bars
      double sum =0.0;
      int    wsum=0;
      for(int j=ExtPeriod; j>0; j--)
        {
         wsum+=j;
         sum +=close[i-j+1]*(ExtPeriod-j+1);
        }
      //--- get the LWMA value for the current bar of the loop
      result=sum/wsum;
      //--- Write the calculation result to the buffer
      MABuffer[i]=result;
     }

//--- return the number of bars calculated for the next OnCalculate call
   return(rates_total);
  }
インジケーターのリソース節約型計算の原理については、単純移動平均の最適化に関するセクションで詳しく説明されています。
インジケーターファイルは以下に添付されています。
4種類の移動平均線の長所と短所
時とともに、単純移動平均(SMA)、指数移動平均(EMA)、平滑移動平均(SMMA)、線形加重移動平均(LWMA)など、様々なタイプの移動平均が登場しました。これらはそれぞれ独自の計算方法を持ち、一部はSMAを基にしながら異なる目的で使われています。分析するデータに新たな視点をもたらすこともあります。
以下に、基本的な4つの移動平均の長所と短所をまとめます。
- SMA(単純移動平均)は、トレンドの大まかな方向性を判断したり、サポート・レジスタンスを特定したりする際によく使われます。価格変動を平滑化し全体の流れが見やすいため、長期トレーダーや投資家に人気です。
長所- 計算・解釈が簡単
- 価格変動を平滑化し、トレンドを明確に示す
- 長期トレンドの把握に有効
短所- 変化への反応が遅く、シグナルが遅延しやすい
- 計算期間中の価格に均等に反応(重みがすべて同じ)するため、新しい価格変動への感度が低い
- MA(指数移動平均)は最新の価格により大きな重みを置くため、価格変動への反応が速く、短期取引やスキャルピングに向いています。素早いエントリー・エグジットのシグナルを求めるトレーダーに好まれます。
長所- 最新データに重みがあるため変化への反応が速い
- 他のインジケーターと組み合わせて使われることが多く、精度の高いシグナルを提供
- 現在のトレンドをよりリアルタイムに反映
短所- 急激な値動きでは偽シグナルが出やすい
- SMAより計算が複雑
- SMMA(平滑移動平均)はSMAやEMAの中間的な性質を持ち、急激な変動を避けつつ情報の鮮度を保ちます。偽シグナルを避けたいトレーダーやトレンド分析・確認に適しています。
長所- SMAやEMAより滑らかにデータを平滑化
- 変動に対して鈍感で、ボラティリティの高い市場に有用
- 過去の値も保持し、トレンド分析に役立つ
短所- 変化に対する反応はSMA同様遅くなることがある
- トレンド検出に遅れが生じる可能性がある
- LWMA(線形加重移動平均)は各価格に異なる重みを線形に付与し、新しいデータほど重みが大きくなります。複数の時間軸を使った戦略や、変化に素早く反応したい場合に適しています。
長所- 最新価格に強く反応し、直近の変化を正確に反映
- SMAやEMAより柔軟で、最新データへの応答性が高い
- 短期戦略に向いている
短所- SMAやEMAと比べ計算が複雑
- ボラティリティが高い市場では偽シグナルも発生しやすい
結論
クライアント端末の標準の移動平均インジケーターの設定で利用できる主な移動平均の計算原理を確認しました。この記事で紹介した計算方法は、計算の最適化を施したインジケーターにも応用でき(最適化例も併せて紹介しています)、また提示したコードは連続データの平均値を独立して計算するプログラムにも活用可能です。
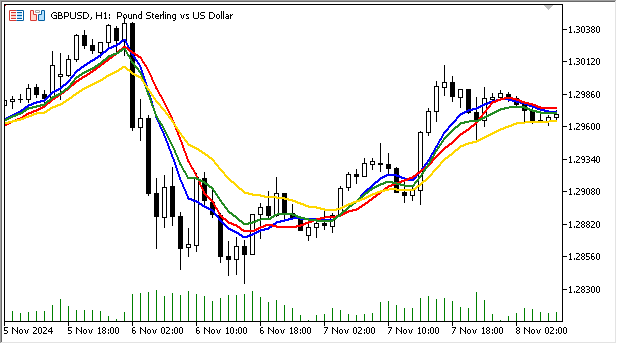
上図は、計算期間が同じ(10)、異なる種類の移動平均の違いを示しています。
赤:SMA、緑:EMA、金色:SMMA、青:LWMA
平滑移動平均(SMMA)は小さな価格変動の影響を受けにくく、価格の全体的なトレンドをより明確に示しています。
一方、指数移動平均(EMA)や線形加重移動平均(LWMA)は、計算で現在のデータに大きな重みを置くため、市場の変動に対してより敏感に反応します。
すべてをまとめてみましょう。
移動平均(SMA)は時系列データを分析し平滑化する統計的手法であり、トレンドや短期的な方向性、動的なサポート・レジスタンスレベル、チャネルの境界線などを把握するために使われます。移動平均の概念は20世紀初頭に遡り、経済学者や技術者がデータ分析や将来値の予測に活用していました。興味深いことに、第二次世界大戦中には対空砲の照準にもSMAの計算方法が使われていたと言われています。
移動平均は特に20世紀半ばの株式市場の発展に伴い、金融分析で広く使われるようになりました。投資家は株価の変動を平滑化し長期トレンドを見極める方法を求め、移動平均はトレーダーやアナリスト双方にとって標準的なテクニカル分析ツールとなりました。
同じ計算期間でも種類の異なる移動平均は、同一チャート上で異なる描画結果を示します。
- SMAは滑らかでサポートやレジスタンスのレベルを示しますが、反応が遅れがち
- EMAは価格により密接に追従し、トレンド変化への反応が速い
- SMMAはSMAより滑らかで、急激な変化への反応は控えめ
- LWMAは変化に素早く反応するが、EMAやSMMAと比べてやや変動が激しい
どのタイプの移動平均を使うかは、戦略や市場環境によって異なります。取引目的や時間軸、資産のボラティリティを考慮して選ぶことが重要となります。多くのトレーダーは複数の種類の移動平均を組み合わせて、分析の効率を最大化しています。
添付ファイル
| # | 種類 | 名前 | 説明 |
|---|---|---|---|
| 1 | インジケーター | SMAonPriceCloseRAW.mq5 | SMA計算例(大まかな計算のみ、リソース節約計算なし、最適化なし) |
| 2 | インジケーター | SMAonPriceCloseECO.mq5 | SMA計算インジケーター(リソース節約計算、最適化なし) |
| 3 | インジケーター | SMAonPriceClose.mq5 | SMA計算インジケーター(リソース節約計算、最適化) |
| 4 | インジケーター | EMAonPriceCloseRAW.mq5 | EMA計算例(大まかな計算のみ、リソース節約計算なし) |
| 5 | インジケーター | EMAonPriceClose.mq5 | EMA計算インジケーター(リソース節約計算) |
| 6 | インジケーター | SMMAonPriceCloseRAW.mq5 | SMMAの計算例(大まかな計算のみ、リソース節約計算なし) |
| 7 | インジケーター | SMMAonPriceClose.mq5 | SMMA計算インジケーター(リソース節約計算) |
| 8 | インジケーター | LWMAonPriceCloseRAW.mq5 | LWMA計算例(大まかな計算のみ、リソース節約計算なし) |
| 9 | インジケーター | LWMAonPriceClose.mq5 | LWMA計算インジケーター(リソース節約計算) |
MetaQuotes Ltdによってロシア語から翻訳されました。
元の記事: https://www.mql5.com/ru/articles/16308
警告: これらの資料についてのすべての権利はMetaQuotes Ltd.が保有しています。これらの資料の全部または一部の複製や再プリントは禁じられています。
この記事はサイトのユーザーによって執筆されたものであり、著者の個人的な見解を反映しています。MetaQuotes Ltdは、提示された情報の正確性や、記載されているソリューション、戦略、または推奨事項の使用によって生じたいかなる結果についても責任を負いません。

 初級から中級まで:共用体(II)
- 無料取引アプリ
- 8千を超えるシグナルをコピー
- 金融ニュースで金融マーケットを探索
良い記事をありがとう。でも、批判せずにはいられない。今日はそんな気分なのだ。
この記事は、コーディングというより、計算式や計算の最適化に特別な注意を払っている。しかし、初心者のプログラマーや、最近さまざまなループ演算子を使う可能性に注目し始めた人たちには、より役に立つと思う。次回の記事にはそれを反映させたいと思っている。結局のところ、MQL5には少なくとも3つのループ演算子がある。そしてそのどれを使ってもインジケーターを構築することができる。
有用な情報を一度にまとめて、
そして最後にi++ループ
標準的な4つのMQ平均の背後にあるコードを示す初心者向けの良い記事です。
また、単純な最適化の重要性と、ティックの 99% がバーが変わる間に発生するため、その影響についても説明する必要があります。 各バーが変わる間の計算を最小化することで、少し複雑になりますが、はるかに高い効率が得られます。 したがって、バーが変わるときに基本値を一度計算し、その値を保存することで、計算時間が大幅に短縮されます:
次のように考える。
double sm=0;
for(int bar=0;bar<N;bar++) sum+=Close[CurrentBar-bar];
SMA=sum/N;
対
static double partialsum;
double sum=0;
バーの変化{について
partialsum=0;
for(int bar=0;bar<N-1;bar++) partialsum+=Close[CurrentBar-bar];
partialsum/=(N-1);
}
SMA =partialsum+Close[CurrentBar]/N;
この最適化により、各バーでsum+=Close[EndingBar-bar]の計算が約90,000回節約されます。 チャートに1,000本のバーが含まれる場合、90,000,000回以上の不要な計算が 節約されることになります。 最近のCPUでは、この例で節約されることは些細なことであり、おそらく気づきません。
手作業による最適化の重要性は、より良いプログラミング技術を開発することであり、それが将来のプロジェクトで 自然に身につくようになることです。
しかし、OnCalculate()関数を使用した後、なぜOrderSend()トランザクション関数を使用できなくなったのかが不明です。著者がこの問題をどのように解決したのか分かりません: