Mercaria Professional Trading Zones

## ONLY GOLD
## Тiльки Золото

## **Mercaria Professional Trading Zones - Complete Guide**
## **Mercaria Professional Trading Zones - Повний посібник**

### **How Mercaria Zones Work / Як працюють зони Mercaria**

**English:**
Mercaria Zones is an advanced trading indicator that identifies high-probability support and resistance areas using ZigZag extremes combined with mathematical zone calculations. The indicator works on multiple timeframes simultaneously, providing a comprehensive view of market structure and potential reversal points.

**Українська:**
Mercaria Zones - це вдосконалений торговий індикатор, який визначає високоймовірні області підтримки та опору, використовуючи екстремуми ZigZag в поєднанні з математичними розрахунками зон. Індикатор працює на кількох таймфреймах одночасно, забезпечуючи всебічний погляд на структуру ринку та потенційні точки розвороту.

---

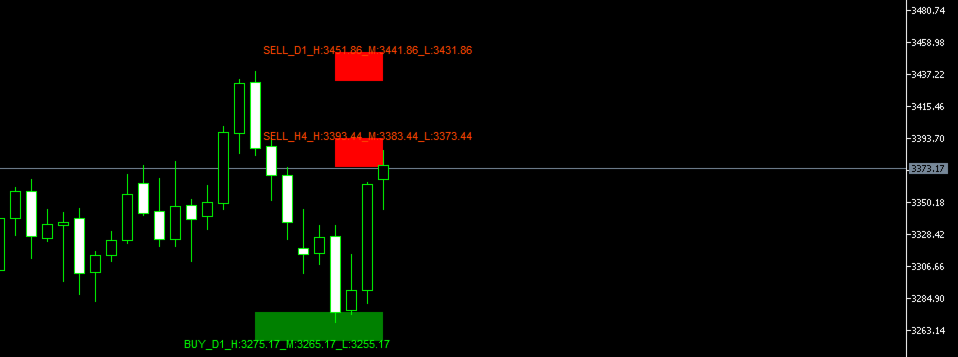
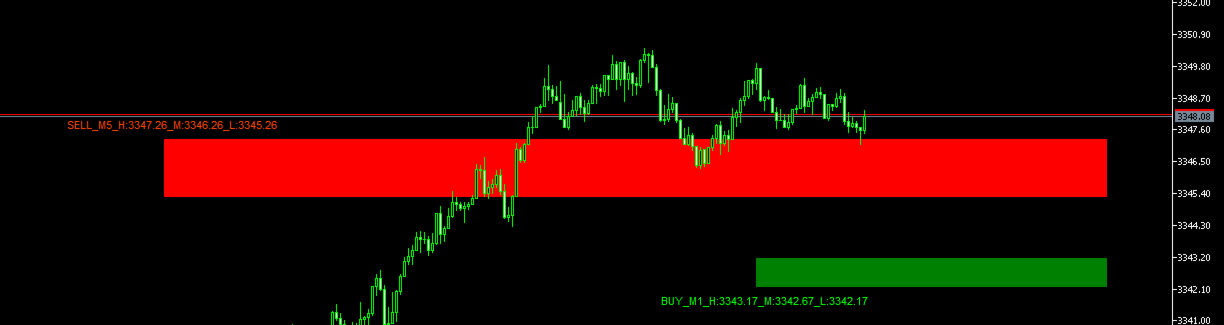
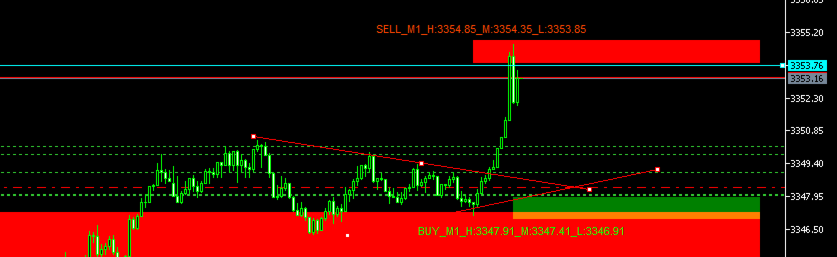
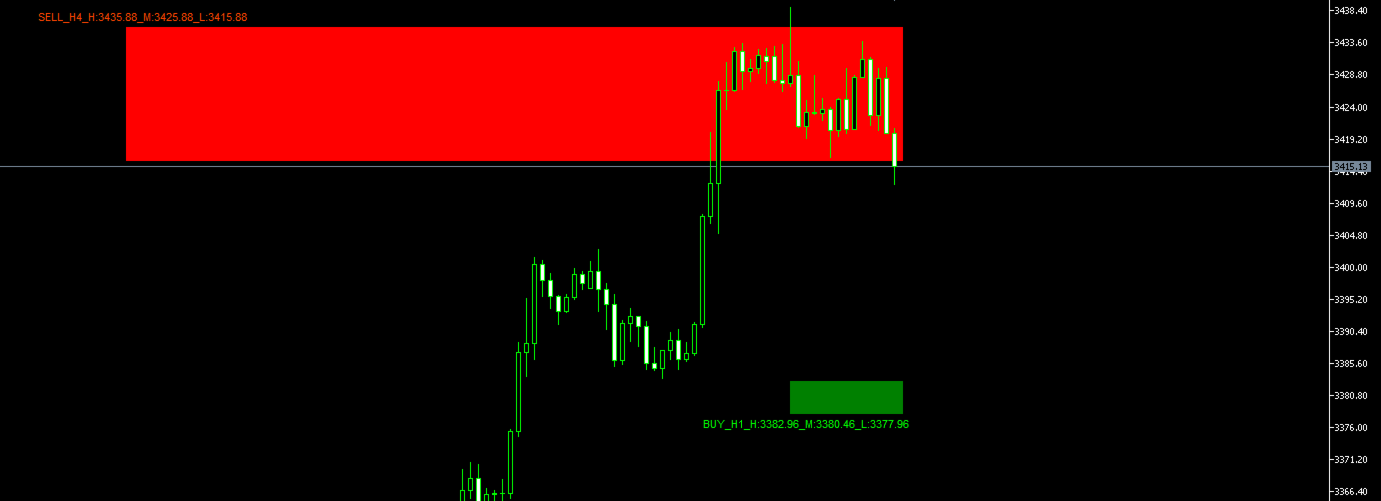
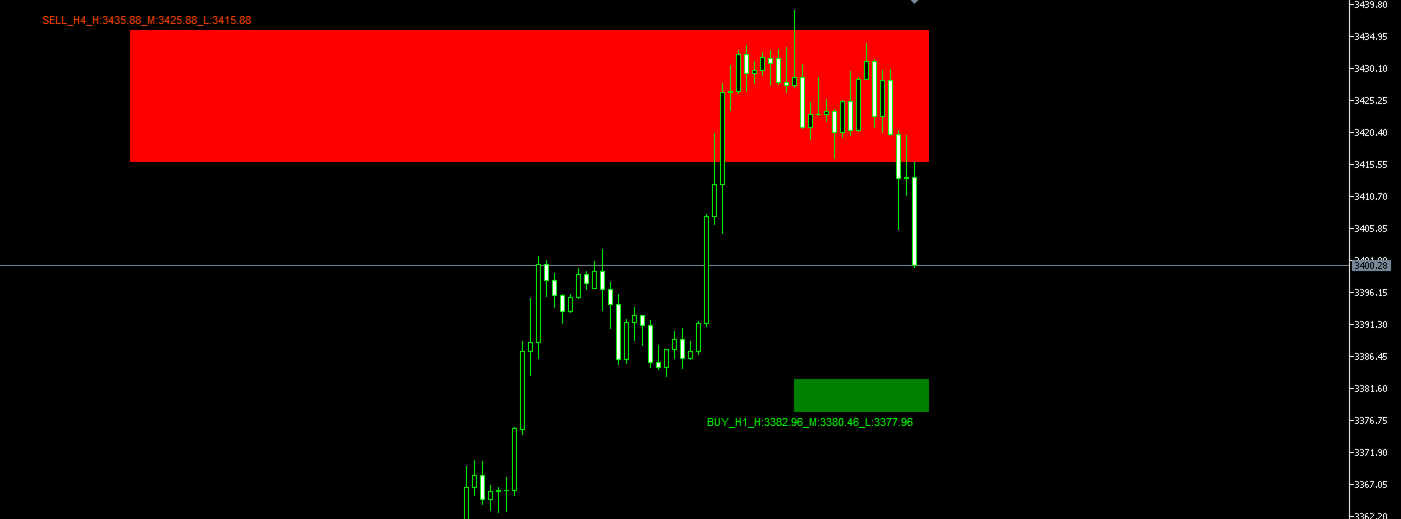
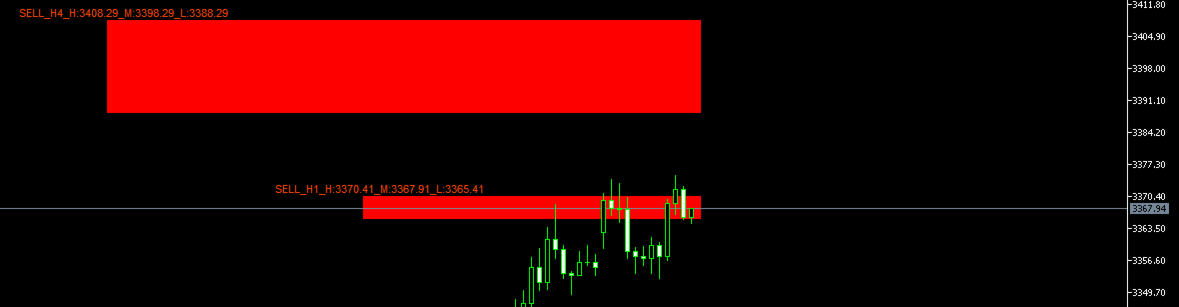
### **1. Zone Description / Опис зон**

**Support Zones (Green) / Зони підтримки (зелені):**
- English: Built around ZigZag low points using accumulation-impulse phases. These zones represent areas where institutional buyers historically accumulated positions, creating strong demand levels. Green zones indicate potential buying opportunities where price may bounce upward from support.
- Українська: Побудовані навколо мінімумів ZigZag з використанням фаз накопичення-імпульсу. Ці зони представляють області, де інституційні покупці історично накопичували позиції, створюючи сильні рівні попиту. Зелені зони вказують на потенційні можливості покупки, де ціна може відскочити вгору від підтримки.

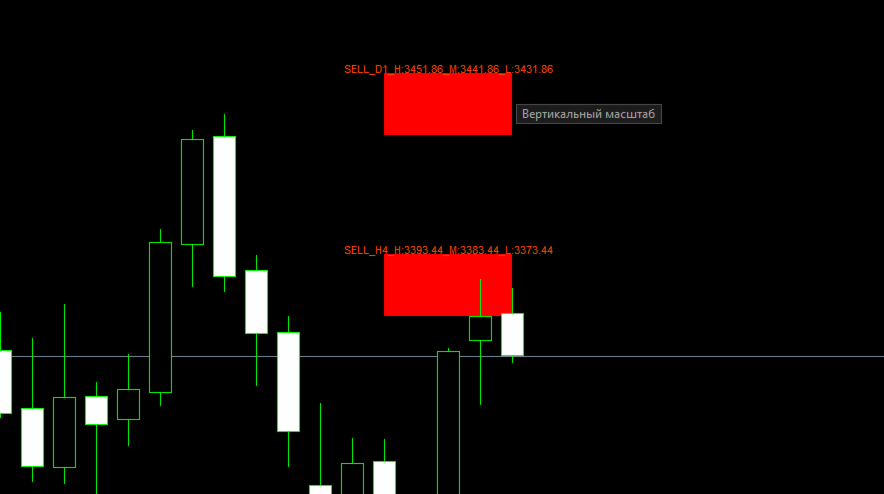
**Resistance Zones (Red) / Зони опору (червоні):**
- English: Formed around ZigZag high points during distribution-impulse phases. These areas show where institutional sellers historically distributed their positions, creating strong supply levels. Red zones suggest potential selling opportunities where price may reverse downward from resistance.
- Українська: Утворені навколо максимумів ZigZag під час фаз розподілу-імпульсу. Ці області показують, де інституційні продавці історично розподіляли свої позиції, створюючи сильні рівні пропозиції. Червоні зони вказують на потенційні можливості продажу, де ціна може розвернутися вниз від опору.

---

### **2. Multi-Timeframe "Matryoshka" Principle / Принцип багатотаймфреймової "матрьошки"**

**Higher Timeframes (H4/D1) / Вищі таймфрейми (H4/D1):**
- English: Provide broad structural zones with high reliability but wider ranges. These zones act as major support/resistance levels that can hold for days or weeks. They offer lower risk entries but require larger stop-losses and longer holding periods.
- Українська: Забезпечують широкі структурні зони з високою надійністю, але ширшими діапазонами. Ці зони діють як основні рівні підтримки/опору, які можуть тримати днями або тижнями. Вони пропонують входи з нижчим ризиком, але вимагають більших стоп-лоссів та довших періодів утримання.

**Medium Timeframes (H1/M30) / Середні таймфрейми (H1/M30):**
- English: Refine the broader zones by providing more precise entry areas within major levels. These zones help identify the exact moments when price approaches key levels, offering better risk-to-reward ratios while maintaining good reliability.
- Українська: Уточнюють ширші зони, забезпечуючи більш точні області входу всередині основних рівнів. Ці зони допомагають визначити точні моменти, коли ціна наближається до ключових рівнів, пропонуючи кращі співвідношення ризику до прибутку при збереженні хорошої надійності.

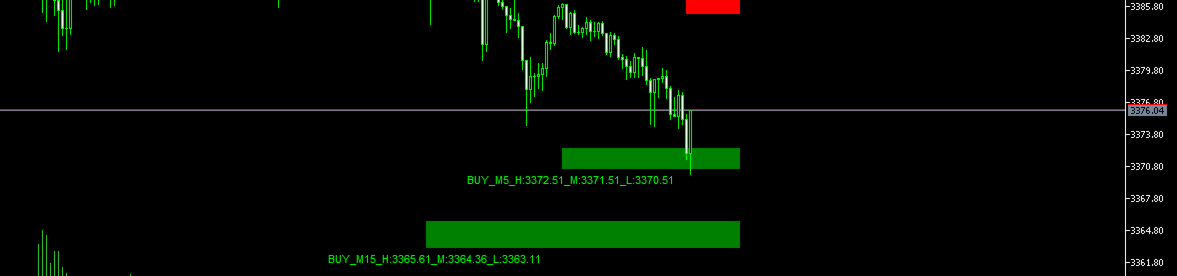
**Lower Timeframes (M15/M5/M1) / Нижчі таймфрейми (M15/M5/M1):**
- English: Form precise entry points for quick trades and scalping. These zones provide exact timing for entries when price reaches confluence areas. Perfect for day traders and scalpers who need tight stops and quick profits.
- Українська: Формують точні точки входу для швидких угод та скальпінгу. Ці зони забезпечують точний тайминг для входів, коли ціна досягає областей збігу. Ідеально підходять для денних трейдерів та скальперів, які потребують жорстких стопів та швидких прибутків.

---

### **3. Step-by-Step Trading Algorithm / Покроковий торговий алгоритм**

**Step A: Base Zone Selection (D1/H4) / Крок А: Вибір базової зони (D1/H4)**
- English: Identify the primary market structure using daily or 4-hour zones. Look for zones that align with major trend direction and have not been broken recently. These zones should show clear institutional interest with multiple touches or strong reactions in the past.
- Українська: Визначте первинну структуру ринку, використовуючи денні або 4-годинні зони. Шукайте зони, які збігаються з основним напрямком тренду і не були порушені останнім часом. Ці зони повинні показувати чіткий інституційний інтерес з кількома дотиками або сильними реакціями в минулому.

**Step B: Signal Refinement (H1/M15) / Крок Б: Уточнення сигналу (H1/M15)**
- English: Wait for price to approach the identified D1/H4 zone, then switch to H1 or M15 to look for confluence. Confirm that medium timeframe zones align with higher timeframe zones. Look for additional confluence factors like trend lines, Fibonacci levels, or candlestick patterns.
- Українська: Дочекайтеся, поки ціна наблизиться до визначеної зони D1/H4, потім переключіться на H1 або M15, щоб шукати збіг. Підтвердіть, що зони середніх таймфреймів збігаються з зонами вищих таймфреймів. Шукайте додаткові фактори збігу, такі як лінії тренду, рівні Фібоначчі або свічкові патерни.

**Step C: Entry Timing (M5/M1) / Крок В: Тайминг входу (M5/M1)**
- English: Use lower timeframes for precise entry execution. Enter when price reaches the zone edge and shows signs of rejection (reversal candlesticks, volume spike, or momentum divergence). Wait for confirmation before entering to avoid false signals.
- Українська: Використовуйте нижчі таймфрейми для точного виконання входу. Входьте, коли ціна досягає краю зони і показує ознаки відмови (розворотні свічки, сплеск об'єму або дивергенція моментуму). Дочекайтеся підтвердження перед входом, щоб уникнути хибних сигналів.

**Step D: Stop-Loss Placement / Крок Г: Розміщення стоп-лосу**
- English: Place stop-loss beyond the zone boundaries with additional buffer for market noise. For buy trades, place stops below the green zone's lower edge. For sell trades, place stops above the red zone's upper edge. Add 10-20 pips buffer depending on instrument volatility.
- Українська: Розмістіть стоп-лосс за межами зон з додатковим буфером для ринкового шуму. Для угод на покупку розміщуйте стопи нижче нижнього краю зеленої зони. Для угод на продаж розміщуйте стопи вище верхнього краю червоної зони. Додайте буфер 10-20 піпсів залежно від волатильності інструменту.

**Step E: Take-Profit Targeting / Крок Д: Цілі тейк-профіту**
- English: Set take-profit targets at the next opposing zone or major resistance/support level. Use risk-to-reward ratio of at least 1:2. For aggressive traders, partial profits can be taken at intermediate levels, while letting remaining position run to major targets.
- Українська: Встановіть цілі тейк-профіту на наступній протилежній зоні або основному рівні опору/підтримки. Використовуйте співвідношення ризику до прибутку принаймні 1:2. Для агресивних трейдерів частковий прибуток можна брати на проміжних рівнях, дозволяючи решті позиції дійти до основних цілей.

**Step F: Trend and Volume Filtering / Крок Е: Фільтрація за трендом та об'ємом**
- English: Only trade zones that align with the overall trend direction for higher probability setups. In uptrends, focus on green (support) zones for buying opportunities. In downtrends, focus on red (resistance) zones for selling opportunities. Confirm zone validity with volume analysis - strong zones should show increased volume when tested.
- Українська: Торгуйте тільки зонами, які збігаються з загальним напрямком тренду для налаштувань з вищою ймовірністю. В висхідних трендах зосереджуйтеся на зелених (підтримка) зонах для можливостей покупки. В низхідних трендах зосереджуйтеся на червоних (опір) зонах для можливостей продажу. Підтверджуйте валідність зон аналізом об'єму - сильні зони повинні показувати збільшений об'єм при тестуванні.

---

### **Advanced Tips for Market Success / Розширені поради для успіху на ринку**

**English:**
- Never trade against major trend without strong confluence
- Wait for at least 2-3 timeframe confirmation before entering
- Use position sizing based on zone strength and timeframe
- Monitor multiple TF currency for correlation
- Keep detailed trading journal with zone performance statistics

**Українська:**
- Ніколи не торгуйте проти основного тренду без сильного збігу
- Дочекайтеся принаймні 2-3 підтверджень таймфреймів перед входом
- Використовуйте розмір позиції на основі сили зони та таймфрейму
- Відстежуйте кілька таймреймiв на рiзних чартах для кореляції
- Ведіть детальний торговий журнал зі статистикою продуктивності зон


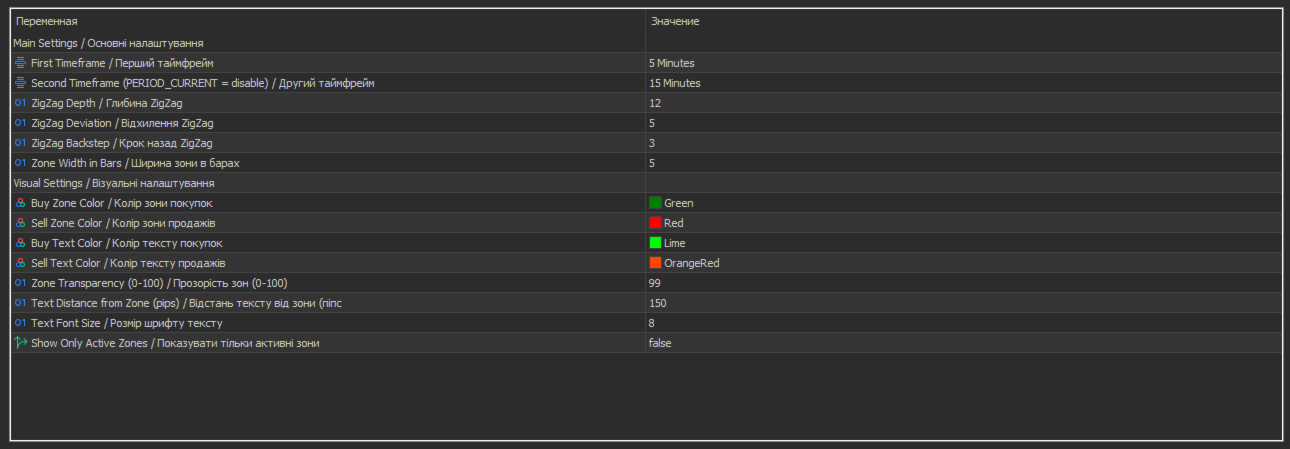
## **Main Settings / Основні налаштування**

**TF1 - First Timeframe / Перший таймфрейм:**
- English: Primary timeframe for zone calculation. Higher timeframes (H4, D1) create wider zones with stronger support/resistance levels. Lower timeframes (M1, M5) create more precise but potentially weaker zones.
- Українська: Основний таймфрейм для розрахунку зон. Вищі таймфрейми (H4, D1) створюють ширші зони з сильнішими рівнями підтримки/опору. Нижчі таймфрейми (M1, M5) створюють точніші але потенційно слабші зони.

**TF2 - Second Timeframe / Другий таймфрейм:**
- English: Additional timeframe for multi-timeframe analysis. Shows zones from higher timeframe for confluence. Set to PERIOD_CURRENT to disable second timeframe completely.
- Українська: Додатковий таймфрейм для мульти-таймфрейм аналізу. Показує зони з вищого таймфрейму для підтвердження. Встановіть PERIOD_CURRENT щоб повністю вимкнути другий таймфрейм.

**ZigZag Depth / Глибина ZigZag:**
- English: Minimum number of bars between ZigZag extremes. Higher values = less sensitive, fewer but stronger signals. Lower values = more sensitive, more signals but potentially more noise.
- Українська: Мінімальна кількість барів між екстремумами ZigZag. Більші значення = менш чутливий, менше але сильніші сигнали. Менші значення = більш чутливий, більше сигналів але потенційно більше шуму.

**ZigZag Deviation / Відхилення ZigZag:**
- English: Minimum price movement in points to create new ZigZag line. Higher values filter out small price movements, creating cleaner zones. Lower values catch smaller reversals.
- Українська: Мінімальний рух ціни в пунктах для створення нової лінії ZigZag. Більші значення фільтрують малі рухи ціни, створюючи чистіші зони. Менші значення ловлять менші розвороти.

**ZigZag Backstep / Крок назад ZigZag:**
- English: Prevents creation of close extremes by looking back this many bars. Higher values create smoother ZigZag lines but may miss some reversals. Lower values are more reactive.
- Українська: Запобігає створенню близьких екстремумів, дивлячись назад на стільки барів. Більші значення створюють плавніші лінії ZigZag але можуть пропустити деякі розвороти. Менші значення більш реактивні.

**Zone Width in Bars / Ширина зони в барах:**
- English: How many bars forward the zone rectangles extend from the ZigZag point. Affects visual duration of zones on chart. Higher values = zones visible longer.
- Українська: На скільки барів вперед поширюються прямокутники зон від точки ZigZag. Впливає на візуальну тривалість зон на графіку. Більші значення = зони видимі довше.

## **Visual Settings / Візуальні налаштування**

**Buy/Sell Zone Colors / Кольори зон покупок/продажів:**
- English: Background colors for trading zones. Buy zones appear around ZigZag lows (support), Sell zones around ZigZag highs (resistance). Choose contrasting colors for clarity.
- Українська: Фонові кольори торгових зон. Зони покупок з'являються навколо мінімумів ZigZag (підтримка), зони продажів навколо максимумів ZigZag (опір). Оберіть контрастні кольори для ясності.

**Buy/Sell Text Colors / Кольори тексту покупок/продажів:**
- English: Colors for zone labels showing price levels. Should contrast well with zone background colors and chart background for readability.
- Українська: Кольори підписів зон, що показують цінові рівні. Повинні добре контрастувати з кольорами фону зон і фоном графіка для читабельності.

**Zone Transparency / Прозорість зон:**  
- English: 0 = completely solid zones, 100 = invisible zones. 50-70 recommended for good visibility without hiding price action behind zones.
- Українська: 0 = повністю непрозорі зони, 100 = невидимі зони. Рекомендується 50-70 для хорошої видимості без приховування цінової дії за зонами.

**Text Distance from Zone / Відстань тексту від зони:**
- English: Distance in pips between zone edge and label text. Higher values place labels further from zones. Adjust based on instrument's typical pip range.
- Українська: Відстань в піпсах між краєм зони і текстом підпису. Більші значення розміщують підписи далі від зон. Налаштовуйте відповідно до типового діапазону піпсів інструменту.

**Text Font Size / Розмір шрифту тексту:**
- English: Size of zone label text. Higher values = bigger, more readable text but takes more chart space. Lower values = smaller text, less chart clutter.
- Українська: Розмір тексту підписів зон. Більші значення = більший, читабельніший текст але займає більше місця на графіку. Менші значення = менший текст, менше захаращення графіка.

**Show Only Active Zones / Показувати тільки активні зони:**
- English: If true, removes old zones and shows only current ones. False = keeps historical zones visible for reference. True = cleaner chart with current zones only.
- Українська: Якщо true, видаляє старі зони і показує тільки поточні. False = зберігає історичні зони видимими для довідки. True = чистіший графік тільки з поточними зонами.


Prodotti consigliati
Il livello Premium è un indicatore unico con una precisione superiore all'80% delle previsioni corrette! Questo indicatore è stato testato dai migliori Specialisti di Trading per più di due mesi! L'indicatore dell'autore che non troverai da nessun'altra parte! Dagli screenshot puoi vedere di persona la precisione di questo strumento! 1 è ottimo per il trading di opzioni binarie con un tempo di scadenza di 1 candela. 2 funziona su tutte le coppie di valute, azioni, materie prime, criptovalu
Noize Absorption Index - is the manual trading system that measures the difference of pressure between bears forces and bulls forces. Green line - is a noize free index that showing curent situation. Zero value of index shows totally choppy/flat market.Values above zero level shows how powerfull bullish wave is and values below zero measures bearish forces.Up arrow appears on bearish market when it's ready to reverse, dn arrow appears on weak bullish market, as a result of reverse expectation.
Owl Smart Levels MT5
Sergey Ermolov
4.03 (32)
Versione MT4  |  FAQ L' indicatore Owl Smart Levels è un sistema di trading completo all'interno dell'unico indicatore che include strumenti di analisi di mercato popolari come i frattali avanzati di Bill Williams , Valable ZigZag che costruisce la corretta struttura a onde del mercato, e i livelli di Fibonacci che segnano i livelli esatti di entrata nel mercato e luoghi per prendere profitti. Descrizione dettagliata della strategia Istruzioni per lavorare con l'indicatore Consulente-assistente
Trade smarter, not harder: Empower your trading with Harmonacci Patterns This is arguably the most complete harmonic price formation auto-recognition indicator you can find for the MetaTrader Platform. It detects 19 different patterns, takes fibonacci projections as seriously as you do, displays the Potential Reversal Zone (PRZ) and finds suitable stop-loss and take-profit levels. [ Installation Guide | Update Guide | Troubleshooting | FAQ | All Products ] It detects 19 different harmonic pri
L'indicateur SMC Venom Model BPR est un outil professionnel pour les traders travaillant dans le concept Smart Money (SMC). Il identifie automatiquement deux modèles clés sur le graphique des prix: FVG   (Fair Value Gap) est une combinaison de trois bougies, dans laquelle il y a un écart entre la première et la troisième bougie. Forme une zone entre les niveaux où il n'y a pas de support de volume, ce qui conduit souvent à une correction des prix. BPR   (Balanced Price Range) est une combinaiso
Mine Farm
Maryna Kauzova
Mine Farm is one of the most classic and time-tested scalping strategies based on the breakdown of strong price levels. Mine Farm is the author's modification of the system for determining entry and exit points into the market... Mine Farm - is the combination of great potential with reliability and safety. Why Mine Farm?! - each order has a short dynamic Stop Loss - the advisor does not use any risky methods (averaging, martingale, grid, locking, etc.) - the advisor tries to get the most
Universal Soul Reaper
Pieter Gerhardus Van Zyl
Universal Soul Reaper is an atmospheric market-flow oscillator designed to interpret price behavior as a cycle of spiritual energy. Instead of reacting to raw price alone, it visualizes the state of the market’s soul —revealing when momentum is awakening, stabilizing, or fading. The indicator operates in a separate window and presents three interwoven entities: the Ectoplasmic Veil , the Spirit Boundary , and the Soul Core . Together, they form a living framework that helps traders sense pressu
STRICTLY FOR BOOM INDEX ONLY!!!!! Here I bring the Maximum Trend Arrows OT1.0 MT5 indicator. This indicator is made up of a combination of different trend indicators for entries and exits, for entries an orange arrow will paint on the chart below the current market and a red flag for closing of trades and it produces buy arrows only. When the orange arrow appears, it will appear along with it's sound to notify you. The 1H timeframe is recommended, don't use it anywhere else than on the 1H timefr
L'indicatore costruisce le quotazioni attuali, che possono essere confrontate con quelle storiche e su questa base fanno una previsione del movimento dei prezzi. L'indicatore ha un campo di testo per una rapida navigazione fino alla data desiderata. Opzioni: Simbolo - selezione del simbolo che visualizzerà l'indicatore; SymbolPeriod - selezione del periodo da cui l'indicatore prenderà i dati; IndicatorColor - colore dell'indicatore; HorisontalShift - spostamento delle virgolette disegnate d
Was: $249  Now: $99   Market Profile defines a number of day types that can help the trader to determine market behaviour. A key feature is the Value Area, representing the range of price action where 70% of trading took place. Understanding the Value Area can give traders valuable insight into market direction and establish the higher odds trade. It is an excellent addition to any system you may be using. Inspired by Jim Dalton’s book “Mind Over Markets”, this indicator is designed to suit the
# DRAWDOWN INDICATOR V4.0 - The Essential Tool to Master Your Trading ## Transform Your Trading with a Complete Real-Time Performance Overview In the demanding world of Forex and CFD trading, **knowing your real-time performance** isn't a luxury—it's an **absolute necessity**. The **Drawdown Indicator V4.0** is much more than a simple indicator: it's your **professional dashboard** that gives you a clear, precise, and instant view of your trading account status. --- ## Why This Indicator
Overview Harmonic Patterns MT5 is a technical analysis indicator designed for the MetaTrader 5 platform. It identifies and displays harmonic price patterns, such as Butterfly, Cypher, Crab, Bat, Shark, and Gartley, in both bullish and bearish directions. The indicator calculates key price levels, including entry, stop loss, and three take-profit levels, to assist traders in analyzing market movements. Visual elements and customizable alerts enhance usability on the chart. Features Detects six ha
PZ Support Resistance MT5
PZ TRADING SLU
3.71 (7)
Unlock key market insights with automated support and resistance lines Tired of plotting support and resistance lines? This is a multi-timeframe indicator that detects and plots supports and resistance lines in the chart with the same precision as a human eye would. As price levels are tested over time and its importance increases, the lines become thicker and darker, making price leves easy to glance and evaluate. [ Installation Guide | Update Guide | Troubleshooting | FAQ | All Products ] Boos
Your Trend Friend
Luigi Nunes Labigalini
5 (1)
The trend is your friend! Look at the color of the indicator and trade on that direction. It does not  repaint. After each candle is closed, that's the color of the trend. You can focus on shorter faster trends or major trends, just test what's most suitable for the symbol and timeframe you trade. Simply change the "Length" parameter and the indicator will automatically adapt. You can also change the color, thickness and style of the lines. Download and give it a try! There are big movements w
Volume Profile V6
Andrey Kolesnik
4.67 (3)
Indicatore del profilo di volume del mercato + oscillatore intelligente. Funziona su quasi tutti gli strumenti: coppie di valute, azioni, futures, criptovalute, sia su volumi reali che su tick. È possibile impostare la definizione automatica dell'intervallo di costruzione del profilo (ad esempio, per una settimana o un mese, ecc.), oppure impostare l'intervallo manualmente spostando i confini (due linee verticali: rossa e blu). Viene visualizzato sotto forma di istogramma. La larghezza dell'isto
Inverted_Chart_EA Utility Expert Advisor Inverted_Chart_EA creates and maintains a mirror-inverted chart of any symbol and timeframe. It automatically generates a custom instrument (e.g. US30_INV ) and keeps its price history updated in real time, with bars mirrored around a chosen pivot. This utility gives traders a new way to analyze the market from a different perspective by flipping the chart upside down. Why use an inverted chart? Highlight hidden patterns – price formations that look ordin
The  SuperTrend Advance Trading  is a widely-used technical indicator based on  SuperTrend Strategy + Price Action + EMA . How it works: -  Buy/Sell Signals  can be generated when the trend reverses, the conditions of Price action, TrendLine and EMA are met. - After the  Signal  appears, be patient and wait until the candle closes, at that time place the order as soon as possible. You may have time to review your entry, consider whether it is a good entry or not. - Carefully review the entry, up
Exclusive Imperium MT5 — Sistema di Trading Automatizzato Exclusive Imperium MT5 è un Expert Advisor per MetaTrader 5, basato su algoritmi di analisi di mercato e gestione del rischio. L’EA funziona in modalità completamente automatica e richiede un intervento minimo da parte del trader. Attenzione! Contattami immediatamente dopo l’acquisto per ricevere le istruzioni di configurazione! IMPORTANTE: Tutti gli esempi, screenshot e test sono forniti esclusivamente a scopo dimostrativo. Se una determ
Rainbow EA MT5
Jamal El Alama
Description : Rainbow EA MT5 is a simple Expert advisor based on   Rainbow MT5 indicator witch is based on Moving average with period 34. The indicator is incorporated in the EA, therefore, it is not required for the EA to operate, but if you wish, you can download it from   my product page . The Expert Advisor settings are as follows : Suitable for Timeframes up to H1 The parameters below can be set according to your trading rules. StopLoss ( Stop Loss in pips) TakeProfit ( Take Profit in pips
Terra Infinity is a flat indicator. This improved version of the CalcFlat indicator has three additional lines that significantly increase its effectiveness. Unlike its predecessor with two static levels, Terra Infinity adds three dynamic lines above the main histogram, which are interpreted as follows: base signal line, minimum signal line, maximum signal line. These lines are formed using the additional parameter Avg, which is the average value of the histogram. Averaging produces a line cl
Una delle sequenze numeriche è chiamata "Sequenza di incendi boschivi". È stata riconosciuta come una delle nuove sequenze più belle. La sua caratteristica principale è che questa sequenza evita andamenti lineari, anche quelli più brevi. È questa proprietà che ha costituito la base di questo indicatore. Quando si analizza una serie temporale finanziaria, questo indicatore cerca di rifiutare tutte le possibili opzioni di tendenza. E solo se fallisce, riconosce la presenza di una tendenza e dà il
Overview Heiken Ashi CE Filtered MT5 is a technical indicator for the MetaTrader 5 platform. It integrates smoothed candlestick charting with a dynamic exit strategy and a customizable trend filter to deliver clear buy and sell signals. The indicator is designed to improve trend detection and signal reliability by reducing market noise. If you want to see more high-quality products or order the development/conversion of your own products, visit my partners' website: 4xDev Get 10% OFF on manual
TRI Visualizer
Yoshimi Mon 三 Ura
TRI Visualizer MT5 – Thermodynamic Market Analysis Overview The TRI (Thermal Range Indicator) Visualizer Enhanced is a rare market analysis indicator that goes beyond conventional technical analysis, applying principles of thermodynamics from physics. It interprets market price fluctuations as “thermodynamic energy,” enabling the highly accurate detection of subtle market changes that are often overlooked. Innovative Mechanisms 1. Dual Calculation Engines Classic TRI Mode Formula: |Close
The RSI Divergence + FVG Signal indicator combines Relative Strength Index (RSI) Divergence with Fair Value Gap (FVG) detection to generate high-probability buy and sell signals based on both momentum shifts and institutional imbalance zones. Core Features: RSI Divergence Detection : Identifies both regular and hidden bullish/bearish divergences between price and RSI. Divergences indicate potential trend reversals or continuation. FVG Zone Recognition : Detects Fair Value Gaps (imbalances caused
Cumulative delta indicator As most traders believe, the price moves under the pressure of market buying or selling. When someone redeems an offer standing in the cup, the deal is a "buy". If someone pours into the bid standing in the cup - the deal goes with the direction of "sale". The delta is the difference between purchases and sales. A cumulative delta - the difference between the cumulative sum of purchases and sales for a certain period of time. It allows you to see who is currently contr
PipFinite Trend PRO MT5
Karlo Wilson Vendiola
4.84 (558)
Breakthrough Solution For Trend Trading And Filtering With All Important Features Built Inside One Tool! Trend PRO's smart algorithm detects the trend, filters out market noise and gives entry signals with exit levels. The new features with enhanced rules for statistical calculation improved the overall performance of this indicator. Important Information Revealed Maximize the potential of Trend Pro, please visit www.mql5.com/en/blogs/post/713938 The Powerful Expert Advisor Version Automatin
Crash 1000 Scalping Indicator for the Crash 1000 Deriv Synthetic Index. Introduction The Crash 1000 Scalping Indicator is a specialized tool designed for the Crash 1000 index on the Deriv Synthetic market. This indicator is particularly useful for scalping on the M1 timeframe, helping traders to identify precise entry and exit points for buy positions. It is designed to be non-repainting, providing clear signals with audible alerts and push notifications, and is compatible with mobile devices th
SolarTrade Suite Financial Robot: LaunchPad Market Expert - progettato per aprire le negoziazioni! Questo è un robot di trading che utilizza speciali algoritmi innovativi e avanzati per calcolare i suoi valori, il tuo assistente nel mondo dei mercati finanziari. Utilizza il nostro set di indicatori della serie SolarTrade Suite per scegliere meglio il momento in cui lanciare questo robot. Dai un'occhiata agli altri nostri prodotti della serie SolarTrade Suite in fondo alla descrizione. Vuoi n
The Riko Trend indicator is a revolutionary trend trading and filtering solution with all the important features of a trend tool built into one tool! The Riko Trend indicator is good for any trader, suitable for any trader for both forex and binary options. You don’t need to configure anything, everything is perfected by time and experience, it works great during a flat and in a trend. The Riko Trend indicator is a technical analysis tool for financial markets that reflects the current price f
Introducing the Power Trade Plus indicator designed by a small group of traders with a few years of experience trading the market profitably.  The Power Trade Plus is derived from the Power Trade indicator,  the indicator strive in powerful sniper entries and take profit levels,  with an algorithm that's can determine the markets volatility and Provides entries based on the current market volatility. This indicator is much more effective in stock ,currencies and indices.
Gli utenti di questo prodotto hanno anche acquistato
ARIPoint
Temirlan Kdyrkhan
1 (1)
ARIPoint is a powerful trading companion designed to generate high-probability entry signals with dynamic TP/SL/DP levels based on volatility. Built-in performance tracking shows win/loss stats, PP1/PP2 hits, and success rates all updated live. Key Features: Buy/Sell signals with adaptive volatility bands Real-time TP/SL/DP levels based on ATR Built-in MA Filter with optional ATR/StdDev volatility Performance stats panel (Success, Profit/Loss, PP1/PP2) Alerts via popup, sound, push, or email Cu
Rtc ML Ai Predictor
Muhammad Faisal Sagala
Rtc ML Ai | Predictor CORE MACHINE LEARNING ENGINE Adaptive ML Market Predictor – Multi-Bar Trend & Candle Forecast What This Indicator Does This indicator is a  real-time market prediction engine  designed to analyze price behavior and estimate  future market tendencies . Unlike conventional indicators, this system  does not rely on static parameters or historical curve-fitting , but adapts its internal state dynamically during live market operation. Instead of using static rules, the indic
FXLAND Smart Reversal Indicator (MT5) FXLAND Smart Reversal Indicator is a professional technical analysis tool designed to help traders identify potential price reversal zones and key market turning points with clarity and precision. The best reversal indicator and price return by choosing only one ceiling or floor in each time frame A masterpiece of combining mathematics and Gann, fractal matrix, Fibonacci, movement angle and time. Completely intelligent Key Features Detects potenti
TrendMaestro5
Stefano Frisetti
Attenzione alle truffe, questo indicatore e' distribuito esclusivamente su MQL5.com nota: questo indicatore e' per METATRADER5, se vuoi la versione per  METATRADER4 questo e' il link:   https://www.mql5.com/it/market/product/108106 TRENDMAESTRO ver 2.5 TRENDMAESTRO   riconosce un nuovo TREND sul nascere, non sbaglia mai. La sicurezza di identificare un nuovo TREND non ha prezzo. DESCRIZIONE TRENDMAESTRO identifica un nuovo TREND sul nascere, questo indicatore prende in esame la volatilita' i
VTrende Pro
Andrii Diachenko
5 (1)
VTrende Pro - MTF indicator for trend trading with a display panel for MT5 *** Videos can be translated into any language using subtitles (video language - Russian) Although the signals of the VTrende Pro indicator can be used as signals of a full-fledged trading system, it is recommended to use them in conjunction with the Bill Williams TS. VTrende Pro is an extended version of the VTrende indicator. Difference between Pro version and VTrende: - Time zones - Signal V - signal 1-2 waves -    S
Hello I Want to introduce The Forex Buy Sell Arrow Premium MT5 i recently release this premium indicator! its 1000% Non Repaint Indicator, It Work Perfectly Well,, i tested it day by day, Just mind blowing Result,  Including Powerful trend Algorithm! How It Work? well, it work market trend formula, when trend Bullish Or when trend Bearish,  Recommend Timeframe M30, H1 it work all timeframe, and all currency pair, 100% non repaint, How to take signal From Forex Buy Sell Arrow Premium Ind
WanaScalper
Isaac Wanasolo
1 (1)
A scalping indicator based on mathematical patterns, which on average gives signals with relatively small SL, and also occasionally helps to catch big moves in the markets (more information in the video) This indicator has three main types of notifications: The first type warns of a possible/upcoming signal on the next bar The second type indicates the presence of a ready signal to enter the market/open a position The third type is for SL and TP levels - you will be notified every time price re
Pantera Indicator
Temirlan Kdyrkhan
5 (1)
A tool for on-chart strategy backtesting and performance analysis. A utility for developing, debugging, and testing custom trading ideas and indicator functions. An indicator designed to quickly test trading concepts and visualize the effectiveness of different input parameters. An all-in-one sandbox for testing everything from simple crossovers to complex, multi-condition trading systems.
Enigma 112
issam rahhal sabour
Enigma 112 Indicator - User Manual Enigma 112 Indicator Complete User Manual - Ultimate Trading Solution Introduction The Enigma 112 is a comprehensive multi-timeframe trading indicator that combines advanced technical analysis concepts including Tesla 3-6-9 Gates, Huddleston Theory, PO3 Dealing Ranges, and sophisticated risk management systems. Tesla 3-6-9 Gates Based on Nikola Tesla's vortex mathematics for precise support and resistance levels Huddleston Theory Volume-based market
The Expert Advisor and the video are attached in the Discussion tab . The robot applies only one order and strictly follows the signals to evaluate the indicator efficiency. Pan PrizMA CD Phase is an option based on the Pan PrizMA indicator. Details (in Russian). Averaging by a quadric-quartic polynomial increases the smoothness of lines, adds momentum and rhythm. Extrapolation by the sinusoid function near a constant allows adjusting the delay or lead of signals. The value of the phase - wave s
Классификатор силы тренда. Показания на истории не меняет. Изменяется классификация только незакрытого бара. По идее подобен полной системе ASCTrend, сигнальный модуль которой, точнее его аппроксимация в несколько "урезанном" виде, есть в свободном доступе, а также в терминале как сигнальный индикатор SilverTrend . Точной копией системы ASCTrend не является. Работает на всех инструментах и всех временных диапазонах. Индикатор использует несколько некоррелируемых между собой алгоритмов для класси
FFx Universal Strength Meter PRO is more than a basic strength meter. Instead of limiting the calculation to price, it can be based on any of the 19 integrated strength modes + 9 timeframes. With the FFx USM, you are able to define any period for any combination of timeframes. For example, you can set the dashboard for the last 10 candles for M15-H1-H4… Full flexibility! Very easy to interpret... It gives a great idea about which currency is weak and which is strong, so you can find the best pai
The FFx Universal MTF alerter shows on a single chart all the timeframes (M1 to Monthly) with their own status for the chosen indicator. 9 indicators mode (MACD-RSI-Stochastic-MA-ADX-Ichimoku-Candles-CCI-PSAR). Each can be applied multiple times on the same chart with different settings. Very easy to interpret. Confirm your BUY entries when most of the timeframes are showing green color. And confirm your SELL entries when most of the timeframes are showing red color. 2 Alert Options : input to s
The FFx Watcher PRO is a dashboard displaying on a single chart the current direction of up to 15 standard indicators and up to 21 timeframes. It has 2 different modes: Watcher mode: Multi Indicators User is able to select up to 15 indicators to be displayed User is able to select up to 21 timeframes to be displayed Watcher mode: Multi Pairs User is able to select any number of pairs/symbols User is able to select up to 21 timeframes to be displayed This mode uses one of the standard indicators
FFx Patterns Alerter gives trade suggestions with Entry, Target 1, Target 2 and StopLoss .... for any of the selected patterns (PinBar, Engulfing, InsideBar, OutsideBar) Below are the different options available: Multiple instances can be applied on the same chart to monitor different patterns Entry suggestion - pips to be added over the break for the entry 3 different options to calculate the SL - by pips, by ATR multiplier or at the pattern High/Low 3 different options to calculate the 2 TPs -
MetaTrader 4 version available here : https://www.mql5.com/en/market/product/24881 FFx Basket Scanner is a global tool scanning all pairs and all timeframes over up to five indicators among the 16 available. You will clearly see which currencies to avoid trading and which ones to focus on. Once a currency goes into an extreme zone (e.g. 20/80%), you can trade the whole basket with great confidence. Another way to use it is to look at two currencies (weak vs strong) to find the best single pairs
MetaTrader 4 version available here: https://www.mql5.com/en/market/product/25793 FFx Pivot SR Suite PRO is a complete suite for support and resistance levels. Support and Resistance are the most used levels in all kinds of trading. Can be used to find reversal trend, to set targets and stop, etc. The indicator is fully flexible directly from the chart 4 periods to choose for the calculation: 4Hours, Daily, Weekly and Monthly 4 formulas to choose for the calculation: Classic, Camarilla, Fibonac
ClassicSBA
Umri Azkia Zulkarnaen
this indicator very simple and easy if you understand and agree with setup and rule basic teknical sba you can cek in link : please cek my youtube channel for detail chanel : an for detail info  contact me  basicly setup buy (long) for this indicator is Magenta- blue and green candle or magenta - green  and green candlestik and for setup sell (short) is Black - yellow - and red candle or black - red  and red candlestik
Pendiente de Precio
Cesar Juan Flores Navarro
Indicador en base a la pendiente de la linea de precio, dibuja una línea de color cuando sube a base de los precios que previamente has sido procesados o linealizados, y cuando baja la pendiente la linea linealizada toma otro color. En este caso se a considerado 6 lineas de diferentes procesos desde pendientes largas hacia las cortas, observándose que cuando coincidan las pendientes se produce un máximo o mínimo, lo que a simple vista nos permitirá hacer una COMPRA O VENTA.
Fibonacci Multiple 12
Cesar Juan Flores Navarro
Fibonacci Múltiple 12, utiliza la serie fibonacci plasmado en el indicador fibonacci, aumentadolo 12 veces según su secuencia. El indicador fibonacci normalmente muestra una vez, el presente indicador se mostrara 12 veces empezando el numero que le indique siguiendo la secuencia. Se puede utilizar para ver la tendencia en periodos cortos y largos, de minutos a meses, solo aumentado el numero MULTIPLICA.
Recommended TimeFrame >= H1. 100% Non Repainted at any moment.  Use it carefully, only with Trend Direction. Trading Usage: 2 Variants: as Range System or as BreakOut System (Both Only With Trend Direction)::: (Always use StopLoss for minimise Risk); [1] as Range System: (Recommended) in UP TREND:  - BUY in Blue Line , then if price goes down by 50 points (on H1) open Second BUY.   Close in any Profit you wish: TrailingStop(45 points) or Close when Price touches upper Gold Line. in DOWN TREND
Linea Horizontal Inteligente
Cesar Juan Flores Navarro
En base a cálculos matemáticos de determino una linea Horizontal que cruza a todas las señales de trading, mostrando los máximos y mínimos. La linea horizontal parte en dos las subidas y bajadas de las señales de trading, de tan manera que es fácil identificar los máximos y mínimos, y es inteligente por que es sensible a las subidas y bajadas, afín de no quedarse en un solo lado por siempre, trabaja excelentemente con otros indicadores suavizadores ya que les garantiza que en un intervalo de tie
Spike Detector
Tete Adate Adjete
this indicator is a Spike detector indicator, it is specially designed to trade Boom 1000, Boom 500, Crash 1000 and Crash 500 We recommend using it on Deriv Boom and Crash indices only Its setting is intuitive, familiar, easy to use it has notification functions; audible notifications and push notifications. this tool is simple to use, easy to handle This update is based on different strategies for spikes
Limitless MT5
Dmitriy Kashevich
Limitless MT5 is a universal indicator suitable for every beginner and experienced trader. works on all currency pairs, cryptocurrencies, raw stocks Limitless MT5 - already configured and does not require additional configuration And now the main thing Why Limitless MT5? 1 complete lack of redrawing 2 two years of testing by the best specialists in trading 3 the accuracy of correct signals exceeds 80% 4 performed well in trading during news releases Trading rules 1 buy signal - the ap
Escalera Inteligente
Cesar Juan Flores Navarro
Indicador en MQL5, recibe la información del precio SUAVIZADO, lo procesa anulando los picos inteligentemente, y el resultado lo envía al desarrollo de la escalera que iniciara y subirá o bajara según el peldaño o INTERVALO ingresado Ingreso PERIODO = 50 (variar segun uso) Ingreso MULTIPLICA AL PERIODO = 1 (variar segun uso) Segun la configuración la escalera puede pegarse o separarse de los precios,, Se aplica toda la linea de tiempo, y a todas las divisas, etc.  
Fibonacci Suavizado
Cesar Juan Flores Navarro
Indicador en MQL5, que obtiene el promedio de 10 EMAS, que son alineadas según Fibonacci, obteniendo un promedio, que sera suavizado.  Se puede ingresar un numero desde 2 a N, que multiplica a los EMA-Fibonacci. Funciona en cualquier criptomoneda, etc. etc... pudiendo calcular el futuro segun la tendencia de las EMAS. Funciona excelentemente en tramos largos, determinando exactamente el mejor inicio/salida. El precio inicial por apertura sera por un periodo de tiempo, luego aumentará.
QuantXSTocks Trading Range Indicator for MT5: INSTRUCTIONS TO USE OUR INDICATOR:- User needs to take trade on Arrow or after an Arrow CandleStick, You can achieve up-to 35-125 pips target by this Indicator. Best Timeframes for Stocks and Indices are M30 and H1: AMAZON M30 (50 pips) TESLA M30 (50 pips) APPLE M30 (50 pips) ADOBE M30 (50 pips) NASDAQ100 H1 (125 pips) The above are the approximate amount of pips you can achieve by this Indicator, Green arrow appears to be buy arrow while the Red ar
Super Suavizador
Cesar Juan Flores Navarro
Indicador en MQL5 que obtiene el promedio de 10 EMAS que son alineadas y procesadas según Fibonacci luego el promedio es suavizado"  Se ingresa un número de 2 a N que multiplica los EMA-Fibonacci y por consiguiente aumenta los fibonacci, resultando un promedio.   Se ingresa un número que suaviza los EMA-Fibonacci. Considerando los números 1/1 seria la suavización minima. Considerando los números 3/5 seria la suavización media. Considerando los números 10/30 seria la suavización alta.....etc
Trend and Signals MT5  indicator scans  30 trading Instruments (Forex, Metals and Indices).     It uses special algorithm on the  current market   based on   Pure Price Action   and display the overall trend and signal on the dashboard. When signals are produced the indicator sends alert and notification. Strategy for Signals This indicator uses the daily timeframe to determine the direction of the trend. The hourly timeframe is used to identify possible entries. Main trend and is determined by
Cycles Forecast
Pooriya Alirezaee
This indicator is based on a mathematical formula and an ANN combined, designed to make a model(using previous prices) of the most recent market condition (any chart*) in order to use the model as a forecasting tool. *This indicator can operate on any chart/timeframe, but it's suggested you use multiple timeframes for each trade because this method relies solely on the time factor, you can not use this indicator to predict price volatility, but if it's fit correctly it will show you when the nex
Altri dall’autore
MercariaPattern1-2-3 відстежує рух ціни, знаходить трьоххвильові структури 1-2-3 та підсвічує момент, коли сценарій підтверджується пробоєм ключового рівня. MercariaPattern1-2-3 tracks price movement, detects three-leg 1-2-3 structures and highlights the moment when the scenario is confirmed by a key level breakout. Індикатор збирає локальні свінги в компактну фігуру 0–1–2–3 , чекає підтвердженого пробою та будує стрілку входу з готовими рівнями SL/TP. The indicator combines local swings into a
Filtro:
Nessuna recensione
Rispondi alla recensione