Trend Forecaster
- Indicatori
-
Alexey Minkov
 💡 My name is Alexey, but my friends call me Alex. I have extensive experience in coding and trading since 2004. I am an active trader, IT developer and have a successful experience as a financial trustee, but my main passion, job, and hobby are programming. I am the author and developer of many
 - Versione: 3.0
- Aggiornato: 20 giugno 2026
- Attivazioni: 10
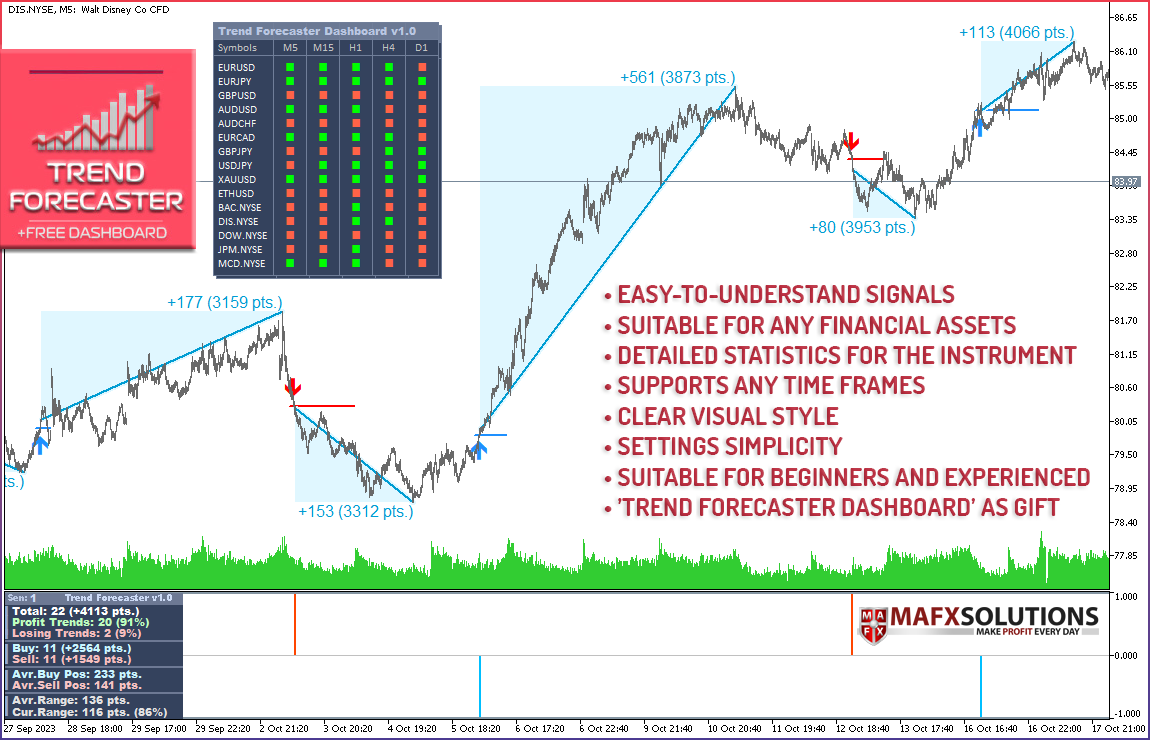
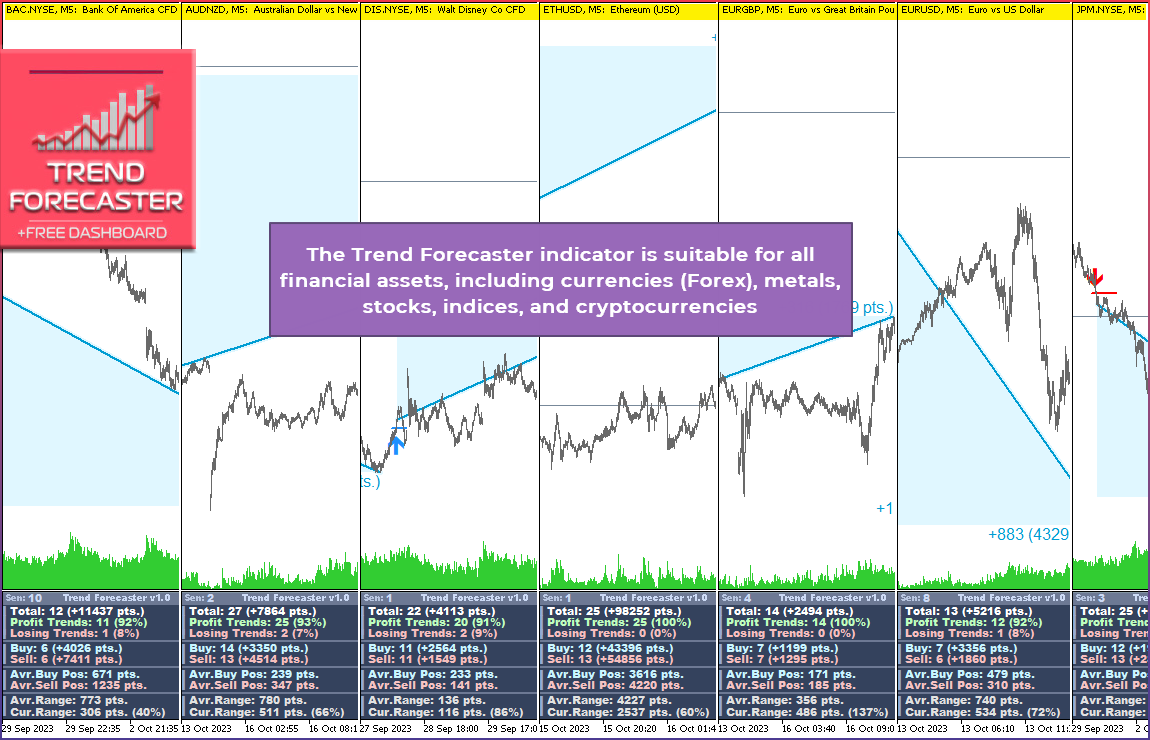
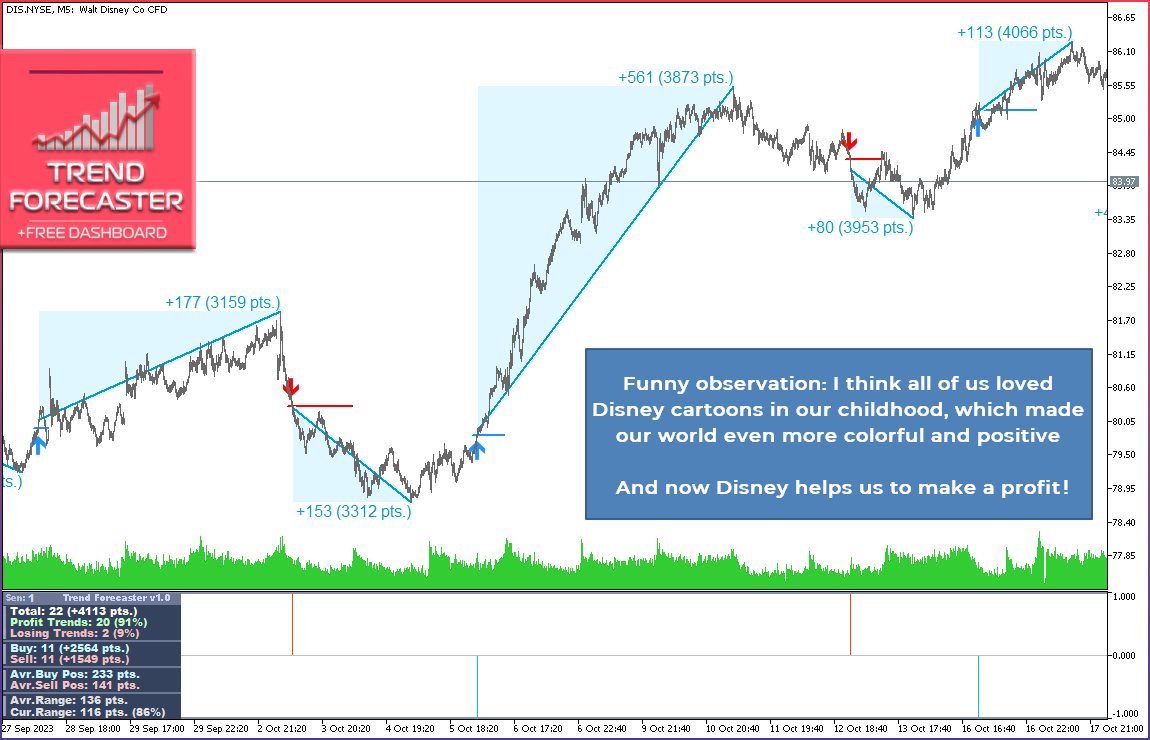
Trend Forecaster is a MetaTrader 5 indicator that combines breakout signals, possible reversal area analysis, market range data and a visual statistics panel in one chart workspace.
It shows Buy and Sell signals, tracks Average Range and Current Range, and can automatically adjust Sensitivity for the current symbol and timeframe. Manual Sensitivity control is also available.
The indicator can be used on Forex pairs, metals, stocks, indices and cryptocurrencies. Different timeframes are supported, with M5 as a practical starting point.
Main Features
- Breakout and reversal area analysis
- Multi-filter signal logic
- Auto-Tune Sensitivity
- Manual setup mode
- Market statistics panel
- Average Range and Current Range analysis
- Compact, Normal and Extended panel modes
- Alerts
- External buffer access
- Four visual themes
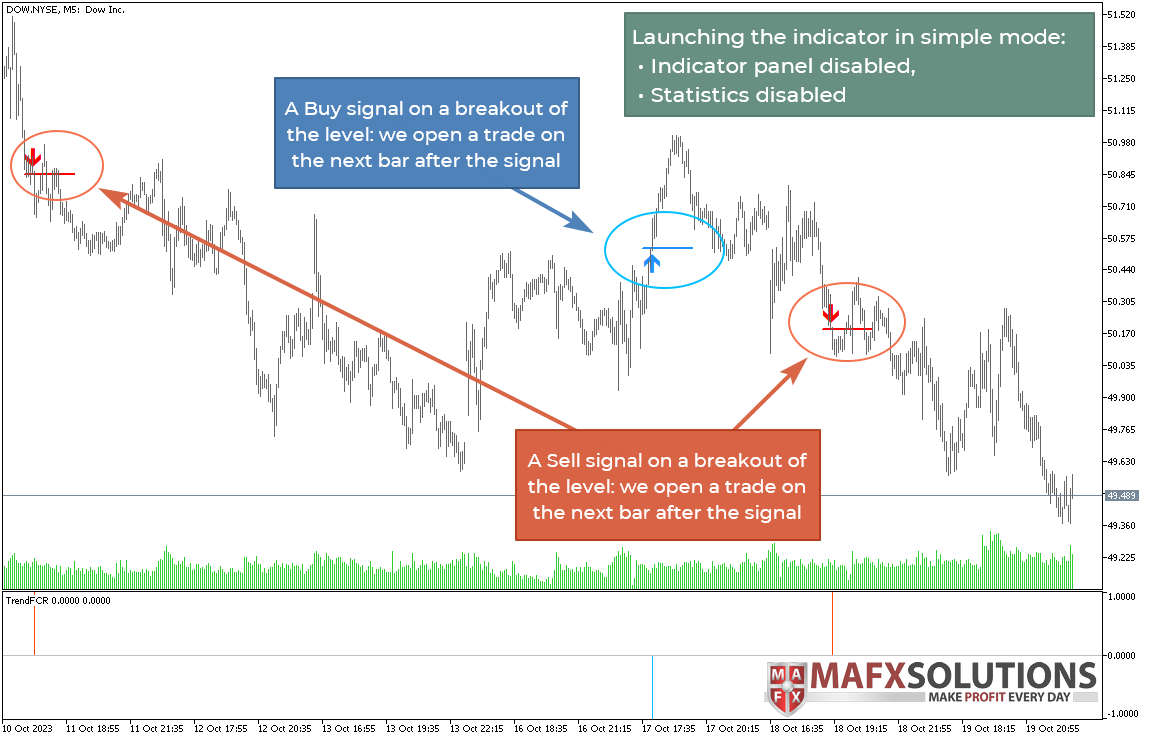
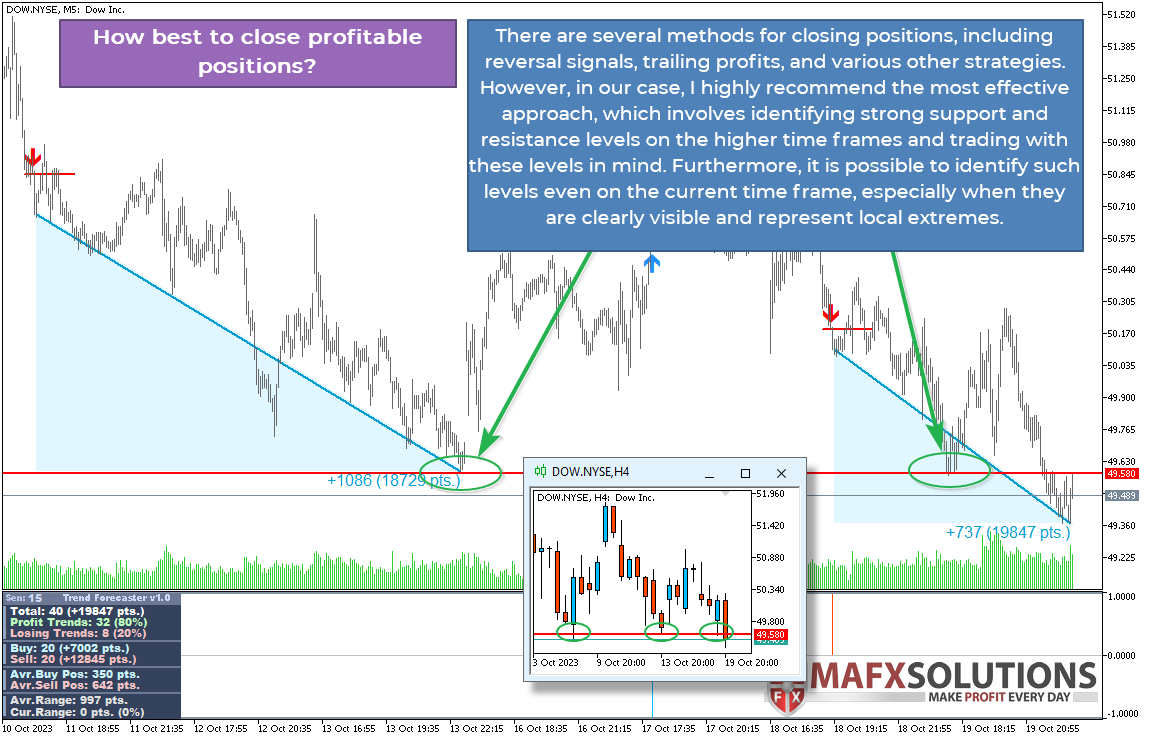
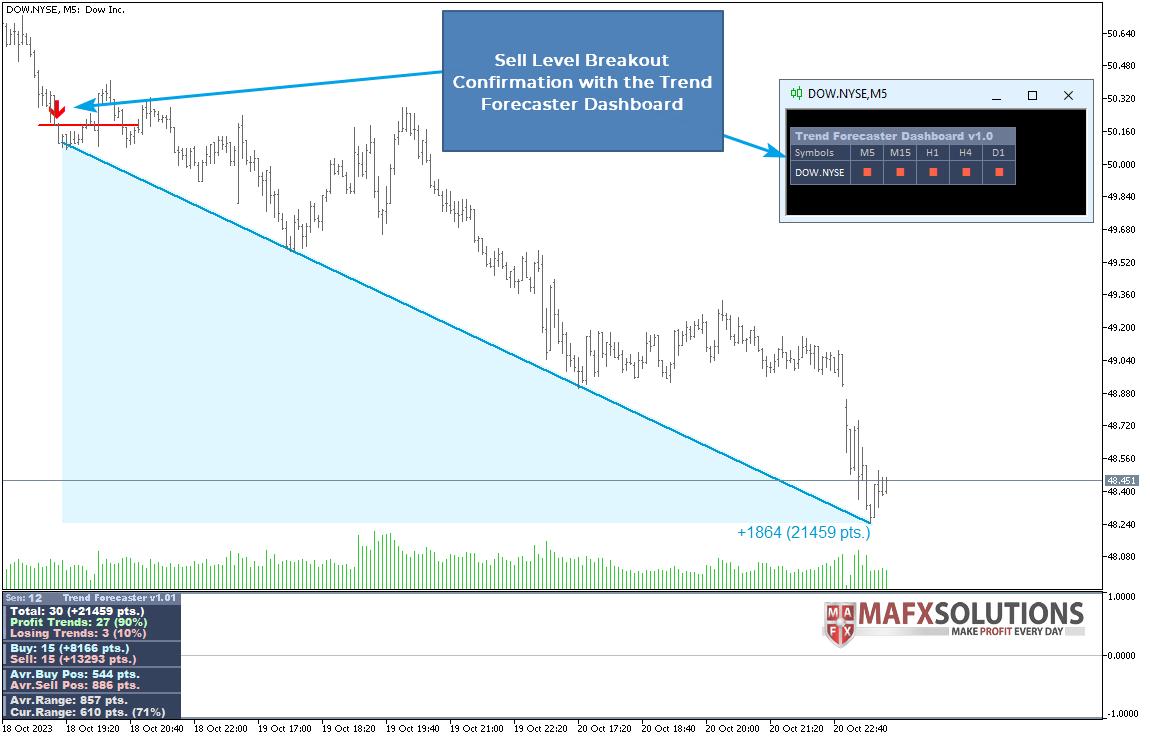
Trend Forecaster analyzes price behavior near detected areas and shows Buy or Sell signals when its internal breakout conditions are met. The indicator can be used to study both trend continuation and possible reversal zones.
The indicator combines several internal filters into a simple workflow. The user does not need to configure many technical parameters before starting the analysis.
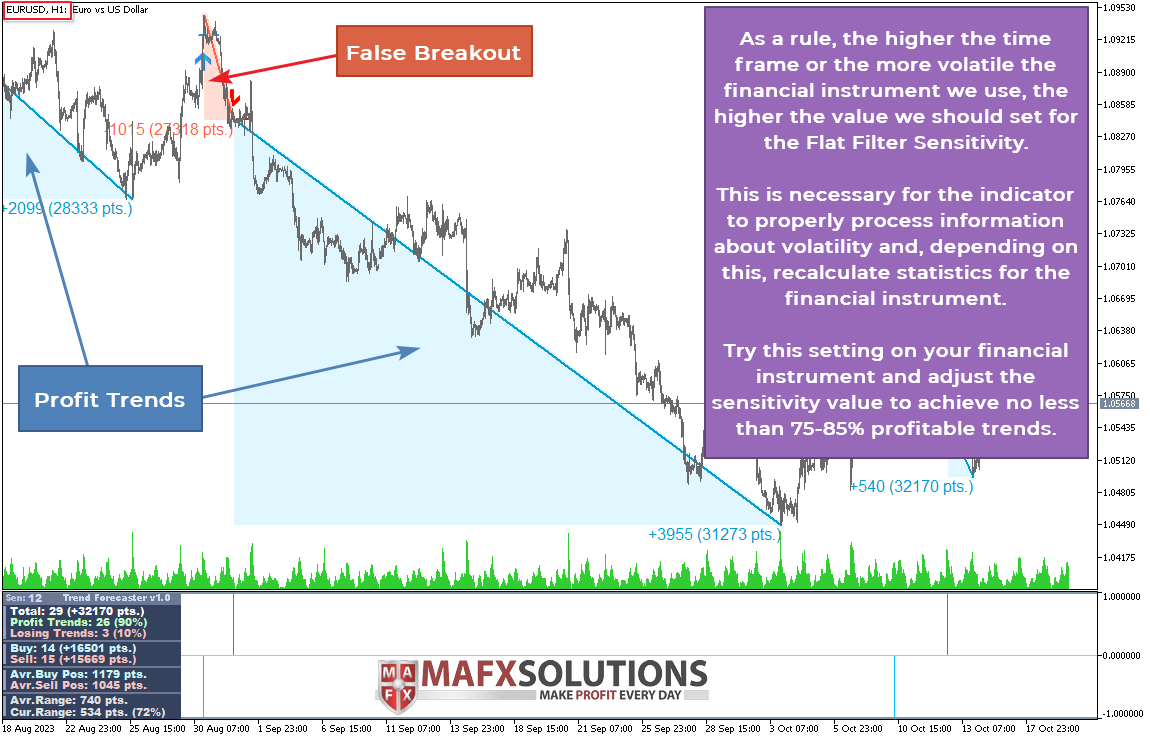
The indicator can automatically calculate Sensitivity for the current symbol and timeframe based on recent historical data. This helps reduce manual setup when switching between instruments.
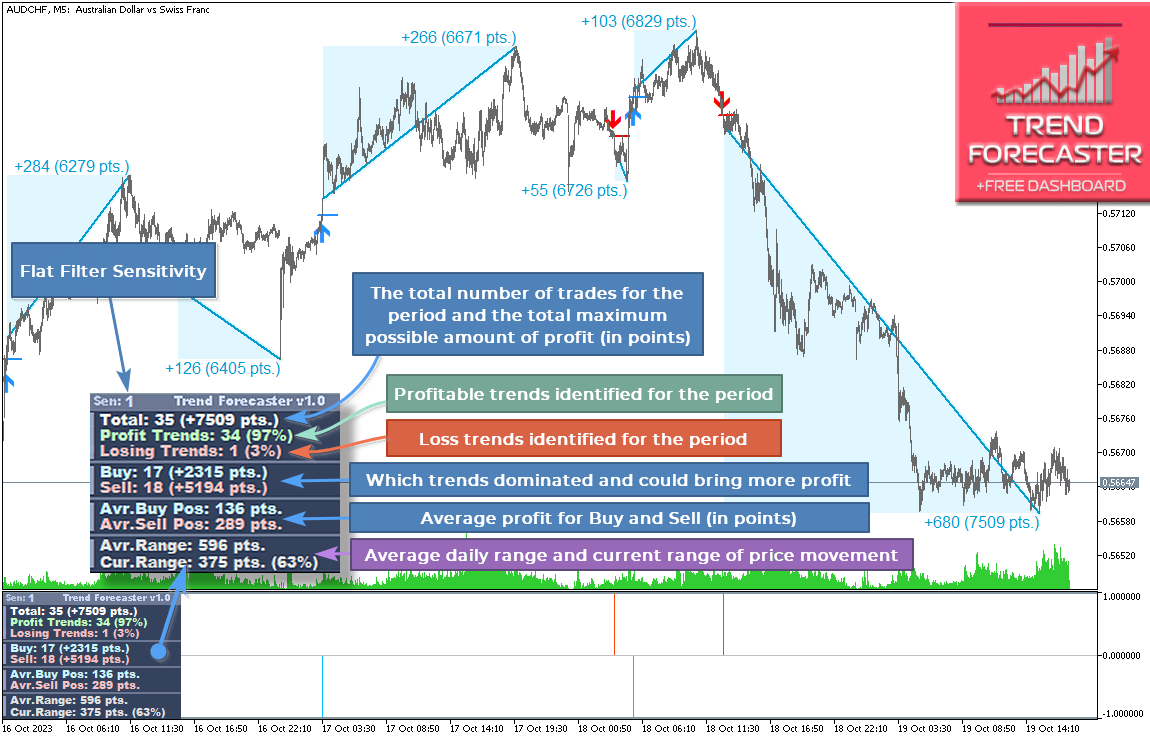
You can use a fixed Flat Filter Sensitivity value if you prefer stable settings or want to test specific configurations.
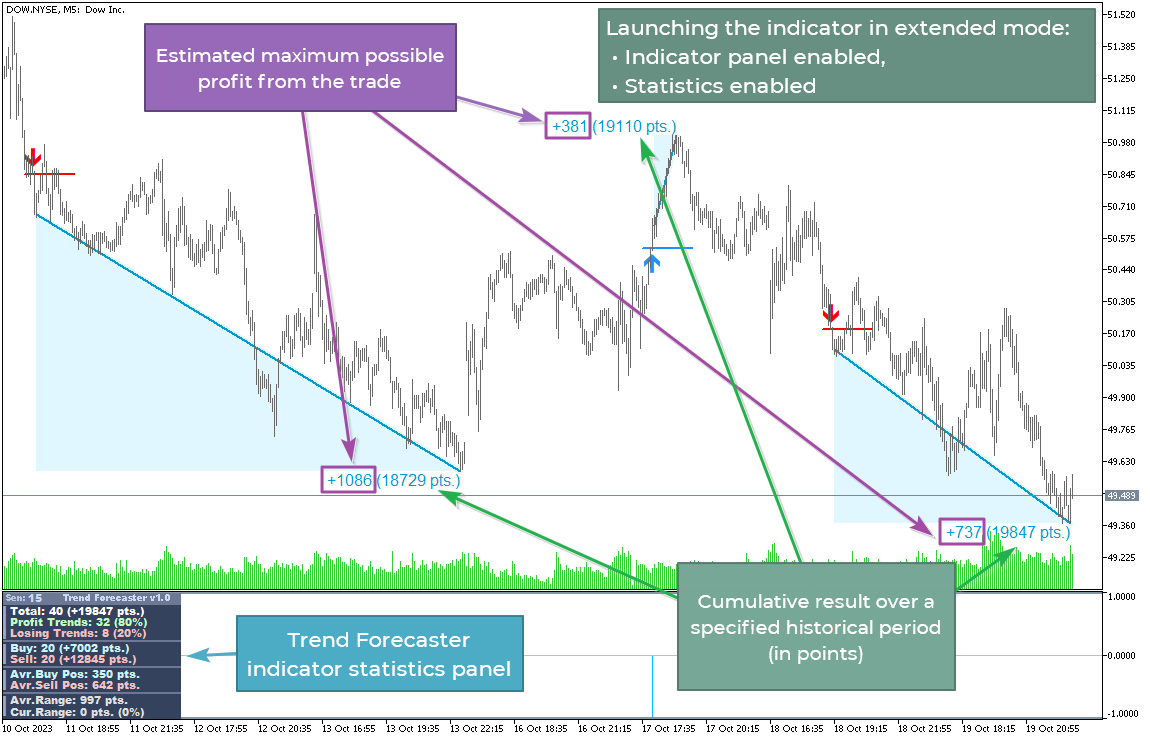
The panel can show signal statistics, Buy and Sell movement data, Average Range and Current Range values. This gives additional context for the current instrument without opening extra indicators.
Average Range shows the usual daily movement range of the instrument. Current Range shows how much the price has already moved during the current day. These values can help the user evaluate the current market phase.
You can choose how much information should be displayed on the chart. Compact mode keeps only key values, while Extended mode shows more detailed statistics.
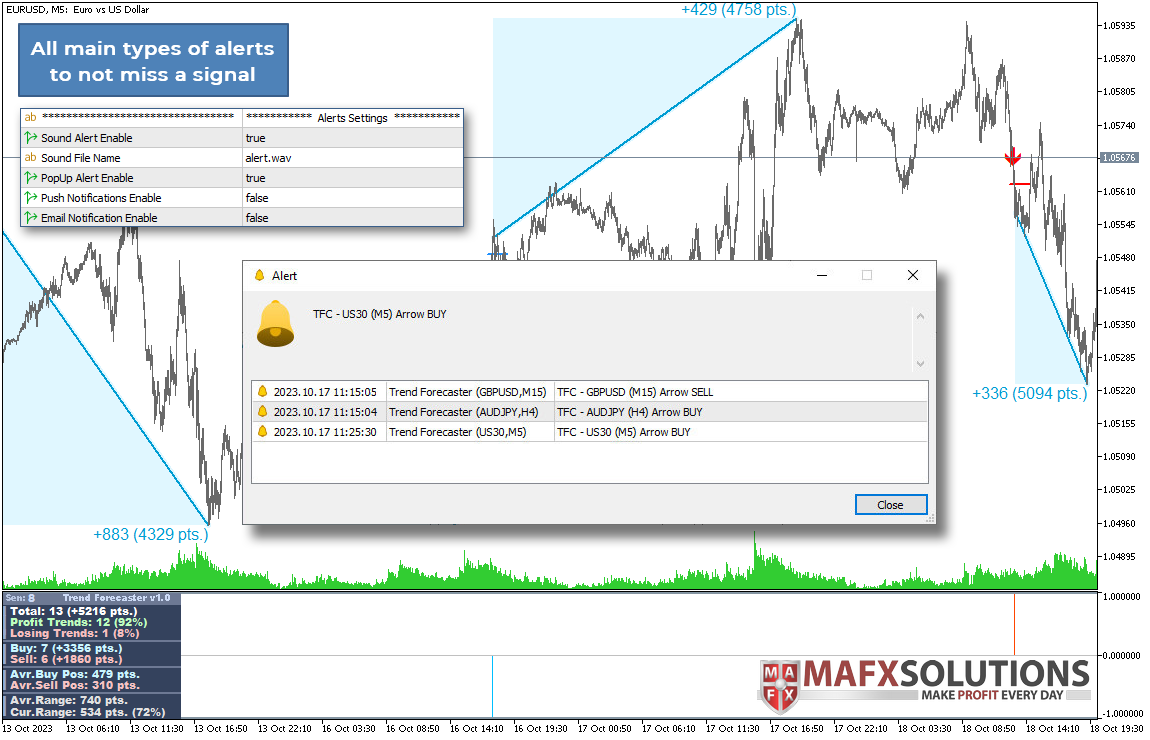
Trend Forecaster supports sound alerts, pop-up alerts, Push notifications and Email notifications.
Buy and Sell signal buffers are available for Expert Advisors, dashboards and other custom tools. Average Range and Current Range buffers are also available.
The indicator includes four chart themes: Light Theme, Dark Theme, Arctic and Midnight. Custom colors are also available when the color theme option is disabled.
Auto-Tune Sensitivity
Auto-Tune Sensitivity is designed to simplify the setup process. The indicator checks recent history and searches for a Sensitivity value that is close to the selected signal frequency target.
The setting Target Trades on History defines the target number of historical signals used during calibration. A lower target usually means stricter filtering. A higher target usually means more frequent signals.
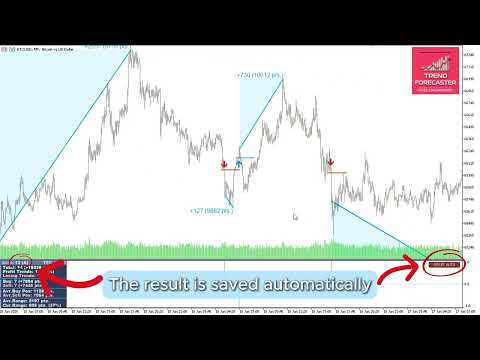
The detected value can be saved separately for each symbol and timeframe. If needed, the saved value can be cleared with the RESET AUTO button, and the indicator will run a new calibration.
For Strategy Tester and Expert Advisor usage, it is recommended to use Flat Filter Sensitivity. This keeps the setup fixed and easier to reproduce.
Why Trend Forecaster Can Be Useful
Trend Forecaster is built for traders who want a cleaner way to read breakouts, possible reversal areas and current market range. Instead of checking several separate tools, you can see signal arrows, range data and market statistics in one chart workspace.
The main value of the indicator is the combination of breakout logic, reversal area analysis, automatic Sensitivity tuning and a visual statistics panel. It does not replace the trader's decision process, but it helps make chart analysis more organized and consistent.
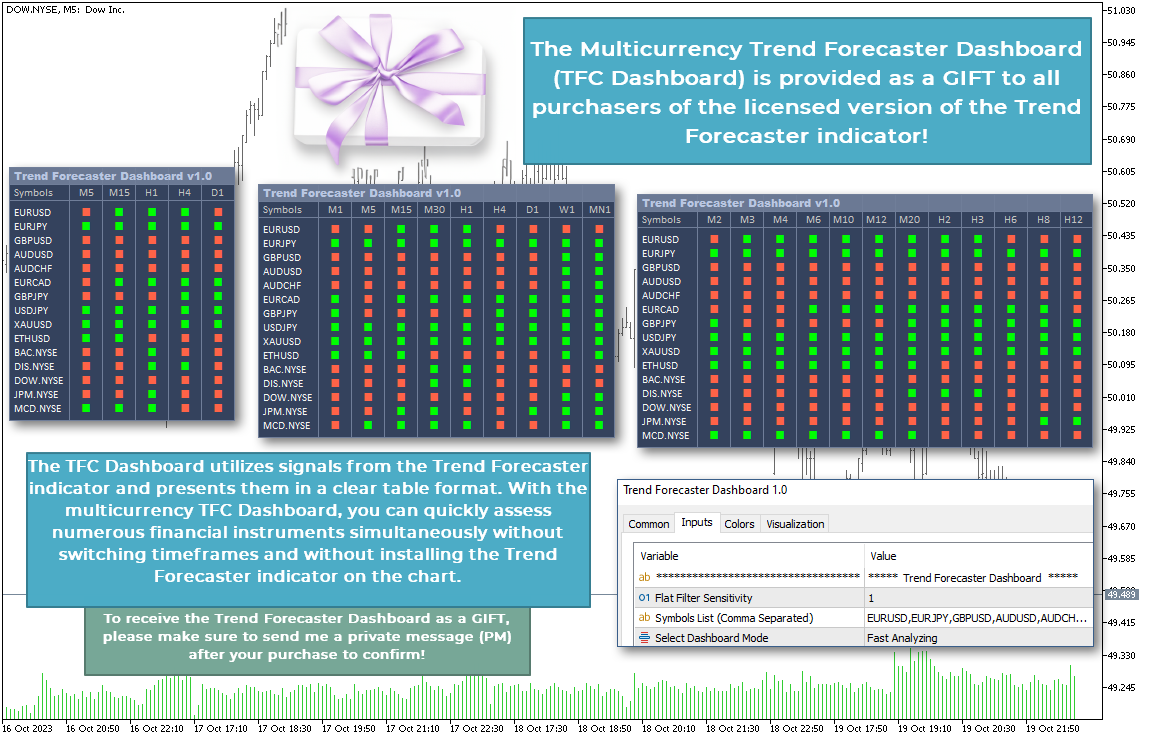
Additional Dashboard
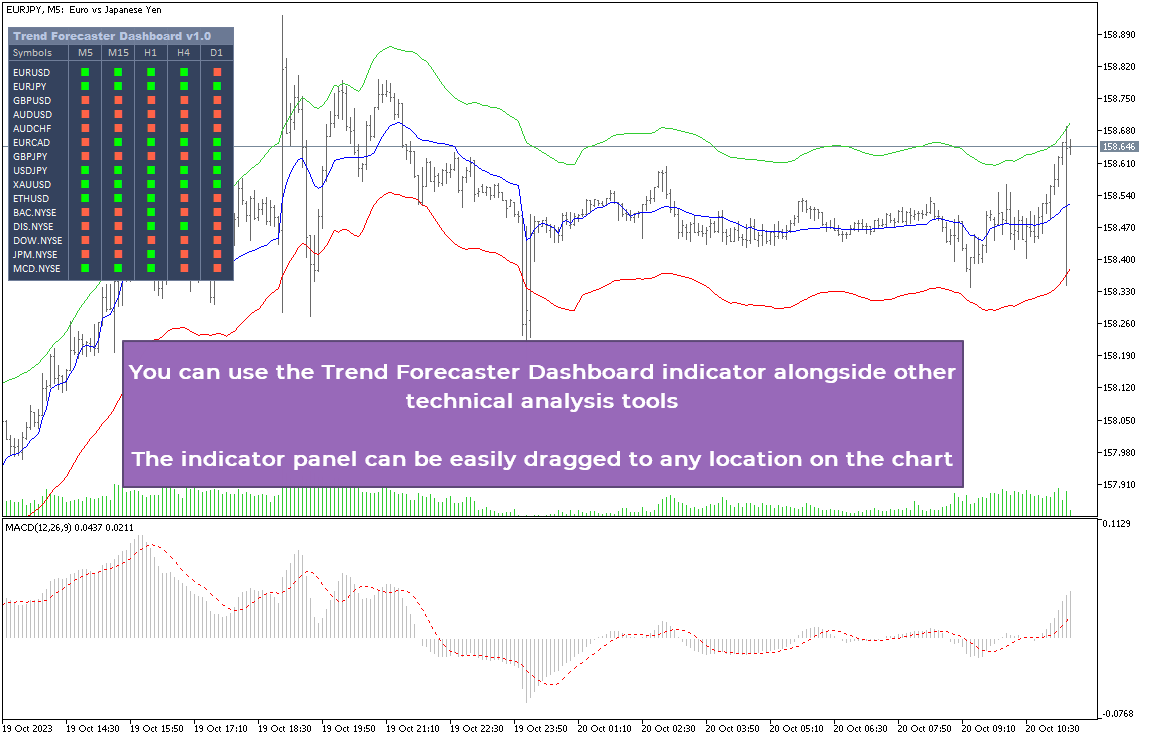
Trend Forecaster Dashboard is available for Trend Forecaster buyers as an additional tool. It helps monitor several symbols and timeframes from one panel, which can be useful for users who follow multiple markets.
To request the Dashboard, please contact me through the MQL5 messaging system after purchase.
Manual and Examples
You can find the Trend Forecaster manual and practical examples here:
Important Notes
Trend Forecaster is an analytical tool. It does not guarantee trading results and should not be used as the only basis for trading decisions. Market conditions can change, and every setup should be checked by the user before use.
Signal arrows do not repaint after appearing on a closed bar. Values on the current forming bar may change until the bar is closed.
If you still have any questions, you can send me a private message on MQL5.
If Trend Forecaster is useful for your market analysis, please support the project with your review on MQL5. A few words from real users help the product grow, help other traders discover it and give me strong motivation to keep developing new features, updates and additional tools for Trend Forecaster.


I find the indicator useful, particularly the bonus dashboard which I'm using to select which pairs to trade. Mr Alexey has been very helpful in replying to my questions on the use of the indicaotr. Many thanks.