
Otras clases en la biblioteca DoEasy (Parte 67): Clase de objeto de gráfico

Contenido
- Concepto
- Mejorando las clases de la biblioteca
- Clase de objeto de gráfico
- Simulación
- ¿Qué es lo próximo?
Concepto
Hoy empezaremos a desarrollar la funcionalidad de la biblioteca para trabajar con gráficos de símbolos. Se trata de nuestra principal herramienta de trabajo, por lo que invertiremos varios artículos para hacer de ella un elemento muy cómodo de usar. En primer lugar, crearemos un objeto de gráfico que almacenará todas las propiedades del gráfico. Modificando estas propiedades, podremos gestionarlo fácilmente. El conjunto de propiedades del objeto de gráfico será un conjunto de parámetros de gráfico de tipo entero, real y string. Mejorando el objeto de gráfico de forma gradual y paulatina, su conjunto de parámetros cambiará: algunos parámetros se añadirán, algunos se transferirán a otros objetos, etcétera. Vamos a comenzar por lo simple.
Además de crear un objeto de gráfico, hoy modificaremos levemente la clase de objeto de señal mql5 y la clase de colección de Señales MQL5.com. Por el momento, hemos organizado el trabajo con la colección de señales de tal forma que al crear por primera vez una lista completa con todas las señales disponibles, sus propiedades ya no cambien. Incluso si intentamos actualizar la lista de colección de nuevo, como máximo, se añadirá la señal que aparezca nuevamente en la base de Señales de MQL5.com, y las señales que se han añadido previamente a la lista de colecciones permanecerán sin modificar sus propiedades. Este no es el comportamiento correcto: las señales cambian sus propiedades como resultado del comercio en la cuenta del proveedor de señales. Por consiguiente, hoy modificaremos este comportamiento: con cualquier actualización de la lista de colección de señales, las nuevas señales se añadirán a la lista, mientras que las propiedades de las ya existentes serán actualizadas.
Mejorando las clases de la biblioteca
Ahora, hemos hecho posible en la clase de colección de señales de nuestra biblioteca que todos los valores de los parámetros de Señal MQL5.com se puedan introducir directamente en las propiedades correspondientes del constructor del objeto de señal mql5 al crear un nuevo objeto de señal. Necesitamos ñadir un método en el que todos los valores de los parámetros de la señal elegida encajen con las propiedades del objeto. Así, podremos actualizar las propiedades de un objeto de señal ya existente, seleccionar la señal deseada y llamar a este nuevo método. También necesitamos un método que seleccione la señal necesaria en la la base de Señales de MQL5.com según el identificador de la señal (en MQL5, la señal se selecciona solo según su índice, pero guardar el índice de la señal en las propiedades del objeto no es un método fiable, ya que los índices de la señal en la base de señales pueden cambiar con cierta certeza).
En el archivo \MQL5\Include\DoEasy\Objects\MQLSignalBase\MQLSignal.mqh, añadimos los tres nuevos métodos públicos:
un método para escribir los valores de los parámetros de la Señal MQL5.com seleccionada en las propiedades correspondientes del objeto de señal,
un método que retorna el índice de la señal en la base de Señales de MQL5.com según su identificador, y
un método que selecciona la señal especificada según su identificador en la Base de Señales de MQL5.com para seguir trabajando con ella:
//--- Compare CMQLSignal objects by a specified property (to sort the list by an MQL5 signal object)
   virtual int       Compare(const CObject *node,const int mode=0) const;
//--- Compare CMQLSignal objects by all properties (to search for equal MQL5 signal objects)
   bool              IsEqual(CMQLSignal* compared_obj) const;

//--- Set signal object properties
   void              SetProperties(void);
//--- Look for a signal with a specified ID in the database, return the signal index
   int               IndexBase(const long signal_id);
//--- Select a signal in the signal database by its ID
   bool              SelectBase(const long signal_id);

//--- Constructors
                     CMQLSignal(){;}
                     CMQLSignal(const long signal_id);
Desde el constructor paramétrico de la clase, transmitimos el registro de los parámetros de la señal (a las propiedades correspondientes del objeto) al nuevo método SetProperties() :
//+------------------------------------------------------------------+
//| Set object properties                                            |
//+------------------------------------------------------------------+
void CMQLSignal::SetProperties(void)
  {
   this.m_long_prop[SIGNAL_MQL5_PROP_SUBSCRIPTION_STATUS]            = (::SignalInfoGetInteger(SIGNAL_INFO_ID)==this.ID());
   this.m_long_prop[SIGNAL_MQL5_PROP_TRADE_MODE]                     = ::SignalBaseGetInteger(SIGNAL_BASE_TRADE_MODE);
   this.m_long_prop[SIGNAL_MQL5_PROP_DATE_PUBLISHED]                 = ::SignalBaseGetInteger(SIGNAL_BASE_DATE_PUBLISHED);
   this.m_long_prop[SIGNAL_MQL5_PROP_DATE_STARTED]                   = ::SignalBaseGetInteger(SIGNAL_BASE_DATE_STARTED);
   this.m_long_prop[SIGNAL_MQL5_PROP_DATE_UPDATED]                   = ::SignalBaseGetInteger(SIGNAL_BASE_DATE_UPDATED);
   this.m_long_prop[SIGNAL_MQL5_PROP_LEVERAGE]                       = ::SignalBaseGetInteger(SIGNAL_BASE_LEVERAGE);
   this.m_long_prop[SIGNAL_MQL5_PROP_PIPS]                           = ::SignalBaseGetInteger(SIGNAL_BASE_PIPS);
   this.m_long_prop[SIGNAL_MQL5_PROP_RATING]                         = ::SignalBaseGetInteger(SIGNAL_BASE_RATING);
   this.m_long_prop[SIGNAL_MQL5_PROP_SUBSCRIBERS]                    = ::SignalBaseGetInteger(SIGNAL_BASE_SUBSCRIBERS);
   this.m_long_prop[SIGNAL_MQL5_PROP_TRADES]                         = ::SignalBaseGetInteger(SIGNAL_BASE_TRADES);

   this.m_double_prop[this.IndexProp(SIGNAL_MQL5_PROP_BALANCE)]      = ::SignalBaseGetDouble(SIGNAL_BASE_BALANCE);
   this.m_double_prop[this.IndexProp(SIGNAL_MQL5_PROP_EQUITY)]       = ::SignalBaseGetDouble(SIGNAL_BASE_EQUITY);
   this.m_double_prop[this.IndexProp(SIGNAL_MQL5_PROP_GAIN)]         = ::SignalBaseGetDouble(SIGNAL_BASE_GAIN);
   this.m_double_prop[this.IndexProp(SIGNAL_MQL5_PROP_MAX_DRAWDOWN)] = ::SignalBaseGetDouble(SIGNAL_BASE_MAX_DRAWDOWN);
   this.m_double_prop[this.IndexProp(SIGNAL_MQL5_PROP_PRICE)]        = ::SignalBaseGetDouble(SIGNAL_BASE_PRICE);
   this.m_double_prop[this.IndexProp(SIGNAL_MQL5_PROP_ROI)]          = ::SignalBaseGetDouble(SIGNAL_BASE_ROI);

   this.m_string_prop[this.IndexProp(SIGNAL_MQL5_PROP_AUTHOR_LOGIN)] = ::SignalBaseGetString(SIGNAL_BASE_AUTHOR_LOGIN);
   this.m_string_prop[this.IndexProp(SIGNAL_MQL5_PROP_BROKER)]       = ::SignalBaseGetString(SIGNAL_BASE_BROKER);
   this.m_string_prop[this.IndexProp(SIGNAL_MQL5_PROP_BROKER_SERVER)]= ::SignalBaseGetString(SIGNAL_BASE_BROKER_SERVER);
   this.m_string_prop[this.IndexProp(SIGNAL_MQL5_PROP_NAME)]         = ::SignalBaseGetString(SIGNAL_BASE_NAME);
   this.m_string_prop[this.IndexProp(SIGNAL_MQL5_PROP_CURRENCY)]     = ::SignalBaseGetString(SIGNAL_BASE_CURRENCY);
  }
//+------------------------------------------------------------------+
Como la señal debe estar preseleccionada en la Base de Señales MQL5.com, obtener los valores de los parámetros de la señal y escribirlos en las propiedades del objeto implica que la señal esté a priori seleccionada.
En el constructor de la clase, en lugar de las líneas transmitidas al nuevo método, escribimos la llamada de este método:
//+------------------------------------------------------------------+
//| Parametric constructor                                           |
//+------------------------------------------------------------------+
CMQLSignal::CMQLSignal(const long signal_id)
  {
   this.m_long_prop[SIGNAL_MQL5_PROP_ID] = signal_id;
   this.SetProperties();
  }
//+------------------------------------------------------------------+
Método que retorna el índice de la señal especificado según su identificador en la Base de Señales de MQL5.com:
//+------------------------------------------------------------------+
//| Look for a signal with a specified ID in the database,           |
//| return the index of a detected signal                            |
//+------------------------------------------------------------------+
int CMQLSignal::IndexBase(const long signal_id)
  {
   int total=::SignalBaseTotal();
   for(int i=0;i<total;i++)
     {
      if(::SignalBaseSelect(i) && ::SignalBaseGetInteger(SIGNAL_BASE_ID)==signal_id)
         return i;
     }
   return WRONG_VALUE;
  }
//+------------------------------------------------------------------+
Aquí: en un ciclo por el número total de señales, seleccionamos la siguiente señal y comparamos su identificador con el identificador transmitido al método. Si los identificadores coinciden, retornaremos el índice del ciclo (es el índice de la señal en la Base). Si no se encuentra una señal con este identificador, retornaremos -1 .
Después de trabajar con este método, siempre que hayamos encontrado la señal, esta permanecerá seleccionada en la Base de Señales para seguir trabajando con ella.
Con esto, podemos dar por construido el método que selecciona una señal indicada según el identificador:
//+------------------------------------------------------------------+
//| Select a signal by its ID in the signal database                 |
//+------------------------------------------------------------------+
bool CMQLSignal::SelectBase(const long signal_id)
  {
   return(this.IndexBase(signal_id)!=WRONG_VALUE);
  }
//+------------------------------------------------------------------+
El método retorna una bandera que indica que la búsqueda de la señal según el identificador especificado no ha retornado -1. Es decir, si el índice de la señal ha sido encontrado (no es igual a -1), la señal será la seleccionada, y retornaremos true. Si la búsqueda de la señal ha devuelto -1, retornaremos false : no hay una señal con ese identificador, y la señal no está seleccionada, respectivamente.
En el archivo de la clase de colección de señales mql5 \MQL5\Include\DoEasy\Collections\MQLSignalsCollection.mqh, introducimos unas pequeñas mejoras en el método de actualización de la lista de colección:
//+------------------------------------------------------------------+
//| Update the collection list of MQL5 signal objects                |
//+------------------------------------------------------------------+
void CMQLSignalsCollection::Refresh(const bool messages=true)
  {
   this.m_signals_base_total=::SignalBaseTotal();
   //--- loop through all signals in the signal database
   for(int i=0;i<this.m_signals_base_total;i++)
     {
      //--- Select a signal from the signal database by the loop index
      if(!::SignalBaseSelect(i))
         continue;
      //--- Get the current signal ID and
      //--- create a new MQL5 signal object based on it
      long id=::SignalBaseGetInteger(SIGNAL_BASE_ID);
      CMQLSignal *signal=new CMQLSignal(id);
      if(signal==NULL)
         continue;
      //--- Set the sorting flag for the list by signal ID
      this.m_list.Sort(SORT_BY_SIGNAL_MQL5_ID);
      //--- Get the index of the MQL5 signal object in the list
      int index=this.m_list.Search(signal);
      //--- If such an object exists (the index exceeds -1)
      if(index!=WRONG_VALUE)
        {
         //--- Remove the newly created object,
         delete signal;
         //--- get the pointer to such an object in the list
         signal=this.m_list.At(index);
         //--- if the pointer is received, update all signal properties
         if(signal!=NULL)
            signal.SetProperties();
         //--- move on to the next loop iteration
         continue;
        }
      //--- No such object in the collection list yet
      //--- If failed to add a new signal object to the collection list,
      //--- remove the created object and go to the next loop iteration
      if(!this.m_list.InsertSort(signal))
        {
         delete signal;
         continue;
        }
      //--- If an MQL5 signal object is successfully added to the collection
      //--- and the new object message flag is set in the parameters passed to the method,
      //--- display a message about a newly found signal
      else if(messages)
        {
         ::Print(DFUN,CMessage::Text(MSG_MQLSIG_COLLECTION_TEXT_SIGNALS_NEW),":");
         signal.PrintShort(true);
        }
     }
  }
//+------------------------------------------------------------------+
Aquí: en el nuevo bloque de código, la lógica completa se describe en los comentarios. En definitiva, ahora los objetos existentes en la colección no se omiten, sino que para ellos se llama el nuevo método SetProperties(), analizado anteriormente, que escribe en todas las propiedades del objeto los valores de los parámetros correspondientes de la señal seleccionada en la base.
Con esto, podemos dar por finalizada la mejora de las clases para trabajar con las Señales de MQL5.com.
Vamos a empezar a desarrollar la clase del objeto de gráfico.
Al igual que el gráfico, el objeto de gráfico tiene muchos parámetros. En primer lugar, necesitamos crear los nuevos mensajes de texto que están relacionados de una u otra forma con el objeto de gráfico.
En el archivo \MQL5\Include\DoEasy\Data.mqh, escribimos los índices de los nuevos mensajes:
//--- CChartObj
   MSG_CHART_OBJ_ID,                                  // Chart ID
   MSG_CHART_OBJ_SHOW,                                // Draw price chart attributes
   MSG_CHART_OBJ_IS_OBJECT,                           // Chart object
   MSG_CHART_OBJ_BRING_TO_TOP,                        // Chart above all others
   MSG_CHART_OBJ_CONTEXT_MENU,                        // Access the context menu using the right click
   MSG_CHART_OBJ_CROSSHAIR_TOOL,                      // Access the Crosshair tool using the middle click
   MSG_CHART_OBJ_MOUSE_SCROLL,                        // Scroll the chart horizontally using the left mouse button
   MSG_CHART_OBJ_EVENT_MOUSE_WHEEL,                   // Send messages about mouse wheel events to all MQL5 programs on a chart
   MSG_CHART_OBJ_EVENT_MOUSE_MOVE,                    // Send messages about mouse button click and movement events to all MQL5 programs on a chart
   MSG_CHART_OBJ_EVENT_OBJECT_CREATE,                 // Send messages about the graphical object creation event to all MQL5 programs on a chart
   MSG_CHART_OBJ_EVENT_OBJECT_DELETE,                 // Send messages about the graphical object destruction event to all MQL5 programs on a chart
   MSG_CHART_OBJ_MODE,                                // Chart type
   MSG_CHART_OBJ_FOREGROUND,                          // Price chart in the foreground
   MSG_CHART_OBJ_SHIFT,                               // Shift of the price chart from the right border
   MSG_CHART_OBJ_AUTOSCROLL,                          // Auto scroll to the right border of the chart
   MSG_CHART_OBJ_KEYBOARD_CONTROL,                    // Manage the chart using a keyboard
   MSG_CHART_OBJ_QUICK_NAVIGATION,                    // Allow the chart to intercept Space and Enter key strokes to activate the quick navigation bar
   MSG_CHART_OBJ_SCALE,                               // Scale
   MSG_CHART_OBJ_SCALEFIX,                            // Fixed scale
   MSG_CHART_OBJ_SCALEFIX_11,                         // Scale 1:1
   MSG_CHART_OBJ_SCALE_PT_PER_BAR,                    // Scale in points per bar
   MSG_CHART_OBJ_SHOW_TICKER,                         // Display a symbol ticker in the upper left corner
   MSG_CHART_OBJ_SHOW_OHLC,                           // Display OHLC values in the upper left corner
   MSG_CHART_OBJ_SHOW_BID_LINE,                       // Display Bid value as a horizontal line on the chart
   MSG_CHART_OBJ_SHOW_ASK_LINE,                       // Display Ask value as a horizontal line on a chart
   MSG_CHART_OBJ_SHOW_LAST_LINE,                      // Display Last value as a horizontal line on a chart
   MSG_CHART_OBJ_SHOW_PERIOD_SEP,                     // Display vertical separators between adjacent periods
   MSG_CHART_OBJ_SHOW_GRID,                           // Display a grid on the chart
   MSG_CHART_OBJ_SHOW_VOLUMES,                        // Display volumes on a chart
   MSG_CHART_OBJ_SHOW_OBJECT_DESCR,                   // Display text descriptions of objects
   MSG_CHART_OBJ_VISIBLE_BARS,                        // Number of bars on a chart that are available for display
   MSG_CHART_OBJ_WINDOWS_TOTAL,                       // Total number of chart windows including indicator subwindows
   MSG_CHART_OBJ_WINDOW_IS_VISIBLE,                   // Subwindow visibility
   MSG_CHART_OBJ_WINDOW_HANDLE,                       // Chart window handle
   MSG_CHART_OBJ_WINDOW_YDISTANCE,                    // Distance in Y axis pixels between the upper frame of the indicator subwindow and the upper frame of the chart main window
   MSG_CHART_OBJ_FIRST_VISIBLE_BAR,                   // Number of the first visible bar on the chart
   MSG_CHART_OBJ_WIDTH_IN_BARS,                       // Width of the chart in bars
   MSG_CHART_OBJ_WIDTH_IN_PIXELS,                     // Width of the chart in pixels
   MSG_CHART_OBJ_HEIGHT_IN_PIXELS,                    // Height of the chart in pixels
   MSG_CHART_OBJ_COLOR_BACKGROUND,                    // Color of background of the chart
   MSG_CHART_OBJ_COLOR_FOREGROUND,                    // Color of axes, scale and OHLC line
   MSG_CHART_OBJ_COLOR_GRID,                          // Grid color
   MSG_CHART_OBJ_COLOR_VOLUME,                        // Color of volumes and position opening levels
   MSG_CHART_OBJ_COLOR_CHART_UP,                      // Color for the up bar, shadows and body borders of bull candlesticks
   MSG_CHART_OBJ_COLOR_CHART_DOWN,                    // Color of down bar, its shadow and border of body of the bullish candlestick
   MSG_CHART_OBJ_COLOR_CHART_LINE,                    // Color of the chart line and the Doji candlesticks
   MSG_CHART_OBJ_COLOR_CANDLE_BULL,                   // Color of body of a bullish candlestick
   MSG_CHART_OBJ_COLOR_CANDLE_BEAR,                   // Color of body of a bearish candlestick
   MSG_CHART_OBJ_COLOR_BID,                           // Color of the Bid price line
   MSG_CHART_OBJ_COLOR_ASK,                           // Color of the Ask price line
   MSG_CHART_OBJ_COLOR_LAST,                          // Color of the last performed deal's price line (Last)
   MSG_CHART_OBJ_COLOR_STOP_LEVEL,                    // Color of stop order levels (Stop Loss and Take Profit)
   MSG_CHART_OBJ_SHOW_TRADE_LEVELS,                   // Display trade levels on the chart (levels of open positions, Stop Loss, Take Profit and pending orders)
   MSG_CHART_OBJ_DRAG_TRADE_LEVELS,                   // Drag trading levels on a chart using a mouse
   MSG_CHART_OBJ_SHOW_DATE_SCALE,                     // Display the time scale on a chart
   MSG_CHART_OBJ_SHOW_PRICE_SCALE,                    // Display a price scale on a chart
   MSG_CHART_OBJ_SHOW_ONE_CLICK,                      // Display the quick trading panel on the chart
   MSG_CHART_OBJ_IS_MAXIMIZED,                        // Chart window maximized
   MSG_CHART_OBJ_IS_MINIMIZED,                        // Chart window minimized
   MSG_CHART_OBJ_IS_DOCKED,                           // Chart window docked
   MSG_CHART_OBJ_FLOAT_LEFT,                          // Left coordinate of the undocked chart window relative to the virtual screen
   MSG_CHART_OBJ_FLOAT_TOP,                           // Upper coordinate of the undocked chart window relative to the virtual screen
   MSG_CHART_OBJ_FLOAT_RIGHT,                         // Right coordinate of the undocked chart window relative to the virtual screen
   MSG_CHART_OBJ_FLOAT_BOTTOM,                        // Bottom coordinate of the undocked chart window relative to the virtual screen

   MSG_CHART_OBJ_SHIFT_SIZE,                          // shift size of the zero bar from the right border in %
   MSG_CHART_OBJ_FIXED_POSITION,                      // Chart fixed position from the left border in %
   MSG_CHART_OBJ_FIXED_MAX,                           // Chart fixed maximum
   MSG_CHART_OBJ_FIXED_MIN,                           // Chart fixed minimum
   MSG_CHART_OBJ_POINTS_PER_BAR,                      // Scale in points per bar
   MSG_CHART_OBJ_PRICE_MIN,                           // Chart minimum
   MSG_CHART_OBJ_PRICE_MAX,                           // Chart maximum

   MSG_CHART_OBJ_COMMENT,                             // Chart comment text
   MSG_CHART_OBJ_EXPERT_NAME,                         // Name of an EA launched on the chart
   MSG_CHART_OBJ_SCRIPT_NAME,                         // Name of a script launched on the chart

   MSG_CHART_OBJ_CHART_BARS,                          // Display as bars
   MSG_CHART_OBJ_CHART_CANDLES,                       // Display as Japaneses candlesticks
   MSG_CHART_OBJ_CHART_LINE,                          // Display as a line drawn at Close prices
   MSG_CHART_OBJ_CHART_VOLUME_HIDE,                   // Volumes not displayed
   MSG_CHART_OBJ_CHART_VOLUME_TICK,                   // Tick volumes
   MSG_CHART_OBJ_CHART_VOLUME_REAL,                   // Trading volumes

   MSG_CHART_OBJ_CHART_WINDOW,                        // Chart window

  };
//+------------------------------------------------------------------+
y los mensajes de texto que se corresponden con los índices nuevamente añadidos:
//--- CChartObj
   {"Идентификатор графика","Chart ID"},
   {"Отрисовка атрибутов ценового графика","Drawing attributes of a price chart"},
   {"Объект \"График\"","Object \"Chart\""},
   {"График поверх всех других","Chart on top of other charts"},
   {"Доступ к контекстному меню по нажатию правой клавиши мыши","Accessing the context menu by pressing the right mouse button"},
   {"Доступ к инструменту \"Перекрестие\" по нажатию средней клавиши мыши","Accessing the \"Crosshair tool\" by pressing the middle mouse button"},
   {"Прокрутка графика левой кнопкой мышки по горизонтали","Scrolling the chart horizontally using the left mouse button"},
   {"Отправка всем mql5-программам на графике сообщений о событиях колёсика мыши","Sending messages about mouse wheel events to all mql5 programs on a chart"},
   {"Отправка всем mql5-программам на графике сообщений о событиях перемещения и нажатия кнопок мыши","Send notifications of mouse move and mouse click events to all mql5 programs on a chart"},
   {"Отправка всем mql5-программам на графике сообщений о событии создания графического объекта","Send a notification of an event of new object creation to all mql5-programs on a chart"},
   {"Отправка всем mql5-программам на графике сообщений о событии уничтожения графического объекта","Send a notification of an event of object deletion to all mql5-programs on a chart"},
   {"Тип графика","Chart type"},
   {"Ценовой график на переднем плане","Price chart in the foreground"},
   {"Отступ ценового графика от правого края","Price chart indent from the right border"},
   {"Автоматический переход к правому краю графика","Automatic moving to the right border of the chart"},
   {"Управление графиком с помощью клавиатуры","Managing the chart using a keyboard"},
   {"Перехват графиком нажатий клавиш Space и Enter для активации строки быстрой навигации","Allowed to intercept Space and Enter key presses on the chart to activate the quick navigation bar"},
   {"Масштаб","Scale"},
   {"Фиксированный масштаб","Fixed scale mode"},
   {"Масштаб 1:1","Scale 1:1 mode"},
   {"Масштаб в пунктах на бар","Scale to be specified in points per bar"},
   {"Отображение в левом верхнем углу тикера символа","Display a symbol ticker in the upper left corner"},
   {"Отображение в левом верхнем углу значений OHLC","Display OHLC values in the upper left corner"},
   {"Отображение значения Bid горизонтальной линией на графике","Display Bid values as a horizontal line in a chart"},
   {"Отображение значения Ask горизонтальной линией на графике","Display Ask values as a horizontal line in a chart"},
   {"Отображение значения Last горизонтальной линией на графике","Display Last values as a horizontal line in a chart"},
   {"Отображение вертикальных разделителей между соседними периодами","Display vertical separators between adjacent periods"},
   {"Отображение сетки на графике","Display grid in the chart"},
   {"Отображение объемов на графике","Display volume in the chart"},
   {"Отображение текстовых описаний объектов","Display textual descriptions of objects"},
   {"Количество баров на графике, доступных для отображения","The number of bars on the chart that can be displayed"},
   {"Общее количество окон графика с подокнами индикаторов","The total number of chart windows, including indicator subwindows"},
   {"Видимость подокон","Visibility of subwindows"},
   {"Хэндл окна графика","Chart window handle"},
   {"Дистанция в пикселях по оси Y между верхней рамкой подокна индикатора и верхней рамкой главного окна графика","The distance between the upper frame of the indicator subwindow and the upper frame of the main chart window"},
   {"Номер первого видимого бара на графике","Number of the first visible bar in the chart"},
   {"Ширина графика в барах","Chart width in bars"},
   {"Ширина графика в пикселях","Chart width in pixels"},
   {"Высота графика в пикселях","Chart height in pixels"},
   {"Цвет фона графика","Chart background color"},
   {"Цвет осей, шкалы и строки OHLC","Color of axes, scales and OHLC line"},
   {"Цвет сетки","Grid color"},
   {"Цвет объемов и уровней открытия позиций","Color of volumes and position opening levels"},
   {"Цвет бара вверх, тени и окантовки тела бычьей свечи","Color for the up bar, shadows and body borders of bull candlesticks"},
   {"Цвет бара вниз, тени и окантовки тела медвежьей свечи","Color for the down bar, shadows and body borders of bear candlesticks"},
   {"Цвет линии графика и японских свечей \"Доджи\"","Line chart color and color of \"Doji\" Japanese candlesticks"},
   {"Цвет тела бычьей свечи","Body color of a bull candlestick"},
   {"Цвет тела медвежьей свечи","Body color of a bear candlestick"},
   {"Цвет линии Bid-цены","Bid price level color"},
   {"Цвет линии Ask-цены","Ask price level color"},
   {"Цвет линии цены последней совершенной сделки (Last)","Line color of the last executed deal price (Last)"},
   {"Цвет уровней стоп-ордеров (Stop Loss и Take Profit)","Color of stop order levels (Stop Loss and Take Profit)"},
   {"Отображение на графике торговых уровней (уровни открытых позиций, Stop Loss, Take Profit и отложенных ордеров)","Displaying trade levels in the chart (levels of open positions, Stop Loss, Take Profit and pending orders)"},
   {"Перетаскивание торговых уровней на графике с помощью мышки","Permission to drag trading levels on a chart with a mouse"},
   {"Отображение на графике шкалы времени","Showing the time scale on a chart"},
   {"Отображение на графике ценовой шкалы","Showing the price scale on a chart"},
   {"Отображение на графике панели быстрой торговли","Showing the \"One click trading\" panel on a chart"},
   {"Окно графика развернуто","Chart window is maximized"},
   {"Окно графика свернуто","Chart window is minimized"},
   {"Окно графика закреплено","The chart window is docked"},
   {"Левая координата открепленного графика относительно виртуального экрана","The left coordinate of the undocked chart window relative to the virtual screen"},
   {"Верхняя координата открепленного графика относительно виртуального экрана","The top coordinate of the undocked chart window relative to the virtual screen"},
   {"Правая координата открепленного графика  относительно виртуального экрана","The right coordinate of the undocked chart window relative to the virtual screen"},
   {"Нижняя координата открепленного графика  относительно виртуального экрана","The bottom coordinate of the undocked chart window relative to the virtual screen"},

   {"Размер отступа нулевого бара от правого края в процентах","The size of the zero bar indent from the right border in percents"},
   {"Положение фиксированной позиции графика от левого края в процентах","Chart fixed position from the left border in percent value"},
   {"Фиксированный максимум графика","Fixed  chart maximum"},
   {"Фиксированный минимум графика","Fixed  chart minimum "},
   {"Масштаб в пунктах на бар","Scale in points per bar"},
   {"Минимум графика","Chart minimum"},
   {"Максимум графика","Chart maximum"},

   {"Текст комментария на графике","Text of a comment in a chart"},
   {"Имя эксперта, запущенного на графике","The name of the Expert Advisor running on the chart"},
   {"Имя скрипта, запущенного на графике","The name of the script running on the chart"},

   {"Отображение в виде баров","Display as a sequence of bars"},
   {"Отображение в виде японских свечей","Display as Japanese candlesticks"},
   {"Отображение в виде линии, проведенной по ценам Close","Display as a line drawn by Close prices"},
   {"Объемы не показаны","Volumes are not shown"},
   {"Тиковые объемы","Tick volumes"},
   {"Торговые объемы","Trade volumes"},

   {"Окно графика","Chart window"},

  };
//+---------------------------------------------------------------------+
Para comprender por qué necesitamos introducir las constantes-índices nombradas de los mensajes, los mensajes en sí mismos y, en general, para comprender cómo funcionan estas listas, recomendamos consultar el artículo 19, que describe con detalle el proceso de desarrollo de la clase de mensaje de la biblioteca.
Para mostrar la descripción de algunas propiedades del objeto de gráfico creado, necesitamos dos funciones: una para retornar la descripción del modo de visualización del gráfico (barras, velas, línea) y otra para retornar la descripción del modo de visualización del volumen en el gráfico (no se muestra, ticks, real). Para tener siempre estas funciones "a mano", las añadiremos al archivo de funciones de servicio \MQL5\Include\DoEasy\Services\DELib.mqh:
//+------------------------------------------------------------------+
//| Return the description of the method of displaying a price chart |
//+------------------------------------------------------------------+
string ChartModeDescription(ENUM_CHART_MODE mode)
  {
   return
     (
      mode==CHART_BARS     ? CMessage::Text(MSG_CHART_OBJ_CHART_BARS)      :
      mode==CHART_CANDLES  ? CMessage::Text(MSG_CHART_OBJ_CHART_CANDLES)   :
      CMessage::Text(MSG_CHART_OBJ_CHART_LINE)
     );
  }
//+--------------------------------------------------------------------------+
//|Return the description of the mode of displaying volumes on a price chart |
//+--------------------------------------------------------------------------+
string ChartModeVolumeDescription(ENUM_CHART_VOLUME_MODE mode)
  {
   return
     (
      mode==CHART_VOLUME_TICK ? CMessage::Text(MSG_CHART_OBJ_CHART_VOLUME_TICK)  :
      mode==CHART_VOLUME_REAL ? CMessage::Text(MSG_CHART_OBJ_CHART_VOLUME_REAL)  :
      CMessage::Text(MSG_CHART_OBJ_CHART_VOLUME_HIDE)
     );
  }
//+------------------------------------------------------------------+
La propiedad del gráfico correspondiente es transmitida a ambas funciones; su correspondencia con una de las constantes de enumeración se verifica en la función y luego se retorna una descripción de línea de este modo del gráfico/volúmenes.
Cada uno de los objetos de la biblioteca tiene una lista de propiedades especificadas en el archivo \MQL5\Include\DoEasy\Defines.mqh. El objeto de gráfico no es una excepción, y para él también escribiremos todas las propiedades necesarias en tres enumeraciones con las propiedades de tipo entero, real y string:
//+------------------------------------------------------------------+
//| Data for working with charts                                     |
//+------------------------------------------------------------------+
//+------------------------------------------------------------------+
//| List of possible chart events                                    |
//+------------------------------------------------------------------+
#define CHART_EVENTS_NEXT_CODE  (SIGNAL_MQL5_EVENTS_NEXT_CODE+1)   // The code of the next event after the last chart event code
//+------------------------------------------------------------------+
//| Chart integer property                                           |
//+------------------------------------------------------------------+
enum ENUM_CHART_PROP_INTEGER
  {
   CHART_PROP_ID = 0,                                 // Chart ID
   CHART_PROP_TIMEFRAME,                              // Chart timeframe
   CHART_PROP_SHOW,                                   // Price chart drawing
   CHART_PROP_IS_OBJECT,                              // Chart object (OBJ_CHART) identification attribute
   CHART_PROP_BRING_TO_TOP,                           // Show chart above all others
   CHART_PROP_CONTEXT_MENU,                           // Enable/disable access to the context menu using the right click
   CHART_PROP_CROSSHAIR_TOOL,                         // Enable/disable access to the Crosshair tool using the middle click
   CHART_PROP_MOUSE_SCROLL,                           // Scroll the chart horizontally using the left mouse button
   CHART_PROP_EVENT_MOUSE_WHEEL,                      // Send messages about mouse wheel events (CHARTEVENT_MOUSE_WHEEL) to all MQL5 programs on a chart
   CHART_PROP_EVENT_MOUSE_MOVE,                       // Send messages about mouse button click and movement events (CHARTEVENT_MOUSE_MOVE) to all MQL5 programs on a chart
   CHART_PROP_EVENT_OBJECT_CREATE,                    // Send messages about the graphical object creation event (CHARTEVENT_OBJECT_CREATE) to all MQL5 programs on a chart
   CHART_PROP_EVENT_OBJECT_DELETE,                    // Send messages about the graphical object destruction event (CHARTEVENT_OBJECT_DELETE) to all MQL5 programs on a chart
   CHART_PROP_MODE,                                   // Type of the chart (candlesticks, bars or line (ENUM_CHART_MODE))
   CHART_PROP_FOREGROUND,                             // Price chart in the foreground
   CHART_PROP_SHIFT,                                  // Mode of shift of the price chart from the right border
   CHART_PROP_AUTOSCROLL,                             // The mode of automatic shift to the right border of the chart
   CHART_PROP_KEYBOARD_CONTROL,                       // Allow managing the chart using a keyboard
   CHART_PROP_QUICK_NAVIGATION,                       // Allow the chart to intercept Space and Enter key strokes to activate the quick navigation bar
   CHART_PROP_SCALE,                                  // Scale
   CHART_PROP_SCALEFIX,                               // Fixed scale mode
   CHART_PROP_SCALEFIX_11,                            // 1:1 scale mode
   CHART_PROP_SCALE_PT_PER_BAR,                       // The mode of specifying the scale in points per bar
   CHART_PROP_SHOW_TICKER,                            // Display a symbol ticker in the upper left corner
   CHART_PROP_SHOW_OHLC,                              // Display OHLC values in the upper left corner
   CHART_PROP_SHOW_BID_LINE,                          // Display Bid value as a horizontal line on the chart
   CHART_PROP_SHOW_ASK_LINE,                          // Display Ask value as a horizontal line on a chart
   CHART_PROP_SHOW_LAST_LINE,                         // Display Last value as a horizontal line on a chart
   CHART_PROP_SHOW_PERIOD_SEP,                        // Display vertical separators between adjacent periods
   CHART_PROP_SHOW_GRID,                              // Display a grid on the chart
   CHART_PROP_SHOW_VOLUMES,                           // Display volumes on a chart
   CHART_PROP_SHOW_OBJECT_DESCR,                      // Display text descriptions of objects
   CHART_PROP_VISIBLE_BARS,                           // Number of bars on a chart that are available for display
   CHART_PROP_WINDOWS_TOTAL,                          // The total number of chart windows including indicator subwindows
   //CHART_PROP_WINDOW_IS_VISIBLE,                      // Subwindow visibility
   CHART_PROP_WINDOW_HANDLE,                          // Chart window handle
   //CHART_PROP_WINDOW_YDISTANCE,                       // Distance in Y axis pixels between the upper frame of the indicator subwindow and the upper frame of the chart main window
   CHART_PROP_FIRST_VISIBLE_BAR,                      // Number of the first visible bar on the chart
   CHART_PROP_WIDTH_IN_BARS,                          // Width of the chart in bars
   CHART_PROP_WIDTH_IN_PIXELS,                        // Width of the chart in pixels
   //CHART_PROP_HEIGHT_IN_PIXELS,                       // Height of the chart in pixels
   CHART_PROP_COLOR_BACKGROUND,                       // Color of background of the chart
   CHART_PROP_COLOR_FOREGROUND,                       // Color of axes, scale and OHLC line
   CHART_PROP_COLOR_GRID,                             // Grid color
   CHART_PROP_COLOR_VOLUME,                           // Color of volumes and position opening levels
   CHART_PROP_COLOR_CHART_UP,                         // Color for the up bar, shadows and body borders of bull candlesticks
   CHART_PROP_COLOR_CHART_DOWN,                       // Color of down bar, its shadow and border of body of the bullish candlestick
   CHART_PROP_COLOR_CHART_LINE,                       // Color of the chart line and the Doji candlesticks
   CHART_PROP_COLOR_CANDLE_BULL,                      // Color of body of a bullish candlestick
   CHART_PROP_COLOR_CANDLE_BEAR,                      // Color of body of a bearish candlestick
   CHART_PROP_COLOR_BID,                              // Color of the Bid price line
   CHART_PROP_COLOR_ASK,                              // Color of the Ask price line
   CHART_PROP_COLOR_LAST,                             // Color of the last performed deal's price line (Last)
   CHART_PROP_COLOR_STOP_LEVEL,                       // Color of stop order levels (Stop Loss and Take Profit)
   CHART_PROP_SHOW_TRADE_LEVELS,                      // Display trade levels on the chart (levels of open positions, Stop Loss, Take Profit and pending orders)
   CHART_PROP_DRAG_TRADE_LEVELS,                      // Enable the ability to drag trading levels on a chart using mouse
   CHART_PROP_SHOW_DATE_SCALE,                        // Display the time scale on a chart
   CHART_PROP_SHOW_PRICE_SCALE,                       // Display a price scale on a chart
   CHART_PROP_SHOW_ONE_CLICK,                         // Display the quick trading panel on the chart
   CHART_PROP_IS_MAXIMIZED,                           // Chart window maximized
   CHART_PROP_IS_MINIMIZED,                           // Chart window minimized
   CHART_PROP_IS_DOCKED,                              // Chart window docked
   CHART_PROP_FLOAT_LEFT,                             // Left coordinate of the undocked chart window relative to the virtual screen
   CHART_PROP_FLOAT_TOP,                              // Upper coordinate of the undocked chart window relative to the virtual screen
   CHART_PROP_FLOAT_RIGHT,                            // Right coordinate of the undocked chart window relative to the virtual screen
   CHART_PROP_FLOAT_BOTTOM,                           // Bottom coordinate of the undocked chart window relative to the virtual screen
  };
#define CHART_PROP_INTEGER_TOTAL (62)                 // Total number of integer properties
#define CHART_PROP_INTEGER_SKIP  (0)                  // Number of integer DOM properties not used in sorting
//+------------------------------------------------------------------+
//| Chart real properties                                            |
//+------------------------------------------------------------------+
enum ENUM_CHART_PROP_DOUBLE
  {
   CHART_PROP_SHIFT_SIZE = CHART_PROP_INTEGER_TOTAL,  // Shift size of the zero bar from the right border in %
   CHART_PROP_FIXED_POSITION,                         // Chart fixed position from the left border in %
   CHART_PROP_FIXED_MAX,                              // Chart fixed maximum
   CHART_PROP_FIXED_MIN,                              // Chart fixed minimum
   CHART_PROP_POINTS_PER_BAR,                         // Scale in points per bar
   CHART_PROP_PRICE_MIN,                              // Chart minimum
   CHART_PROP_PRICE_MAX,                              // Chart maximum
  };
#define CHART_PROP_DOUBLE_TOTAL  (7)                  // Total number of real properties
#define CHART_PROP_DOUBLE_SKIP   (0)                  // Number of real properties not used in sorting
//+------------------------------------------------------------------+
//| Chart string properties                                          |
//+------------------------------------------------------------------+
enum ENUM_CHART_PROP_STRING
  {
   CHART_PROP_COMMENT = (CHART_PROP_INTEGER_TOTAL+CHART_PROP_DOUBLE_TOTAL), // Chart comment text
   CHART_PROP_EXPERT_NAME,                            // Name of an EA launched on the chart
   CHART_PROP_SCRIPT_NAME,                            // Name of a script launched on the chart
   CHART_PROP_SYMBOL,                                 // Chart symbol
  };
#define CHART_PROP_STRING_TOTAL  (4)                  // Total number of string properties
//+------------------------------------------------------------------+
Aún no necesitamos las tres propiedades comentadas en la enumeración de las propiedades de tipo entro del objeto; las incluimos aquí porque estas propiedades están presentes en el gráfico, pero se refieren no solo al objeto de gráfico (la ventana principal del gráfico), sino también a las subventanas de la ventana principal, y no pueden ser propiedades exclusivas de un solo objeto de gráfico. Introduciremos su uso un poco más tarde.
Y, como de costumbre, después de añadir las nuevas enumeraciones de las propiedades del objeto, necesitaremos añadir una enumeración con los posibles criterios de clasificación para estos objetos:
//+------------------------------------------------------------------+
//| Possible chart sorting criteria                                  |
//+------------------------------------------------------------------+
#define FIRST_CHART_DBL_PROP  (CHART_PROP_INTEGER_TOTAL-CHART_PROP_INTEGER_SKIP)
#define FIRST_CHART_STR_PROP  (CHART_PROP_INTEGER_TOTAL-CHART_PROP_INTEGER_SKIP+CHART_PROP_DOUBLE_TOTAL-CHART_PROP_DOUBLE_SKIP)
enum ENUM_SORT_CHART_MODE
  {
//--- Sort by integer properties
   SORT_BY_CHART_SHOW = 0,                            // Sort by the price chart drawing attribute
   SORT_BY_CHART_IS_OBJECT,                           // Sort by chart object (OBJ_CHART) identification attribute
   SORT_BY_CHART_BRING_TO_TOP,                        // Sort by the flag of displaying a chart above all others
   SORT_BY_CHART_CONTEXT_MENU,                        // Sort by the flag of enabling/disabling access to the context menu using the right click
   SORT_BY_CHART_CROSSHAIR_TOO,                       // Sort by the flag of enabling/disabling access to the Crosshair tool using the middle click
   SORT_BY_CHART_MOUSE_SCROLL,                        // Sort by the flag of scrolling the chart horizontally using the left mouse button
   SORT_BY_CHART_EVENT_MOUSE_WHEEL,                   // Sort by the flag of sending messages about mouse wheel events to all MQL5 programs on a chart
   SORT_BY_CHART_EVENT_MOUSE_MOVE,                    // Sort by the flag of sending messages about mouse button click and movement events to all MQL5 programs on a chart
   SORT_BY_CHART_EVENT_OBJECT_CREATE,                 // Sort by the flag of sending messages about the graphical object creation event to all MQL5 programs on a chart
   SORT_BY_CHART_EVENT_OBJECT_DELETE,                 // Sort by the flag of sending messages about the graphical object destruction event to all MQL5 programs on a chart
   SORT_BY_CHART_MODE,                                // Sort by chart type
   SORT_BY_CHART_FOREGROUND,                          // Sort by the "Price chart in the foreground" flag
   SORT_BY_CHART_SHIFT,                               // Sort by the "Mode of shift of the price chart from the right border" flag
   SORT_BY_CHART_AUTOSCROLL,                          // Sort by the "The mode of automatic shift to the right border of the chart" flag
   SORT_BY_CHART_KEYBOARD_CONTROL,                    // Sort by the flag allowing the chart management using a keyboard
   SORT_BY_CHART_QUICK_NAVIGATION,                    // Sort by the flag allowing the chart to intercept Space and Enter key strokes to activate the quick navigation bar
   SORT_BY_CHART_SCALE,                               // Sort by scale
   SORT_BY_CHART_SCALEFIX,                            // Sort by the fixed scale flag
   SORT_BY_CHART_SCALEFIX_11,                         // Sort by the 1:1 scale flag
   SORT_BY_CHART_SCALE_PT_PER_BAR,                    // Sort by the flag of specifying the scale in points per bar
   SORT_BY_CHART_SHOW_TICKER,                         // Sort by the flag displaying a symbol ticker in the upper left corner
   SORT_BY_CHART_SHOW_OHLC,                           // Sort by the flag displaying OHLC values in the upper left corner
   SORT_BY_CHART_SHOW_BID_LINE,                       // Sort by the flag displaying Bid value as a horizontal line on the chart
   SORT_BY_CHART_SHOW_ASK_LINE,                       // Sort by the flag displaying Ask value as a horizontal line on the chart
   SORT_BY_CHART_SHOW_LAST_LINE,                      // Sort by the flag displaying Last value as a horizontal line on the chart
   SORT_BY_CHART_SHOW_PERIOD_SEP,                     // Sort by the flag displaying vertical separators between adjacent periods
   SORT_BY_CHART_SHOW_GRID,                           // Sort by the flag of displaying a grid on the chart
   SORT_BY_CHART_SHOW_VOLUMES,                        // Sort by the mode of displaying volumes on a chart
   SORT_BY_CHART_SHOW_OBJECT_DESCR,                   // Sort by the flag of displaying object text descriptions
   SORT_BY_CHART_VISIBLE_BARS,                        // Sort by the number of bars on a chart that are available for display
   SORT_BY_CHART_WINDOWS_TOTAL,                       // Sort by the total number of chart windows including indicator subwindows
   SORT_BY_CHART_WINDOW_IS_VISIBLE,                   // Sort by the subwindow visibility flag
   SORT_BY_CHART_WINDOW_HANDLE,                       // Sort by the chart handle
   SORT_BY_CHART_WINDOW_YDISTANCE,                    // Sort by the distance in Y axis pixels between the upper frame of the indicator subwindow and the upper frame of the chart main window
   SORT_BY_CHART_FIRST_VISIBLE_BAR,                   // Sort by the number of the first visible bar on the chart
   SORT_BY_CHART_WIDTH_IN_BARS,                       // Sort by the width of the chart in bars
   SORT_BY_CHART_WIDTH_IN_PIXELS,                     // Sort by the width of the chart in pixels
   SORT_BY_CHART_HEIGHT_IN_PIXELS,                    // Sort by the height of the chart in pixels
   SORT_BY_CHART_COLOR_BACKGROUND,                    // Sort by the color of the chart background
   SORT_BY_CHART_COLOR_FOREGROUND,                    // Sort by color of axes, scale and OHLC line
   SORT_BY_CHART_COLOR_GRID,                          // Sort by grid color
   SORT_BY_CHART_COLOR_VOLUME,                        // Sort by the color of volumes and position opening levels
   SORT_BY_CHART_COLOR_CHART_UP,                      // Sort by the color for the up bar, shadows and body borders of bull candlesticks
   SORT_BY_CHART_COLOR_CHART_DOWN,                    // Sort by the color of down bar, its shadow and border of body of the bullish candlestick
   SORT_BY_CHART_COLOR_CHART_LINE,                    // Sort by the color of the chart line and the Doji candlesticks
   SORT_BY_CHART_COLOR_CANDLE_BULL,                   // Sort by the color of a bullish candlestick body
   SORT_BY_CHART_COLOR_CANDLE_BEAR,                   // Sort by the color of a bearish candlestick body
   SORT_BY_CHART_COLOR_BID,                           // Sort by the color of the Bid price line
   SORT_BY_CHART_COLOR_ASK,                           // Sort by the color of the Ask price line
   SORT_BY_CHART_COLOR_LAST,                          // Sort by the color of the last performed deal's price line (Last)
   SORT_BY_CHART_COLOR_STOP_LEVEL,                    // Sort by the color of stop order levels (Stop Loss and Take Profit)
   SORT_BY_CHART_SHOW_TRADE_LEVELS,                   // Sort by the flag of displaying trading levels on the chart
   SORT_BY_CHART_DRAG_TRADE_LEVELS,                   // Sort by the flag enabling the ability to drag trading levels on a chart using mouse
   SORT_BY_CHART_SHOW_DATE_SCALE,                     // Sort by the flag of displaying the time scale on the chart
   SORT_BY_CHART_SHOW_PRICE_SCALE,                    // Sort by the flag of displaying the price scale on the chart
   SORT_BY_CHART_SHOW_ONE_CLICK,                      // Sort by the flag of displaying the quick trading panel on the chart
   SORT_BY_CHART_IS_MAXIMIZED,                        // Sort by the "Chart window maximized" flag
   SORT_BY_CHART_IS_MINIMIZED,                        // Sort by the "Chart window minimized" flag
   SORT_BY_CHART_IS_DOCKED,                           // Sort by the "Chart window docked" flag
   SORT_BY_CHART_FLOAT_LEFT,                          // Sort by the left coordinate of the undocked chart window relative to the virtual screen
   SORT_BY_CHART_FLOAT_TOP,                           // Sort by the upper coordinate of the undocked chart window relative to the virtual screen
   SORT_BY_CHART_FLOAT_RIGHT,                         // Sort by the right coordinate of the undocked chart window relative to the virtual screen
   SORT_BY_CHART_FLOAT_BOTTOM,                        // Sort by the bottom coordinate of the undocked chart window relative to the virtual screen
//--- Sort by real properties
   SORT_BY_CHART_SHIFT_SIZE = FIRST_CHART_DBL_PROP,   // Sort by the shift size of the zero bar from the right border in %
   SORT_BY_CHART_FIXED_POSITION,                      // Sort by the chart fixed position from the left border in %
   SORT_BY_CHART_FIXED_MAX,                           // Sort by the fixed chart maximum
   SORT_BY_CHART_FIXED_MIN,                           // Sort by the fixed chart minimum
   SORT_BY_CHART_POINTS_PER_BAR,                      // Sort by the scale value in points per bar
   SORT_BY_CHART_PRICE_MIN,                           // Sort by the chart minimum
   SORT_BY_CHART_PRICE_MAX,                           // Sort by the chart maximum
//--- Sort by string properties
   SORT_BY_CHART_COMMENT = FIRST_CHART_STR_PROP,      // Sort by a comment text on the chart
   SORT_BY_CHART_EXPERT_NAME,                         // Sort by a name of an EA launched on the chart
   SORT_BY_CHART_SCRIPT_NAME,                         // Sort by a name of a script launched on the chart
  };
//+------------------------------------------------------------------+
Podrá obtener más información sobre la estructura de los objetos de la biblioteca en el primer artículo y varios de los siguientes.
Ahora, ya estamos listos para crear la clase de objeto de gráfico propiamente dicha.
Clase de objeto de gráfico
En el directorio de la biblioteca, en la nueva carpeta \MQL5\Include\DoEasy\Objects\Chart\, creamos el nuevo archivo ChartObj.mqh de la clase CChartObj.
El objeto básico debe ser el objeto básico de todos los objetos de la biblioteca, y su archivo deberá estar vinculado al archivo de clase:
//+------------------------------------------------------------------+
//|                                                     ChartObj.mqh |
//|                                  Copyright 2021, MetaQuotes Ltd. |
//|                             https://mql5.com/en/users/artmedia70 |
//+------------------------------------------------------------------+
#property copyright "Copyright 2021, MetaQuotes Ltd."
#property link      "https://mql5.com/en/users/artmedia70"
#property version   "1.00"
#property strict    // Necessary for mql4
//+------------------------------------------------------------------+
//| Include files                                                    |
//+------------------------------------------------------------------+
#include "..\..\Objects\BaseObj.mqh"
//+------------------------------------------------------------------+
//| Chart object class                                               |
//+------------------------------------------------------------------+
class CChartObj : public CBaseObj
  {
  }
En la sección privada de la clase, escribiremos las matrices estándar para almacenar las propiedades de la biblioteca, los métodos que retornan el índice real de una propiedad en la matriz y una variable de miembro de clase para almacenar el valor digits() del símbolo.
//+------------------------------------------------------------------+
//| Chart object class                                               |
//+------------------------------------------------------------------+
class CChartObj : public CBaseObj
  {
private:
   long              m_long_prop[CHART_PROP_INTEGER_TOTAL];       // Integer properties
   double            m_double_prop[CHART_PROP_DOUBLE_TOTAL];      // Real properties
   string            m_string_prop[CHART_PROP_STRING_TOTAL];      // String properties
   int               m_digits;                                    // Symbol's Digits()

//--- Return the index of the array the (1) double and (2) string properties are actually located at
   int               IndexProp(ENUM_CHART_PROP_DOUBLE property)   const { return(int)property-CHART_PROP_INTEGER_TOTAL;                         }
   int               IndexProp(ENUM_CHART_PROP_STRING property)   const { return(int)property-CHART_PROP_INTEGER_TOTAL-CHART_PROP_DOUBLE_TOTAL; }
En la sección pública de la clase, también escribiremos todos los métodos estándar para los objetos de la biblioteca: los métodos de establecimiento y retorno de las propiedades del objeto, los métodos virtuales que retornan las banderas de soporte de esta o aquella propiedad por parte del objeto (aunque nosotros no vayamos a crear objetos herederos, los métodos deberán ser virtuales para que resulte posible modificarlos en las clases herederas, en caso de que sea necesario), los métodos que retornan las descripciones de las propiedades, los métodos para mostrar en el diario de registro y escribir las propiedades y nombres del objeto, los métodos de comparación y los constructores.
public:
//--- Set object's (1) integer, (2) real and (3) string properties
   void              SetProperty(ENUM_CHART_PROP_INTEGER property,long value)    { this.m_long_prop[property]=value;                      }
   void              SetProperty(ENUM_CHART_PROP_DOUBLE property,double value)   { this.m_double_prop[this.IndexProp(property)]=value;    }
   void              SetProperty(ENUM_CHART_PROP_STRING property,string value)   { this.m_string_prop[this.IndexProp(property)]=value;    }
//--- Return object’s (1) integer, (2) real and (3) string property from the properties array
   long              GetProperty(ENUM_CHART_PROP_INTEGER property)         const { return this.m_long_prop[property];                     }
   double            GetProperty(ENUM_CHART_PROP_DOUBLE property)          const { return this.m_double_prop[this.IndexProp(property)];   }
   string            GetProperty(ENUM_CHART_PROP_STRING property)          const { return this.m_string_prop[this.IndexProp(property)];   }
//--- Return itself
   CChartObj        *GetObject(void)                                             { return &this;}

//--- Return the flag of the object supporting this property
   virtual bool      SupportProperty(ENUM_CHART_PROP_INTEGER property)           { return true; }
   virtual bool      SupportProperty(ENUM_CHART_PROP_DOUBLE property)            { return true; }
   virtual bool      SupportProperty(ENUM_CHART_PROP_STRING property)            { return true; }

//--- Get description of (1) integer, (2) real and (3) string properties
   string            GetPropertyDescription(ENUM_CHART_PROP_INTEGER property);
   string            GetPropertyDescription(ENUM_CHART_PROP_DOUBLE property);
   string            GetPropertyDescription(ENUM_CHART_PROP_STRING property);

//--- Display the description of object properties in the journal (full_prop=true - all properties, false - supported ones only)
   void              Print(const bool full_prop=false);
//--- Display a short description of the object in the journal
   virtual void      PrintShort(const bool dash=false);
//--- Return the object short name
   virtual string    Header(void);

//--- Compare CChartObj objects by a specified property (to sort the list by a specified chart object property)
   virtual int       Compare(const CObject *node,const int mode=0) const;
//--- Compare CChartObj objects by all properties (to search for equal chart objects)
   bool              IsEqual(CChartObj* compared_obj) const;

//--- Constructors
                     CChartObj(){;}
                     CChartObj(const long chart_id);
Este es el conjunto estándar de métodos de los objetos de la biblioteca, cuyo propósito ya hemos analizado y descrito repetidas veces. No nos detendremos en ellos.
Como al crear el objeto de gráfico, se presupone que el gráfico que le corresponde ha sido elegido, y podemos obtener sus propiedades usando las funciones ChartGetInteger(), ChartGetDouble() y ChartGetString(), entonces, en el constructor de la clase simplemente rellenaremos todas las propiedades del objeto de gráfico con los valores retornados por las funciones que se corresponden con las propiedades y, finalmente, insertaremos el valor Digits() del símbolo en la variable pensada para su almacenamiento:
//+------------------------------------------------------------------+
//| Parametric constructor                                           |
//+------------------------------------------------------------------+
CChartObj::CChartObj(const long chart_id)
  {
//--- Set integer properties
   this.SetProperty(CHART_PROP_ID,chart_id);                                                             // Chart ID
   this.SetProperty(CHART_PROP_TIMEFRAME,::ChartPeriod(this.ID()));                                      // Chart timeframe
   this.SetProperty(CHART_PROP_SHOW,::ChartGetInteger(this.ID(),CHART_SHOW));                            // Price chart drawing attribute
   this.SetProperty(CHART_PROP_IS_OBJECT,::ChartGetInteger(this.ID(),CHART_IS_OBJECT));                  // Chart object identification attribute
   this.SetProperty(CHART_PROP_BRING_TO_TOP,false);                                                      // Show chart above all others
   this.SetProperty(CHART_PROP_CONTEXT_MENU,::ChartGetInteger(this.ID(),CHART_CONTEXT_MENU));            // Access to the context menu using the right click
   this.SetProperty(CHART_PROP_CROSSHAIR_TOOL,::ChartGetInteger(this.ID(),CHART_CROSSHAIR_TOOL));        // Access the Crosshair tool by pressing the middle mouse button
   this.SetProperty(CHART_PROP_MOUSE_SCROLL,::ChartGetInteger(this.ID(),CHART_MOUSE_SCROLL));            // Scroll the chart horizontally using the left mouse button
   this.SetProperty(CHART_PROP_EVENT_MOUSE_WHEEL,::ChartGetInteger(this.ID(),CHART_EVENT_MOUSE_WHEEL));  // Send messages about mouse wheel events to all MQL5 programs on a chart
   this.SetProperty(CHART_PROP_EVENT_MOUSE_MOVE,::ChartGetInteger(this.ID(),CHART_EVENT_MOUSE_MOVE));    // Send messages about mouse button click and movement events to all MQL5 programs on a chart
   this.SetProperty(CHART_PROP_EVENT_OBJECT_CREATE,::ChartGetInteger(this.ID(),CHART_EVENT_OBJECT_CREATE)); // Send messages about the graphical object creation event to all MQL5 programs on a chart
   this.SetProperty(CHART_PROP_EVENT_OBJECT_DELETE,::ChartGetInteger(this.ID(),CHART_EVENT_OBJECT_DELETE)); // Send messages about the graphical object destruction event to all MQL5 programs on a chart
   this.SetProperty(CHART_PROP_MODE,::ChartGetInteger(this.ID(),CHART_MODE));                            // Type of the chart (candlesticks, bars or line)
   this.SetProperty(CHART_PROP_FOREGROUND,::ChartGetInteger(this.ID(),CHART_FOREGROUND));                // Price chart in the foreground
   this.SetProperty(CHART_PROP_SHIFT,::ChartGetInteger(this.ID(),CHART_SHIFT));                          // Mode of shift of the price chart from the right border
   this.SetProperty(CHART_PROP_AUTOSCROLL,::ChartGetInteger(this.ID(),CHART_AUTOSCROLL));                // The mode of automatic shift to the right border of the chart
   this.SetProperty(CHART_PROP_KEYBOARD_CONTROL,::ChartGetInteger(this.ID(),CHART_KEYBOARD_CONTROL));    // Allow managing the chart using a keyboard
   this.SetProperty(CHART_PROP_QUICK_NAVIGATION,::ChartGetInteger(this.ID(),CHART_QUICK_NAVIGATION));    // Allow the chart to intercept Space and Enter key strokes to activate the quick navigation bar
   this.SetProperty(CHART_PROP_SCALE,::ChartGetInteger(this.ID(),CHART_SCALE));                          // Scale
   this.SetProperty(CHART_PROP_SCALEFIX,::ChartGetInteger(this.ID(),CHART_SCALEFIX));                    // Fixed scale mode
   this.SetProperty(CHART_PROP_SCALEFIX_11,::ChartGetInteger(this.ID(),CHART_SCALEFIX_11));              // 1:1 scale mode
   this.SetProperty(CHART_PROP_SCALE_PT_PER_BAR,::ChartGetInteger(this.ID(),CHART_SCALE_PT_PER_BAR));    // Mode for specifying the scale in points per bar
   this.SetProperty(CHART_PROP_SHOW_TICKER,::ChartGetInteger(this.ID(),CHART_SHOW_TICKER));              // Display a symbol ticker in the upper left corner
   this.SetProperty(CHART_PROP_SHOW_OHLC,::ChartGetInteger(this.ID(),CHART_SHOW_OHLC));                  // Display OHLC values in the upper left corner
   this.SetProperty(CHART_PROP_SHOW_BID_LINE,::ChartGetInteger(this.ID(),CHART_SHOW_BID_LINE));          // Display Bid value as a horizontal line on the chart
   this.SetProperty(CHART_PROP_SHOW_ASK_LINE,::ChartGetInteger(this.ID(),CHART_SHOW_ASK_LINE));          // Display Ask value as a horizontal line on the chart
   this.SetProperty(CHART_PROP_SHOW_LAST_LINE,::ChartGetInteger(this.ID(),CHART_SHOW_LAST_LINE));        // Display Last value as a horizontal line on the chart
   this.SetProperty(CHART_PROP_SHOW_PERIOD_SEP,::ChartGetInteger(this.ID(),CHART_SHOW_PERIOD_SEP));      // Display vertical separators between adjacent periods
   this.SetProperty(CHART_PROP_SHOW_GRID,::ChartGetInteger(this.ID(),CHART_SHOW_GRID));                  // Display the chart grid
   this.SetProperty(CHART_PROP_SHOW_VOLUMES,::ChartGetInteger(this.ID(),CHART_SHOW_VOLUMES));            // Display volumes on the chart
   this.SetProperty(CHART_PROP_SHOW_OBJECT_DESCR,::ChartGetInteger(this.ID(),CHART_SHOW_OBJECT_DESCR));  // Display text descriptions of the objects
   this.SetProperty(CHART_PROP_VISIBLE_BARS,::ChartGetInteger(this.ID(),CHART_VISIBLE_BARS));            // Number of bars on a chart that are available for display
   this.SetProperty(CHART_PROP_WINDOWS_TOTAL,::ChartGetInteger(this.ID(),CHART_WINDOWS_TOTAL));          // The total number of chart windows including indicator subwindows
   this.SetProperty(CHART_PROP_WINDOW_HANDLE,::ChartGetInteger(this.ID(),CHART_WINDOW_HANDLE));          // Chart window handle
   this.SetProperty(CHART_PROP_FIRST_VISIBLE_BAR,::ChartGetInteger(this.ID(),CHART_FIRST_VISIBLE_BAR));  // Number of the first visible bar on the chart
   this.SetProperty(CHART_PROP_WIDTH_IN_BARS,::ChartGetInteger(this.ID(),CHART_WIDTH_IN_BARS));          // Chart width in bars
   this.SetProperty(CHART_PROP_WIDTH_IN_PIXELS,::ChartGetInteger(this.ID(),CHART_WIDTH_IN_PIXELS));      // Chart width in pixels
   this.SetProperty(CHART_PROP_COLOR_BACKGROUND,::ChartGetInteger(this.ID(),CHART_COLOR_BACKGROUND));    // Chart background color
   this.SetProperty(CHART_PROP_COLOR_FOREGROUND,::ChartGetInteger(this.ID(),CHART_COLOR_FOREGROUND));    // Color of axes, scale and OHLC line
   this.SetProperty(CHART_PROP_COLOR_GRID,::ChartGetInteger(this.ID(),CHART_COLOR_GRID));                // Grid color
   this.SetProperty(CHART_PROP_COLOR_VOLUME,::ChartGetInteger(this.ID(),CHART_COLOR_VOLUME));            // Color of volumes and position opening levels
   this.SetProperty(CHART_PROP_COLOR_CHART_UP,::ChartGetInteger(this.ID(),CHART_COLOR_CHART_UP));        // Color for the up bar, shadows and body borders of bullish candlesticks
   this.SetProperty(CHART_PROP_COLOR_CHART_DOWN,::ChartGetInteger(this.ID(),CHART_COLOR_CHART_DOWN));    // Color for the down bar, shadows and body borders of bearish candlesticks
   this.SetProperty(CHART_PROP_COLOR_CHART_LINE,::ChartGetInteger(this.ID(),CHART_COLOR_CHART_LINE));    // Color of the chart line and the Doji candlesticks
   this.SetProperty(CHART_PROP_COLOR_CANDLE_BULL,::ChartGetInteger(this.ID(),CHART_COLOR_CANDLE_BULL));  // Color of the bullish candle body
   this.SetProperty(CHART_PROP_COLOR_CANDLE_BEAR,::ChartGetInteger(this.ID(),CHART_COLOR_CANDLE_BEAR));  // Color of the bearish candle body
   this.SetProperty(CHART_PROP_COLOR_BID,::ChartGetInteger(this.ID(),CHART_COLOR_BID));                  // Bid price line color
   this.SetProperty(CHART_PROP_COLOR_ASK,::ChartGetInteger(this.ID(),CHART_COLOR_ASK));                  // Ask price line color
   this.SetProperty(CHART_PROP_COLOR_LAST,::ChartGetInteger(this.ID(),CHART_COLOR_LAST));                // Color of the last performed deal's price line (Last)
   this.SetProperty(CHART_PROP_COLOR_STOP_LEVEL,::ChartGetInteger(this.ID(),CHART_COLOR_STOP_LEVEL));    // Color of stop order levels (Stop Loss and Take Profit)
   this.SetProperty(CHART_PROP_SHOW_TRADE_LEVELS,::ChartGetInteger(this.ID(),CHART_SHOW_TRADE_LEVELS));  // Display trade levels on the chart (levels of open positions, Stop Loss, Take Profit and pending orders)
   this.SetProperty(CHART_PROP_DRAG_TRADE_LEVELS,::ChartGetInteger(this.ID(),CHART_DRAG_TRADE_LEVELS));  // Enable the ability to drag trading levels on a chart using mouse
   this.SetProperty(CHART_PROP_SHOW_DATE_SCALE,::ChartGetInteger(this.ID(),CHART_SHOW_DATE_SCALE));      // Display the time scale on the chart
   this.SetProperty(CHART_PROP_SHOW_PRICE_SCALE,::ChartGetInteger(this.ID(),CHART_SHOW_PRICE_SCALE));    // Display the price scale on the chart
   this.SetProperty(CHART_PROP_SHOW_ONE_CLICK,::ChartGetInteger(this.ID(),CHART_SHOW_ONE_CLICK));        // Display the quick trading panel on the chart
   this.SetProperty(CHART_PROP_IS_MAXIMIZED,::ChartGetInteger(this.ID(),CHART_IS_MAXIMIZED));            // Chart window maximized
   this.SetProperty(CHART_PROP_IS_MINIMIZED,::ChartGetInteger(this.ID(),CHART_IS_MINIMIZED));            // Chart window minimized
   this.SetProperty(CHART_PROP_IS_DOCKED,::ChartGetInteger(this.ID(),CHART_IS_DOCKED));                  // Chart window docked
   this.SetProperty(CHART_PROP_FLOAT_LEFT,::ChartGetInteger(this.ID(),CHART_FLOAT_LEFT));                // Left coordinate of the undocked chart window relative to the virtual screen
   this.SetProperty(CHART_PROP_FLOAT_TOP,::ChartGetInteger(this.ID(),CHART_FLOAT_TOP));                  // Upper coordinate of the undocked chart window relative to the virtual screen
   this.SetProperty(CHART_PROP_FLOAT_RIGHT,::ChartGetInteger(this.ID(),CHART_FLOAT_RIGHT));              // Right coordinate of the undocked chart window relative to the virtual screen
   this.SetProperty(CHART_PROP_FLOAT_BOTTOM,::ChartGetInteger(this.ID(),CHART_FLOAT_BOTTOM));            // Bottom coordinate of the undocked chart window relative to the virtual screen
//--- Set real properties
   this.SetProperty(CHART_PROP_SHIFT_SIZE,::ChartGetDouble(this.ID(),CHART_SHIFT_SIZE));                 // Shift size of the zero bar from the right border in %
   this.SetProperty(CHART_PROP_FIXED_POSITION,::ChartGetDouble(this.ID(),CHART_FIXED_POSITION));         // Chart fixed position from the left border in %
   this.SetProperty(CHART_PROP_FIXED_MAX,::ChartGetDouble(this.ID(),CHART_FIXED_MAX));                   // Fixed chart maximum
   this.SetProperty(CHART_PROP_FIXED_MIN,::ChartGetDouble(this.ID(),CHART_FIXED_MIN));                   // Fixed chart minimum
   this.SetProperty(CHART_PROP_POINTS_PER_BAR,::ChartGetDouble(this.ID(),CHART_POINTS_PER_BAR));         // Scale in points per bar
   this.SetProperty(CHART_PROP_PRICE_MIN,::ChartGetDouble(this.ID(),CHART_PRICE_MIN));                   // Chart minimum
   this.SetProperty(CHART_PROP_PRICE_MAX,::ChartGetDouble(this.ID(),CHART_PRICE_MAX));                   // Chart maximum
//--- Set string properties
   this.SetProperty(CHART_PROP_COMMENT,::ChartGetString(this.ID(),CHART_COMMENT));                       // Comment text on the chart
   this.SetProperty(CHART_PROP_EXPERT_NAME,::ChartGetString(this.ID(),CHART_EXPERT_NAME));               // name of an EA launched on the chart
   this.SetProperty(CHART_PROP_SCRIPT_NAME,::ChartGetString(this.ID(),CHART_SCRIPT_NAME));               // name of a script launched on the chart
   this.SetProperty(CHART_PROP_SYMBOL,::ChartSymbol(this.ID()));                                         // Chart symbol

   this.m_digits=(int)::SymbolInfoInteger(this.Symbol(),SYMBOL_DIGITS);
  }
//+------------------------------------------------------------------+
Digits() del símbolo se usa para mostrar correctamente algunos valores de las propiedades del gráfico.
Método que compara los objetos CChartObj entre sí según la propiedad indicada:
//+------------------------------------------------------------------+
//| Compare the CChartObj objects by a specified property            |
//+------------------------------------------------------------------+
int CChartObj::Compare(const CObject *node,const int mode=0) const
  {
   const CChartObj *obj_compared=node;
//--- compare integer properties of two objects
   if(mode<CHART_PROP_INTEGER_TOTAL)
     {
      long value_compared=obj_compared.GetProperty((ENUM_CHART_PROP_INTEGER)mode);
      long value_current=this.GetProperty((ENUM_CHART_PROP_INTEGER)mode);
      return(value_current>value_compared ? 1 : value_current<value_compared ? -1 : 0);
     }
//--- compare real properties of two objects
   else if(mode<CHART_PROP_DOUBLE_TOTAL+CHART_PROP_INTEGER_TOTAL)
     {
      double value_compared=obj_compared.GetProperty((ENUM_CHART_PROP_DOUBLE)mode);
      double value_current=this.GetProperty((ENUM_CHART_PROP_DOUBLE)mode);
      return(value_current>value_compared ? 1 : value_current<value_compared ? -1 : 0);
     }
//--- compare string properties of two objects
   else if(mode<CHART_PROP_DOUBLE_TOTAL+CHART_PROP_INTEGER_TOTAL+CHART_PROP_STRING_TOTAL)
     {
      string value_compared=obj_compared.GetProperty((ENUM_CHART_PROP_STRING)mode);
      string value_current=this.GetProperty((ENUM_CHART_PROP_STRING)mode);
      return(value_current>value_compared ? 1 : value_current<value_compared ? -1 : 0);
     }
   return 0;
  }
//+------------------------------------------------------------------+
La propiedad transmitida se comprueba para verificar su pertenencia a las propiedades enteras, reales o string, y en el bloque de código correspondiente, la propiedad del objeto actual es comparada con la propiedad transmitida al método para su comparación. Se retorna el resultado de la comparación: mayor que (1), menor que (-1) o igual a (0).
Método que compara los objetos CChartObj entre sí según todas las propiedades:
//+------------------------------------------------------------------+
//| Compare the CChartObj objects by all properties                  |
//+------------------------------------------------------------------+
bool CChartObj::IsEqual(CChartObj *compared_obj) const
  {
   int beg=0, end=CHART_PROP_INTEGER_TOTAL;
   for(int i=beg; i<end; i++)
     {
      ENUM_CHART_PROP_INTEGER prop=(ENUM_CHART_PROP_INTEGER)i;
      if(this.GetProperty(prop)!=compared_obj.GetProperty(prop)) return false;
     }
   beg=end; end+=CHART_PROP_DOUBLE_TOTAL;
   for(int i=beg; i<end; i++)
     {
      ENUM_CHART_PROP_DOUBLE prop=(ENUM_CHART_PROP_DOUBLE)i;
      if(this.GetProperty(prop)!=compared_obj.GetProperty(prop)) return false;
     }
   beg=end; end+=CHART_PROP_STRING_TOTAL;
   for(int i=beg; i<end; i++)
     {
      ENUM_CHART_PROP_STRING prop=(ENUM_CHART_PROP_STRING)i;
      if(this.GetProperty(prop)!=compared_obj.GetProperty(prop)) return false;
     }
   return true;
  }
//+------------------------------------------------------------------+
En tres ciclos por todas las propiedades del objeto, comparamos todas las propiedades sucesivas posteriores de los dos objetos: el actual y el transmitido al método. Si aunque sea una de las propiedades de los dos objetos comparados no resulta igual entre los dos, inmediatamente retornaremos false: los objetos no son idénticos. Tras completar todos los ciclos para todas las propiedades, retornamos true; no hay propiedades diferentes, lo cual significa que los objetos son idénticos entre sí.
Métodos que retornan las descripciones de las propiedades de tipo entero, real y string del objeto:
//+------------------------------------------------------------------+
//| Return description of object's integer property                  |
//+------------------------------------------------------------------+
string CChartObj::GetPropertyDescription(ENUM_CHART_PROP_INTEGER property)
  {
   return
     (
      property==CHART_PROP_ID     ?  CMessage::Text(MSG_CHART_OBJ_ID)+
         (!this.SupportProperty(property) ?  ": "+CMessage::Text(MSG_LIB_PROP_NOT_SUPPORTED) :
          ": "+(string)this.GetProperty(property)
         )  :
      property==CHART_PROP_TIMEFRAME      ?  CMessage::Text(MSG_LIB_TEXT_BAR_PERIOD)+
         (!this.SupportProperty(property) ?  ": "+CMessage::Text(MSG_LIB_PROP_NOT_SUPPORTED) :
          ": "+TimeframeDescription((ENUM_TIMEFRAMES)this.GetProperty(property))
         )  :
      property==CHART_PROP_SHOW   ?  CMessage::Text(MSG_CHART_OBJ_SHOW)+
         (!this.SupportProperty(property) ?  ": "+CMessage::Text(MSG_LIB_PROP_NOT_SUPPORTED) :
          ": "+(this.GetProperty(property) ? CMessage::Text(MSG_LIB_TEXT_YES) : CMessage::Text(MSG_LIB_TEXT_NO))
         )  :
      property==CHART_PROP_IS_OBJECT      ?  CMessage::Text(MSG_CHART_OBJ_IS_OBJECT)+
         (!this.SupportProperty(property) ?  ": "+CMessage::Text(MSG_LIB_PROP_NOT_SUPPORTED) :
          ": "+(this.GetProperty(property) ? CMessage::Text(MSG_LIB_TEXT_YES) : CMessage::Text(MSG_LIB_TEXT_NO))
         )  :
      property==CHART_PROP_BRING_TO_TOP   ?  CMessage::Text(MSG_CHART_OBJ_BRING_TO_TOP)+
         (!this.SupportProperty(property) ?  ": "+CMessage::Text(MSG_LIB_PROP_NOT_SUPPORTED) :
          ": "+(this.GetProperty(property) ? CMessage::Text(MSG_LIB_TEXT_YES) : CMessage::Text(MSG_LIB_TEXT_NO))
         )  :
      property==CHART_PROP_CONTEXT_MENU   ?  CMessage::Text(MSG_CHART_OBJ_CONTEXT_MENU)+
         (!this.SupportProperty(property) ?  ": "+CMessage::Text(MSG_LIB_PROP_NOT_SUPPORTED) :
          ": "+(this.GetProperty(property) ? CMessage::Text(MSG_LIB_TEXT_YES) : CMessage::Text(MSG_LIB_TEXT_NO))
         )  :
      property==CHART_PROP_CROSSHAIR_TOOL ?  CMessage::Text(MSG_CHART_OBJ_CROSSHAIR_TOOL)+
         (!this.SupportProperty(property) ?  ": "+CMessage::Text(MSG_LIB_PROP_NOT_SUPPORTED) :
          ": "+(this.GetProperty(property) ? CMessage::Text(MSG_LIB_TEXT_YES) : CMessage::Text(MSG_LIB_TEXT_NO))
         )  :
      property==CHART_PROP_MOUSE_SCROLL   ?  CMessage::Text(MSG_CHART_OBJ_MOUSE_SCROLL)+
         (!this.SupportProperty(property) ?  ": "+CMessage::Text(MSG_LIB_PROP_NOT_SUPPORTED) :
          ": "+(this.GetProperty(property) ? CMessage::Text(MSG_LIB_TEXT_YES) : CMessage::Text(MSG_LIB_TEXT_NO))
         )  :
      property==CHART_PROP_EVENT_MOUSE_WHEEL ?  CMessage::Text(MSG_CHART_OBJ_EVENT_MOUSE_WHEEL)+
         (!this.SupportProperty(property) ?  ": "+CMessage::Text(MSG_LIB_PROP_NOT_SUPPORTED) :
          ": "+(this.GetProperty(property) ? CMessage::Text(MSG_LIB_TEXT_YES) : CMessage::Text(MSG_LIB_TEXT_NO))
         )  :
      property==CHART_PROP_EVENT_MOUSE_MOVE  ?  CMessage::Text(MSG_CHART_OBJ_EVENT_MOUSE_MOVE)+
         (!this.SupportProperty(property) ?  ": "+CMessage::Text(MSG_LIB_PROP_NOT_SUPPORTED) :
          ": "+(this.GetProperty(property) ? CMessage::Text(MSG_LIB_TEXT_YES) : CMessage::Text(MSG_LIB_TEXT_NO))
         )  :
      property==CHART_PROP_EVENT_OBJECT_CREATE  ?  CMessage::Text(MSG_CHART_OBJ_EVENT_OBJECT_CREATE)+
         (!this.SupportProperty(property) ?  ": "+CMessage::Text(MSG_LIB_PROP_NOT_SUPPORTED) :
          ": "+(this.GetProperty(property) ? CMessage::Text(MSG_LIB_TEXT_YES) : CMessage::Text(MSG_LIB_TEXT_NO))
         )  :
      property==CHART_PROP_EVENT_OBJECT_DELETE  ?  CMessage::Text(MSG_CHART_OBJ_EVENT_OBJECT_DELETE)+
         (!this.SupportProperty(property) ?  ": "+CMessage::Text(MSG_LIB_PROP_NOT_SUPPORTED) :
          ": "+(this.GetProperty(property) ? CMessage::Text(MSG_LIB_TEXT_YES) : CMessage::Text(MSG_LIB_TEXT_NO))
         )  :
      property==CHART_PROP_MODE           ?  CMessage::Text(MSG_CHART_OBJ_MODE)+
         (!this.SupportProperty(property) ?  ": "+CMessage::Text(MSG_LIB_PROP_NOT_SUPPORTED) :
          ": "+ChartModeDescription((ENUM_CHART_MODE)this.GetProperty(property))
         )  :
      property==CHART_PROP_FOREGROUND     ?  CMessage::Text(MSG_CHART_OBJ_FOREGROUND)+
         (!this.SupportProperty(property) ?  ": "+CMessage::Text(MSG_LIB_PROP_NOT_SUPPORTED) :
          ": "+(this.GetProperty(property) ? CMessage::Text(MSG_LIB_TEXT_YES) : CMessage::Text(MSG_LIB_TEXT_NO))
         )  :
      property==CHART_PROP_SHIFT        ?  CMessage::Text(MSG_CHART_OBJ_SHIFT)+
         (!this.SupportProperty(property) ?  ": "+CMessage::Text(MSG_LIB_PROP_NOT_SUPPORTED) :
          ": "+(this.GetProperty(property) ? CMessage::Text(MSG_LIB_TEXT_YES) : CMessage::Text(MSG_LIB_TEXT_NO))
         )  :
      property==CHART_PROP_AUTOSCROLL        ?  CMessage::Text(MSG_CHART_OBJ_AUTOSCROLL)+
         (!this.SupportProperty(property) ?  ": "+CMessage::Text(MSG_LIB_PROP_NOT_SUPPORTED) :
          ": "+(this.GetProperty(property) ? CMessage::Text(MSG_LIB_TEXT_YES) : CMessage::Text(MSG_LIB_TEXT_NO))
         )  :
      property==CHART_PROP_KEYBOARD_CONTROL        ?  CMessage::Text(MSG_CHART_OBJ_KEYBOARD_CONTROL)+
         (!this.SupportProperty(property) ?  ": "+CMessage::Text(MSG_LIB_PROP_NOT_SUPPORTED) :
          ": "+(this.GetProperty(property) ? CMessage::Text(MSG_LIB_TEXT_YES) : CMessage::Text(MSG_LIB_TEXT_NO))
         )  :
      property==CHART_PROP_QUICK_NAVIGATION        ?  CMessage::Text(MSG_CHART_OBJ_QUICK_NAVIGATION)+
         (!this.SupportProperty(property) ?  ": "+CMessage::Text(MSG_LIB_PROP_NOT_SUPPORTED) :
          ": "+(this.GetProperty(property) ? CMessage::Text(MSG_LIB_TEXT_YES) : CMessage::Text(MSG_LIB_TEXT_NO))
         )  :
      property==CHART_PROP_SCALE        ?  CMessage::Text(MSG_CHART_OBJ_SCALE)+
         (!this.SupportProperty(property) ?  ": "+CMessage::Text(MSG_LIB_PROP_NOT_SUPPORTED) :
          ": "+(string)this.GetProperty(property)
         )  :
      property==CHART_PROP_SCALEFIX        ?  CMessage::Text(MSG_CHART_OBJ_SCALEFIX)+
         (!this.SupportProperty(property) ?  ": "+CMessage::Text(MSG_LIB_PROP_NOT_SUPPORTED) :
          ": "+(this.GetProperty(property) ? CMessage::Text(MSG_LIB_TEXT_YES) : CMessage::Text(MSG_LIB_TEXT_NO))
         )  :
      property==CHART_PROP_SCALEFIX_11        ?  CMessage::Text(MSG_CHART_OBJ_SCALEFIX_11)+
         (!this.SupportProperty(property) ?  ": "+CMessage::Text(MSG_LIB_PROP_NOT_SUPPORTED) :
          ": "+(this.GetProperty(property) ? CMessage::Text(MSG_LIB_TEXT_YES) : CMessage::Text(MSG_LIB_TEXT_NO))
         )  :
      property==CHART_PROP_SCALE_PT_PER_BAR  ?  CMessage::Text(MSG_CHART_OBJ_SCALE_PT_PER_BAR)+
         (!this.SupportProperty(property) ?  ": "+CMessage::Text(MSG_LIB_PROP_NOT_SUPPORTED) :
          ": "+(this.GetProperty(property) ? CMessage::Text(MSG_LIB_TEXT_YES) : CMessage::Text(MSG_LIB_TEXT_NO))
         )  :
      property==CHART_PROP_SHOW_TICKER        ?  CMessage::Text(MSG_CHART_OBJ_SHOW_TICKER)+
         (!this.SupportProperty(property) ?  ": "+CMessage::Text(MSG_LIB_PROP_NOT_SUPPORTED) :
          ": "+(this.GetProperty(property) ? CMessage::Text(MSG_LIB_TEXT_YES) : CMessage::Text(MSG_LIB_TEXT_NO))
         )  :
      property==CHART_PROP_SHOW_OHLC        ?  CMessage::Text(MSG_CHART_OBJ_SHOW_OHLC)+
         (!this.SupportProperty(property) ?  ": "+CMessage::Text(MSG_LIB_PROP_NOT_SUPPORTED) :
          ": "+(this.GetProperty(property) ? CMessage::Text(MSG_LIB_TEXT_YES) : CMessage::Text(MSG_LIB_TEXT_NO))
         )  :
      property==CHART_PROP_SHOW_BID_LINE  ?  CMessage::Text(MSG_CHART_OBJ_SHOW_BID_LINE)+
         (!this.SupportProperty(property) ?  ": "+CMessage::Text(MSG_LIB_PROP_NOT_SUPPORTED) :
          ": "+(this.GetProperty(property) ? CMessage::Text(MSG_LIB_TEXT_YES) : CMessage::Text(MSG_LIB_TEXT_NO))
         )  :
      property==CHART_PROP_SHOW_ASK_LINE  ?  CMessage::Text(MSG_CHART_OBJ_SHOW_ASK_LINE)+
         (!this.SupportProperty(property) ?  ": "+CMessage::Text(MSG_LIB_PROP_NOT_SUPPORTED) :
          ": "+(this.GetProperty(property) ? CMessage::Text(MSG_LIB_TEXT_YES) : CMessage::Text(MSG_LIB_TEXT_NO))
         )  :
      property==CHART_PROP_SHOW_LAST_LINE ?  CMessage::Text(MSG_CHART_OBJ_SHOW_LAST_LINE)+
         (!this.SupportProperty(property) ?  ": "+CMessage::Text(MSG_LIB_PROP_NOT_SUPPORTED) :
          ": "+(this.GetProperty(property) ? CMessage::Text(MSG_LIB_TEXT_YES) : CMessage::Text(MSG_LIB_TEXT_NO))
         )  :
      property==CHART_PROP_SHOW_PERIOD_SEP   ?  CMessage::Text(MSG_CHART_OBJ_SHOW_PERIOD_SEP)+
         (!this.SupportProperty(property) ?  ": "+CMessage::Text(MSG_LIB_PROP_NOT_SUPPORTED) :
          ": "+(this.GetProperty(property) ? CMessage::Text(MSG_LIB_TEXT_YES) : CMessage::Text(MSG_LIB_TEXT_NO))
         )  :
      property==CHART_PROP_SHOW_GRID        ?  CMessage::Text(MSG_CHART_OBJ_SHOW_GRID)+
         (!this.SupportProperty(property) ?  ": "+CMessage::Text(MSG_LIB_PROP_NOT_SUPPORTED) :
          ": "+(this.GetProperty(property) ? CMessage::Text(MSG_LIB_TEXT_YES) : CMessage::Text(MSG_LIB_TEXT_NO))
         )  :
      property==CHART_PROP_SHOW_VOLUMES   ?  CMessage::Text(MSG_CHART_OBJ_SHOW_VOLUMES)+
         (!this.SupportProperty(property) ?  ": "+CMessage::Text(MSG_LIB_PROP_NOT_SUPPORTED) :
          ": "+ChartModeVolumeDescription((ENUM_CHART_VOLUME_MODE)this.GetProperty(property))
         )  :
      property==CHART_PROP_SHOW_OBJECT_DESCR ?  CMessage::Text(MSG_CHART_OBJ_SHOW_OBJECT_DESCR)+
         (!this.SupportProperty(property) ?  ": "+CMessage::Text(MSG_LIB_PROP_NOT_SUPPORTED) :
          ": "+(this.GetProperty(property) ? CMessage::Text(MSG_LIB_TEXT_YES) : CMessage::Text(MSG_LIB_TEXT_NO))
         )  :
      property==CHART_PROP_VISIBLE_BARS   ?  CMessage::Text(MSG_CHART_OBJ_VISIBLE_BARS)+
         (!this.SupportProperty(property) ?  ": "+CMessage::Text(MSG_LIB_PROP_NOT_SUPPORTED) :
          ": "+(string)this.GetProperty(property)
         )  :
      property==CHART_PROP_WINDOWS_TOTAL  ?  CMessage::Text(MSG_CHART_OBJ_WINDOWS_TOTAL)+
         (!this.SupportProperty(property) ?  ": "+CMessage::Text(MSG_LIB_PROP_NOT_SUPPORTED) :
          ": "+(string)this.GetProperty(property)
         )  :
      property==CHART_PROP_WINDOW_HANDLE  ?  CMessage::Text(MSG_CHART_OBJ_WINDOW_HANDLE)+
         (!this.SupportProperty(property) ?  ": "+CMessage::Text(MSG_LIB_PROP_NOT_SUPPORTED) :
          ": "+(string)this.GetProperty(property)
         )  :
      property==CHART_PROP_FIRST_VISIBLE_BAR ?  CMessage::Text(MSG_CHART_OBJ_FIRST_VISIBLE_BAR)+
         (!this.SupportProperty(property) ?  ": "+CMessage::Text(MSG_LIB_PROP_NOT_SUPPORTED) :
          ": "+(string)this.GetProperty(property)
         )  :
      property==CHART_PROP_WIDTH_IN_BARS  ?  CMessage::Text(MSG_CHART_OBJ_WIDTH_IN_BARS)+
         (!this.SupportProperty(property) ?  ": "+CMessage::Text(MSG_LIB_PROP_NOT_SUPPORTED) :
          ": "+(string)this.GetProperty(property)
         )  :
      property==CHART_PROP_WIDTH_IN_PIXELS   ?  CMessage::Text(MSG_CHART_OBJ_WIDTH_IN_PIXELS)+
         (!this.SupportProperty(property) ?  ": "+CMessage::Text(MSG_LIB_PROP_NOT_SUPPORTED) :
          ": "+(string)this.GetProperty(property)
         )  :
      property==CHART_PROP_COLOR_BACKGROUND        ?  CMessage::Text(MSG_CHART_OBJ_COLOR_BACKGROUND)+
         (!this.SupportProperty(property) ?  ": "+CMessage::Text(MSG_LIB_PROP_NOT_SUPPORTED) :
          ": "+::ColorToString((color)this.GetProperty(property),true)
         )  :
      property==CHART_PROP_COLOR_FOREGROUND  ?  CMessage::Text(MSG_CHART_OBJ_COLOR_FOREGROUND)+
         (!this.SupportProperty(property) ?  ": "+CMessage::Text(MSG_LIB_PROP_NOT_SUPPORTED) :
          ": "+::ColorToString((color)this.GetProperty(property),true)
         )  :
      property==CHART_PROP_COLOR_GRID     ?  CMessage::Text(MSG_CHART_OBJ_COLOR_GRID)+
         (!this.SupportProperty(property) ?  ": "+CMessage::Text(MSG_LIB_PROP_NOT_SUPPORTED) :
          ": "+::ColorToString((color)this.GetProperty(property),true)
         )  :
      property==CHART_PROP_COLOR_VOLUME   ?  CMessage::Text(MSG_CHART_OBJ_COLOR_VOLUME)+
         (!this.SupportProperty(property) ?  ": "+CMessage::Text(MSG_LIB_PROP_NOT_SUPPORTED) :
          ": "+::ColorToString((color)this.GetProperty(property),true)
         )  :
      property==CHART_PROP_COLOR_CHART_UP ?  CMessage::Text(MSG_CHART_OBJ_COLOR_CHART_UP)+
         (!this.SupportProperty(property) ?  ": "+CMessage::Text(MSG_LIB_PROP_NOT_SUPPORTED) :
          ": "+::ColorToString((color)this.GetProperty(property),true)
         )  :
      property==CHART_PROP_COLOR_CHART_DOWN  ?  CMessage::Text(MSG_CHART_OBJ_COLOR_CHART_DOWN)+
         (!this.SupportProperty(property) ?  ": "+CMessage::Text(MSG_LIB_PROP_NOT_SUPPORTED) :
          ": "+::ColorToString((color)this.GetProperty(property),true)
         )  :
      property==CHART_PROP_COLOR_CHART_LINE  ?  CMessage::Text(MSG_CHART_OBJ_COLOR_CHART_LINE)+
         (!this.SupportProperty(property) ?  ": "+CMessage::Text(MSG_LIB_PROP_NOT_SUPPORTED) :
          ": "+::ColorToString((color)this.GetProperty(property),true)
         )  :
      property==CHART_PROP_COLOR_CANDLE_BULL ?  CMessage::Text(MSG_CHART_OBJ_COLOR_CANDLE_BULL)+
         (!this.SupportProperty(property) ?  ": "+CMessage::Text(MSG_LIB_PROP_NOT_SUPPORTED) :
          ": "+::ColorToString((color)this.GetProperty(property),true)
         )  :
      property==CHART_PROP_COLOR_CANDLE_BEAR ?  CMessage::Text(MSG_CHART_OBJ_COLOR_CANDLE_BEAR)+
         (!this.SupportProperty(property) ?  ": "+CMessage::Text(MSG_LIB_PROP_NOT_SUPPORTED) :
          ": "+::ColorToString((color)this.GetProperty(property),true)
         )  :
      property==CHART_PROP_COLOR_BID        ?  CMessage::Text(MSG_CHART_OBJ_COLOR_BID)+
         (!this.SupportProperty(property) ?  ": "+CMessage::Text(MSG_LIB_PROP_NOT_SUPPORTED) :
          ": "+::ColorToString((color)this.GetProperty(property),true)
         )  :
      property==CHART_PROP_COLOR_ASK        ?  CMessage::Text(MSG_CHART_OBJ_COLOR_ASK)+
         (!this.SupportProperty(property) ?  ": "+CMessage::Text(MSG_LIB_PROP_NOT_SUPPORTED) :
          ": "+::ColorToString((color)this.GetProperty(property),true)
         )  :
      property==CHART_PROP_COLOR_LAST        ?  CMessage::Text(MSG_CHART_OBJ_COLOR_LAST)+
         (!this.SupportProperty(property) ?  ": "+CMessage::Text(MSG_LIB_PROP_NOT_SUPPORTED) :
          ": "+::ColorToString((color)this.GetProperty(property),true)
         )  :
      property==CHART_PROP_COLOR_STOP_LEVEL  ?  CMessage::Text(MSG_CHART_OBJ_COLOR_STOP_LEVEL)+
         (!this.SupportProperty(property) ?  ": "+CMessage::Text(MSG_LIB_PROP_NOT_SUPPORTED) :
          ": "+::ColorToString((color)this.GetProperty(property),true)
         )  :
      property==CHART_PROP_SHOW_TRADE_LEVELS ?  CMessage::Text(MSG_CHART_OBJ_SHOW_TRADE_LEVELS)+
         (!this.SupportProperty(property) ?  ": "+CMessage::Text(MSG_LIB_PROP_NOT_SUPPORTED) :
          ": "+(this.GetProperty(property) ? CMessage::Text(MSG_LIB_TEXT_YES) : CMessage::Text(MSG_LIB_TEXT_NO))
         )  :
      property==CHART_PROP_DRAG_TRADE_LEVELS ?  CMessage::Text(MSG_CHART_OBJ_DRAG_TRADE_LEVELS)+
         (!this.SupportProperty(property) ?  ": "+CMessage::Text(MSG_LIB_PROP_NOT_SUPPORTED) :
          ": "+(this.GetProperty(property) ? CMessage::Text(MSG_LIB_TEXT_YES) : CMessage::Text(MSG_LIB_TEXT_NO))
         )  :
      property==CHART_PROP_SHOW_DATE_SCALE   ?  CMessage::Text(MSG_CHART_OBJ_SHOW_DATE_SCALE)+
         (!this.SupportProperty(property) ?  ": "+CMessage::Text(MSG_LIB_PROP_NOT_SUPPORTED) :
          ": "+(this.GetProperty(property) ? CMessage::Text(MSG_LIB_TEXT_YES) : CMessage::Text(MSG_LIB_TEXT_NO))
         )  :
      property==CHART_PROP_SHOW_PRICE_SCALE  ?  CMessage::Text(MSG_CHART_OBJ_SHOW_PRICE_SCALE)+
         (!this.SupportProperty(property) ?  ": "+CMessage::Text(MSG_LIB_PROP_NOT_SUPPORTED) :
          ": "+(this.GetProperty(property) ? CMessage::Text(MSG_LIB_TEXT_YES) : CMessage::Text(MSG_LIB_TEXT_NO))
         )  :
      property==CHART_PROP_SHOW_ONE_CLICK ?  CMessage::Text(MSG_CHART_OBJ_SHOW_ONE_CLICK)+
         (!this.SupportProperty(property) ?  ": "+CMessage::Text(MSG_LIB_PROP_NOT_SUPPORTED) :
          ": "+(this.GetProperty(property) ? CMessage::Text(MSG_LIB_TEXT_YES) : CMessage::Text(MSG_LIB_TEXT_NO))
         )  :
      property==CHART_PROP_IS_MAXIMIZED   ?  CMessage::Text(MSG_CHART_OBJ_IS_MAXIMIZED)+
         (!this.SupportProperty(property) ?  ": "+CMessage::Text(MSG_LIB_PROP_NOT_SUPPORTED) :
          ": "+(this.GetProperty(property) ? CMessage::Text(MSG_LIB_TEXT_YES) : CMessage::Text(MSG_LIB_TEXT_NO))
         )  :
      property==CHART_PROP_IS_MINIMIZED   ?  CMessage::Text(MSG_CHART_OBJ_IS_MINIMIZED)+
         (!this.SupportProperty(property) ?  ": "+CMessage::Text(MSG_LIB_PROP_NOT_SUPPORTED) :
          ": "+(this.GetProperty(property) ? CMessage::Text(MSG_LIB_TEXT_YES) : CMessage::Text(MSG_LIB_TEXT_NO))
         )  :
      property==CHART_PROP_IS_DOCKED      ?  CMessage::Text(MSG_CHART_OBJ_IS_DOCKED)+
         (!this.SupportProperty(property) ?  ": "+CMessage::Text(MSG_LIB_PROP_NOT_SUPPORTED) :
          ": "+(this.GetProperty(property) ? CMessage::Text(MSG_LIB_TEXT_YES) : CMessage::Text(MSG_LIB_TEXT_NO))
         )  :
      property==CHART_PROP_FLOAT_LEFT     ?  CMessage::Text(MSG_CHART_OBJ_FLOAT_LEFT)+
         (!this.SupportProperty(property) ?  ": "+CMessage::Text(MSG_LIB_PROP_NOT_SUPPORTED) :
          ": "+(string)this.GetProperty(property)
         )  :
      property==CHART_PROP_FLOAT_TOP      ?  CMessage::Text(MSG_CHART_OBJ_FLOAT_TOP)+
         (!this.SupportProperty(property) ?  ": "+CMessage::Text(MSG_LIB_PROP_NOT_SUPPORTED) :
          ": "+(string)this.GetProperty(property)
         )  :
      property==CHART_PROP_FLOAT_RIGHT    ?  CMessage::Text(MSG_CHART_OBJ_FLOAT_RIGHT)+
         (!this.SupportProperty(property) ?  ": "+CMessage::Text(MSG_LIB_PROP_NOT_SUPPORTED) :
          ": "+(string)this.GetProperty(property)
         )  :
      property==CHART_PROP_FLOAT_BOTTOM   ?  CMessage::Text(MSG_CHART_OBJ_FLOAT_BOTTOM)+
         (!this.SupportProperty(property) ?  ": "+CMessage::Text(MSG_LIB_PROP_NOT_SUPPORTED) :
          ": "+(string)this.GetProperty(property)
         )  :
      ""
     );
  }
//+------------------------------------------------------------------+
//| Return description of object's real property                     |
//+------------------------------------------------------------------+
string CChartObj::GetPropertyDescription(ENUM_CHART_PROP_DOUBLE property)
  {
   return
     (
      property==CHART_PROP_SHIFT_SIZE        ?  CMessage::Text(MSG_CHART_OBJ_SHIFT_SIZE)+
         (!this.SupportProperty(property)    ?  ": "+CMessage::Text(MSG_LIB_PROP_NOT_SUPPORTED) :
          ": "+::DoubleToString(this.GetProperty(property),2)
         )  :
      property==CHART_PROP_FIXED_POSITION    ?  CMessage::Text(MSG_CHART_OBJ_FIXED_POSITION)+
         (!this.SupportProperty(property)    ?  ": "+CMessage::Text(MSG_LIB_PROP_NOT_SUPPORTED) :
          ": "+::DoubleToString(this.GetProperty(property),2)
         )  :
      property==CHART_PROP_FIXED_MAX         ?  CMessage::Text(MSG_CHART_OBJ_FIXED_MAX)+
         (!this.SupportProperty(property)    ?  ": "+CMessage::Text(MSG_LIB_PROP_NOT_SUPPORTED) :
          ": "+::DoubleToString(this.GetProperty(property),this.m_digits)
         )  :
      property==CHART_PROP_FIXED_MIN         ?  CMessage::Text(MSG_CHART_OBJ_FIXED_MIN)+
         (!this.SupportProperty(property)    ?  ": "+CMessage::Text(MSG_LIB_PROP_NOT_SUPPORTED) :
          ": "+::DoubleToString(this.GetProperty(property),this.m_digits)
         )  :
      property==CHART_PROP_POINTS_PER_BAR    ?  CMessage::Text(MSG_CHART_OBJ_POINTS_PER_BAR)+
         (!this.SupportProperty(property)    ?  ": "+CMessage::Text(MSG_LIB_PROP_NOT_SUPPORTED) :
          ": "+::DoubleToString(this.GetProperty(property),2)
         )  :
      property==CHART_PROP_PRICE_MIN         ?  CMessage::Text(MSG_CHART_OBJ_PRICE_MIN)+
         (!this.SupportProperty(property)    ?  ": "+CMessage::Text(MSG_LIB_PROP_NOT_SUPPORTED) :
          ": "+::DoubleToString(this.GetProperty(property),this.m_digits)
         )  :
      property==CHART_PROP_PRICE_MAX         ?  CMessage::Text(MSG_CHART_OBJ_PRICE_MAX)+
         (!this.SupportProperty(property)    ?  ": "+CMessage::Text(MSG_LIB_PROP_NOT_SUPPORTED) :
          ": "+::DoubleToString(this.GetProperty(property),this.m_digits)
         )  :
      ""
     );
  }
//+------------------------------------------------------------------+
//| Return description of object's string property                   |
//+------------------------------------------------------------------+
string CChartObj::GetPropertyDescription(ENUM_CHART_PROP_STRING property)
  {
   return
     (
      property==CHART_PROP_COMMENT     ?  CMessage::Text(MSG_CHART_OBJ_COMMENT)+": \""+this.GetProperty(property)+"\""     :
      property==CHART_PROP_EXPERT_NAME ?  CMessage::Text(MSG_CHART_OBJ_EXPERT_NAME)+": \""+this.GetProperty(property)+"\"" :
      property==CHART_PROP_SCRIPT_NAME ?  CMessage::Text(MSG_CHART_OBJ_SCRIPT_NAME)+": \""+this.GetProperty(property)+"\"" :
      property==CHART_PROP_SYMBOL      ?  CMessage::Text(MSG_LIB_PROP_SYMBOL)+": \""+this.GetProperty(property)+"\""       :
      ""
     );
  }
//+------------------------------------------------------------------+
En los métodos, verificamos la propiedad transmitida y, según el valor de la propiedad, creamos y retornamos una línea con su descripción.
Método que muestra en el diario la descripción completa de las propiedades del objeto:
//+------------------------------------------------------------------+
//| Display object properties in the journal                         |
//+------------------------------------------------------------------+
void CChartObj::Print(const bool full_prop=false)
  {
   ::Print("============= ",CMessage::Text(MSG_LIB_PARAMS_LIST_BEG)," (",this.Header(),") =============");
   int beg=0, end=CHART_PROP_INTEGER_TOTAL;
   for(int i=beg; i<end; i++)
     {
      ENUM_CHART_PROP_INTEGER prop=(ENUM_CHART_PROP_INTEGER)i;
      if(!full_prop && !this.SupportProperty(prop)) continue;
      ::Print(this.GetPropertyDescription(prop));
     }
   ::Print("------");
   beg=end; end+=CHART_PROP_DOUBLE_TOTAL;
   for(int i=beg; i<end; i++)
     {
      ENUM_CHART_PROP_DOUBLE prop=(ENUM_CHART_PROP_DOUBLE)i;
      if(!full_prop && !this.SupportProperty(prop)) continue;
      ::Print(this.GetPropertyDescription(prop));
     }
   ::Print("------");
   beg=end; end+=CHART_PROP_STRING_TOTAL;
   for(int i=beg; i<end; i++)
     {
      ENUM_CHART_PROP_STRING prop=(ENUM_CHART_PROP_STRING)i;
      if(!full_prop && !this.SupportProperty(prop)) continue;
      ::Print(this.GetPropertyDescription(prop));
     }
   ::Print("============= ",CMessage::Text(MSG_LIB_PARAMS_LIST_END)," (",this.Header(),") =============\n");
  }
//+------------------------------------------------------------------+
En tres ciclos por todas las propiedades del objeto, obtenemos la descripción de cada propiedad subsiguiente y la imprimimos en el diario.
Método que muestra en el diario la descripción breve del objeto:
//+------------------------------------------------------------------+
//| Display a short description of the object in the journal         |
//+------------------------------------------------------------------+
void CChartObj::PrintShort(const bool dash=false)
  {
   ::Print((dash ? "- " : ""),this.Header()," ID: ",(string)this.ID(),", HWND: ",(string)this.Handle());
  }
//+------------------------------------------------------------------+
Transmitimos al método la bandera que indica que es necesario mostrar un guión antes de la descripción del objeto. Necesitaremos el guión en la clase de colección de objetos de gráfico para mostrar la descripción breve de toda la colección. Por defecto, no se pone guión. El método crea una línea con la descripción del objeto y algunas de sus propiedades adicionales: los identificadores del gráfico y el identificador de la ventana.
Método que retorna el nombre breve del objeto:
//+------------------------------------------------------------------+
//| Return the object short name                                     |
//+------------------------------------------------------------------+
string CChartObj::Header(void)
  {
   return(CMessage::Text(MSG_CHART_OBJ_CHART_WINDOW)+" "+this.Symbol()+" "+TimeframeDescription(this.Timeframe()));
  }
//+------------------------------------------------------------------+
El método crea y retorna una línea que consta del encabezado y los nombres del símbolo y el marco temporal del gráfico.
Todos estos métodos son estándar para los objetos de biblioteca y forman la base de cada objeto. Pero, para usar con mayor comodidad estos métodos, generalmente añadimos los métodos necesarios para acceder rápidamente a las propiedades del objeto. Y tendremos muchos de estos métodos, ya que existen muchas propiedades diferentes del objeto de gráfico.
Básicamente, sus propiedades son banderas que indican el estado de este o aquel parámetro del gráfico. Podemos activarlas y desactivarlas, es decir, solo tienen dos estados. Por lo tanto, necesitamos métodos para establecer indicadores de tales propiedades de objeto. Y estos serán métodos privados. Como métodos públicos, crearemos métodos para habilitar y deshabilitar la propiedad. Será más fácil de usar.
En la sección privada de la clase, declaramos los métodos para establecer las banderas de algunas propiedades del objeto, y en ese mismo lugar, declaramos los métodos para establecer las propiedades con un número límite de valores (3 y 6), así como los métodos para configurar solo las propiedades del objeto de gráfico (para los parámetros de gráfico read only), de forma que podamos introducir en la propiedad del objeto de gráfico el valor del parámetro correspondiente del gráfico:
//+------------------------------------------------------------------+
//|                                                     ChartObj.mqh |
//|                                  Copyright 2021, MetaQuotes Ltd. |
//|                             https://mql5.com/en/users/artmedia70 |
//+------------------------------------------------------------------+
#property copyright "Copyright 2021, MetaQuotes Ltd."
#property link      "https://mql5.com/en/users/artmedia70"
#property version   "1.00"
#property strict    // Necessary for mql4
//+------------------------------------------------------------------+
//| Include files                                                    |
//+------------------------------------------------------------------+
#include "..\..\Objects\BaseObj.mqh"
//+------------------------------------------------------------------+
//| Chart object class                                               |
//+------------------------------------------------------------------+
class CChartObj : public CBaseObj
  {
private:
   long              m_long_prop[CHART_PROP_INTEGER_TOTAL];       // Integer properties
   double            m_double_prop[CHART_PROP_DOUBLE_TOTAL];      // Real properties
   string            m_string_prop[CHART_PROP_STRING_TOTAL];      // String properties
   int               m_digits;                                    // Symbol's Digits()

//--- Return the index of the array the (1) double and (2) string properties are actually located at
   int               IndexProp(ENUM_CHART_PROP_DOUBLE property)   const { return(int)property-CHART_PROP_INTEGER_TOTAL;                         }
   int               IndexProp(ENUM_CHART_PROP_STRING property)   const { return(int)property-CHART_PROP_INTEGER_TOTAL-CHART_PROP_DOUBLE_TOTAL; }

//--- The methods of setting parameter flags
   bool              SetShowFlag(const string source,const bool flag,const bool redraw=false);
   bool              SetBringToTopFlag(const string source,const bool flag,const bool redraw=false);
   bool              SetContextMenuFlag(const string source,const bool flag,const bool redraw=false);
   bool              SetCrosshairToolFlag(const string source,const bool flag,const bool redraw=false);
   bool              SetMouseScrollFlag(const string source,const bool flag,const bool redraw=false);
   bool              SetEventMouseWhellFlag(const string source,const bool flag,const bool redraw=false);
   bool              SetEventMouseMoveFlag(const string source,const bool flag,const bool redraw=false);
   bool              SetEventObjectCreateFlag(const string source,const bool flag,const bool redraw=false);
   bool              SetEventObjectDeleteFlag(const string source,const bool flag,const bool redraw=false);
   bool              SetForegroundFlag(const string source,const bool flag,const bool redraw=false);
   bool              SetShiftFlag(const string source,const bool flag,const bool redraw=false);
   bool              SetAutoscrollFlag(const string source,const bool flag,const bool redraw=false);
   bool              SetKeyboardControlFlag(const string source,const bool flag,const bool redraw=false);
   bool              SetQuickNavigationFlag(const string source,const bool flag,const bool redraw=false);
   bool              SetScaleFixFlag(const string source,const bool flag,const bool redraw=false);
   bool              SetScaleFix11Flag(const string source,const bool flag,const bool redraw=false);
   bool              SetScalePTPerBarFlag(const string source,const bool flag,const bool redraw=false);
   bool              SetShowTickerFlag(const string source,const bool flag,const bool redraw=false);
   bool              SetShowOHLCFlag(const string source,const bool flag,const bool redraw=false);
   bool              SetShowBidLineFlag(const string source,const bool flag,const bool redraw=false);
   bool              SetShowAskLineFlag(const string source,const bool flag,const bool redraw=false);
   bool              SetShowLastLineFlag(const string source,const bool flag,const bool redraw=false);
   bool              SetShowPeriodSeparatorsFlag(const string source,const bool flag,const bool redraw=false);
   bool              SetShowGridFlag(const string source,const bool flag,const bool redraw=false);
   bool              SetShowObjectDescriptionsFlag(const string source,const bool flag,const bool redraw=false);
   bool              SetShowTradeLevelsFlag(const string source,const bool flag,const bool redraw=false);
   bool              SetDragTradeLevelsFlag(const string source,const bool flag,const bool redraw=false);
   bool              SetShowDateScaleFlag(const string source,const bool flag,const bool redraw=false);
   bool              SetShowPriceScaleFlag(const string source,const bool flag,const bool redraw=false);
   bool              SetShowOneClickPanelFlag(const string source,const bool flag,const bool redraw=false);
   bool              SetDockedFlag(const string source,const bool flag,const bool redraw=false);

//--- The methods of setting property values
   bool              SetMode(const string source,const ENUM_CHART_MODE mode,const bool redraw=false);
   bool              SetScale(const string source,const int scale,const bool redraw=false);
   bool              SetModeVolume(const string source,const ENUM_CHART_VOLUME_MODE mode,const bool redraw=false);
   void              SetVisibleBars(void);
   void              SetWindowsTotal(void);
   void              SetFirstVisibleBars(void);
   void              SetWidthInBars(void);
   void              SetWidthInPixels(void);
   void              SetMaximizedFlag(void);
   void              SetMinimizedFlag(void);
   void              SetExpertName(void);
   void              SetScriptName(void);

public:
Implementamos fuera del cuerpo de la clase los métodos privados declarados.
Los métodos para colocar las banderas son idénticos entre sí.
Por eso, vamos a analizar la lógica usando el ejemplo del método que establece la bandera de dibujado del gráfico de precios:
//+------------------------------------------------------------------+
//| Set the flag of drawing the price chart                          |
//+------------------------------------------------------------------+
bool CChartObj::SetShowFlag(const string source,const bool flag,const bool redraw=false)
  {
   ::ResetLastError();
   if(!::ChartSetInteger(this.ID(),CHART_SHOW,flag))
     {
      CMessage::ToLog(source,::GetLastError(),true);
      return false;
     }
   this.SetProperty(CHART_PROP_SHOW,flag);
   if(redraw)
      ::ChartRedraw(this.ID());
   return true;
  }
//+------------------------------------------------------------------+
Transmitimos al método la fuente (source), es decir, el nombre del método desde el que se ha llamado este método privado, así como el valor de la bandera (flag) que debemos establecer en los parámetros del gráfico y en la propiedad del objeto de gráfico, y la bandera que indica la necesidad de redibujar el gráfico (redraw).
Las funciones para trabajar con los gráficos ChartSet* son asíncronas, es decir, retorna solo el resultado de colocar el comando en la cola de eventos del gráfico, pero no el resultado de la modificación del parámetro en sí. Normalmente, el resultado de la función aparece después de un determinado evento en el gráfico: la modificación de su tamaño, la llegada de un nuevo tick, la actualización del gráfico, etc. etcétera. Para mostrar de inmediato el cambio en el parámetro, deberemos actualizar el gráfico a la fuerza; de ello se encarga la función ChartRedraw().
No obstante, hay un "PERO" aquí: normalmente son varios los valores que cambian en los parámetros del gráfico, es decir, su cambio se da por paquetes. En este caso, primero debemos enviar todos los eventos de cambio de todos los parámetros necesarios del gráfico, y solo luego llamar al redibujado forzoso del gráfico, de manera que después de cada comando de cambio de parámetros, el gráfico no se dibuje de nuevo. Precisamente de eso se encarga el indicador redraw, establecido en false por defecto.
Aquí: en primer lugar, enviamos un comando para cambiar el parámetro del gráfico y, si el evento no estaba en la cola, notificamos el error y retornamos false.
Si el evento se ha puesto en la cola con éxito, cambiaremos la propiedad del objeto de gráfico y, si la bandera de redibujado está activada, dibujaremos de nuevo el gráfico forzosamente. Retornamos true: el método ha funcionado correctamente.
La implementación de los otros métodos privados para establecer banderas es idéntica a la analizada; aquí tenemos su lista completa:
//+------------------------------------------------------------------+
//| Set the chart flag above all others                              |
//+------------------------------------------------------------------+
bool CChartObj::SetBringToTopFlag(const string source,const bool flag,const bool redraw=false)
  {
   ::ResetLastError();
   if(!::ChartSetInteger(this.ID(),CHART_BRING_TO_TOP,flag))
     {
      CMessage::ToLog(source,::GetLastError(),true);
      return false;
     }
   this.SetProperty(CHART_PROP_BRING_TO_TOP,flag);
   if(redraw)
      ::ChartRedraw(this.ID());
   return true;
  }
//+------------------------------------------------------------------+
//| Set the flag of accessing the context menu                       |
//| upon pressing the right mouse button                             |
//+------------------------------------------------------------------+
bool CChartObj::SetContextMenuFlag(const string source,const bool flag,const bool redraw=false)
  {
   ::ResetLastError();
   if(!::ChartSetInteger(this.ID(),CHART_CONTEXT_MENU,flag))
     {
      CMessage::ToLog(source,::GetLastError(),true);
      return false;
     }
   this.SetProperty(CHART_PROP_CONTEXT_MENU,flag);
   if(redraw)
      ::ChartRedraw(this.ID());
   return true;
  }
//+------------------------------------------------------------------+
//| Set the flag of accessing the Crosshair                          |
//| upon pressing the middle mouse button                            |
//+------------------------------------------------------------------+
bool CChartObj::SetCrosshairToolFlag(const string source,const bool flag,const bool redraw=false)
  {
   ::ResetLastError();
   if(!::ChartSetInteger(this.ID(),CHART_CROSSHAIR_TOOL,flag))
     {
      CMessage::ToLog(source,::GetLastError(),true);
      return false;
     }
   this.SetProperty(CHART_PROP_CROSSHAIR_TOOL,flag);
   if(redraw)
      ::ChartRedraw(this.ID());
   return true;
  }
//+------------------------------------------------------------------+
//| Set the chart scroll flag                                        |
//| horizontally using the left mouse button                         |
//+------------------------------------------------------------------+
bool CChartObj::SetMouseScrollFlag(const string source,const bool flag,const bool redraw=false)
  {
   ::ResetLastError();
   if(!::ChartSetInteger(this.ID(),CHART_MOUSE_SCROLL,flag))
     {
      CMessage::ToLog(source,::GetLastError(),true);
      return false;
     }
   this.SetProperty(CHART_PROP_MOUSE_SCROLL,flag);
   if(redraw)
      ::ChartRedraw(this.ID());
   return true;
  }
//+------------------------------------------------------------------+
//| Set the flag of sending mouse wheel event messages               |
//| to all MQL5 programs on the chart                                |
//+------------------------------------------------------------------+
bool CChartObj::SetEventMouseWhellFlag(const string source,const bool flag,const bool redraw=false)
  {
   ::ResetLastError();
   if(!::ChartSetInteger(this.ID(),CHART_EVENT_MOUSE_WHEEL,flag))
     {
      CMessage::ToLog(source,::GetLastError(),true);
      return false;
     }
   this.SetProperty(CHART_PROP_EVENT_MOUSE_WHEEL,flag);
   if(redraw)
      ::ChartRedraw(this.ID());
   return true;
  }
//+------------------------------------------------------------------+
//| Set the flag of sending mouse wheel event messages               |
//| to all MQL5 programs on the chart                                |
//+------------------------------------------------------------------+
bool CChartObj::SetEventMouseMoveFlag(const string source,const bool flag,const bool redraw=false)
  {
   ::ResetLastError();
   if(!::ChartSetInteger(this.ID(),CHART_EVENT_MOUSE_MOVE,flag))
     {
      CMessage::ToLog(source,::GetLastError(),true);
      return false;
     }
   this.SetProperty(CHART_PROP_EVENT_MOUSE_MOVE,flag);
   if(redraw)
      ::ChartRedraw(this.ID());
   return true;
  }
//+------------------------------------------------------------------+
//| Set the flag of sending mouse wheel event messages               |
//| to all MQL5 programs on the chart                                |
//+------------------------------------------------------------------+
bool CChartObj::SetEventObjectCreateFlag(const string source,const bool flag,const bool redraw=false)
  {
   ::ResetLastError();
   if(!::ChartSetInteger(this.ID(),CHART_EVENT_OBJECT_CREATE,flag))
     {
      CMessage::ToLog(source,::GetLastError(),true);
      return false;
     }
   this.SetProperty(CHART_PROP_EVENT_OBJECT_CREATE,flag);
   if(redraw)
      ::ChartRedraw(this.ID());
   return true;
  }
//+------------------------------------------------------------------+
//| Set the flag of sending mouse wheel event messages               |
//| to all MQL5 programs on the chart                                |
//+------------------------------------------------------------------+
bool CChartObj::SetEventObjectDeleteFlag(const string source,const bool flag,const bool redraw=false)
  {
   ::ResetLastError();
   if(!::ChartSetInteger(this.ID(),CHART_EVENT_OBJECT_DELETE,flag))
     {
      CMessage::ToLog(source,::GetLastError(),true);
      return false;
     }
   this.SetProperty(CHART_PROP_EVENT_OBJECT_DELETE,flag);
   if(redraw)
      ::ChartRedraw(this.ID());
   return true;
  }
//+------------------------------------------------------------------+
//| Set the price chart flag in the foreground                       |
//+------------------------------------------------------------------+
bool CChartObj::SetForegroundFlag(const string source,const bool flag,const bool redraw=false)
  {
   ::ResetLastError();
   if(!::ChartSetInteger(this.ID(),CHART_FOREGROUND,flag))
     {
      CMessage::ToLog(source,::GetLastError(),true);
      return false;
     }
   this.SetProperty(CHART_PROP_FOREGROUND,flag);
   if(redraw)
      ::ChartRedraw(this.ID());
   return true;
  }
//+------------------------------------------------------------------+
//| Set the flag of the price chart shift from the right border      |
//+------------------------------------------------------------------+
bool CChartObj::SetShiftFlag(const string source,const bool flag,const bool redraw=false)
  {
   ::ResetLastError();
   if(!::ChartSetInteger(this.ID(),CHART_SHIFT,flag))
     {
      CMessage::ToLog(source,::GetLastError(),true);
      return false;
     }
   this.SetProperty(CHART_PROP_SHIFT,flag);
   if(redraw)
      ::ChartRedraw(this.ID());
   return true;
  }
//+------------------------------------------------------------------+
//|Set the flag for automatically moving to the right chart border   |
//+------------------------------------------------------------------+
bool CChartObj::SetAutoscrollFlag(const string source,const bool flag,const bool redraw=false)
  {
   ::ResetLastError();
   if(!::ChartSetInteger(this.ID(),CHART_AUTOSCROLL,flag))
     {
      CMessage::ToLog(source,::GetLastError(),true);
      return false;
     }
   this.SetProperty(CHART_PROP_AUTOSCROLL,flag);
   if(redraw)
      ::ChartRedraw(this.ID());
   return true;
  }
//+------------------------------------------------------------------+
//| Set the flag of managing the chart using a keyboard              |
//+------------------------------------------------------------------+
bool CChartObj::SetKeyboardControlFlag(const string source,const bool flag,const bool redraw=false)
  {
   ::ResetLastError();
   if(!::ChartSetInteger(this.ID(),CHART_KEYBOARD_CONTROL,flag))
     {
      CMessage::ToLog(source,::GetLastError(),true);
      return false;
     }
   this.SetProperty(CHART_PROP_KEYBOARD_CONTROL,flag);
   if(redraw)
      ::ChartRedraw(this.ID());
   return true;
  }
//+---------------------------------------------------------------------+
//| Set the flag of intercepting Space and Enter keystrokes by the chart|
//| to activate the fast navigation bar                                 |
//+---------------------------------------------------------------------+
bool CChartObj::SetQuickNavigationFlag(const string source,const bool flag,const bool redraw=false)
  {
   ::ResetLastError();
   if(!::ChartSetInteger(this.ID(),CHART_QUICK_NAVIGATION,flag))
     {
      CMessage::ToLog(source,::GetLastError(),true);
      return false;
     }
   this.SetProperty(CHART_PROP_QUICK_NAVIGATION,flag);
   if(redraw)
      ::ChartRedraw(this.ID());
   return true;
  }
//+------------------------------------------------------------------+
//| Set the fixed scale flag                                         |
//+------------------------------------------------------------------+
bool CChartObj::SetScaleFixFlag(const string source,const bool flag,const bool redraw=false)
  {
   ::ResetLastError();
   if(!::ChartSetInteger(this.ID(),CHART_SCALEFIX,flag))
     {
      CMessage::ToLog(source,::GetLastError(),true);
      return false;
     }
   this.SetProperty(CHART_PROP_SCALEFIX,flag);
   if(redraw)
      ::ChartRedraw(this.ID());
   return true;
  }
//+------------------------------------------------------------------+
//| Set the 1:1 scale flag                                           |
//+------------------------------------------------------------------+
bool CChartObj::SetScaleFix11Flag(const string source,const bool flag,const bool redraw=false)
  {
   ::ResetLastError();
   if(!::ChartSetInteger(this.ID(),CHART_SCALEFIX_11,flag))
     {
      CMessage::ToLog(source,::GetLastError(),true);
      return false;
     }
   this.SetProperty(CHART_PROP_SCALEFIX_11,flag);
   if(redraw)
      ::ChartRedraw(this.ID());
   return true;
  }
//+------------------------------------------------------------------+
//| Set the flag of specifying a scale in points per bar             |
//+------------------------------------------------------------------+
bool CChartObj::SetScalePTPerBarFlag(const string source,const bool flag,const bool redraw=false)
  {
   ::ResetLastError();
   if(!::ChartSetInteger(this.ID(),CHART_SCALE_PT_PER_BAR,flag))
     {
      CMessage::ToLog(source,::GetLastError(),true);
      return false;
     }
   this.SetProperty(CHART_PROP_SCALE_PT_PER_BAR,flag);
   if(redraw)
      ::ChartRedraw(this.ID());
   return true;
  }
//+------------------------------------------------------------------+
//|Set the flag displaying a symbol ticker in the upper left corner  |
//+------------------------------------------------------------------+
bool CChartObj::SetShowTickerFlag(const string source,const bool flag,const bool redraw=false)
  {
   ::ResetLastError();
   if(!::ChartSetInteger(this.ID(),CHART_SHOW_TICKER,flag))
     {
      CMessage::ToLog(source,::GetLastError(),true);
      return false;
     }
   this.SetProperty(CHART_PROP_SHOW_TICKER,flag);
   if(redraw)
      ::ChartRedraw(this.ID());
   return true;
  }
//+------------------------------------------------------------------+
//|Set the flag displaying OHLC values in the upper left corner      |
//+------------------------------------------------------------------+
bool CChartObj::SetShowOHLCFlag(const string source,const bool flag,const bool redraw=false)
  {
   ::ResetLastError();
   if(!::ChartSetInteger(this.ID(),CHART_SHOW_OHLC,flag))
     {
      CMessage::ToLog(source,::GetLastError(),true);
      return false;
     }
   this.SetProperty(CHART_PROP_SHOW_OHLC,flag);
   if(redraw)
      ::ChartRedraw(this.ID());
   return true;
  }
//+------------------------------------------------------------------+
//| Set the flag of displaying the Bid value                         |
//| using a horizontal line on the chart                             |
//+------------------------------------------------------------------+
bool CChartObj::SetShowBidLineFlag(const string source,const bool flag,const bool redraw=false)
  {
   ::ResetLastError();
   if(!::ChartSetInteger(this.ID(),CHART_SHOW_BID_LINE,flag))
     {
      CMessage::ToLog(source,::GetLastError(),true);
      return false;
     }
   this.SetProperty(CHART_PROP_SHOW_BID_LINE,flag);
   if(redraw)
      ::ChartRedraw(this.ID());
   return true;
  }
//+------------------------------------------------------------------+
//| Set the flag of displaying the Ask value                         |
//| using a horizontal line on the chart                             |
//+------------------------------------------------------------------+
bool CChartObj::SetShowAskLineFlag(const string source,const bool flag,const bool redraw=false)
  {
   ::ResetLastError();
   if(!::ChartSetInteger(this.ID(),CHART_SHOW_ASK_LINE,flag))
     {
      CMessage::ToLog(source,::GetLastError(),flag);
      return false;
     }
   this.SetProperty(CHART_PROP_SHOW_ASK_LINE,flag);
   if(redraw)
      ::ChartRedraw(this.ID());
   return true;
  }
//+------------------------------------------------------------------+
//| Set the flag of displaying the Last value                        |
//| using a horizontal line on the chart                             |
//+------------------------------------------------------------------+
bool CChartObj::SetShowLastLineFlag(const string source,const bool flag,const bool redraw=false)
  {
   ::ResetLastError();
   if(!::ChartSetInteger(this.ID(),CHART_SHOW_LAST_LINE,flag))
     {
      CMessage::ToLog(source,::GetLastError(),true);
      return false;
     }
   this.SetProperty(CHART_PROP_SHOW_LAST_LINE,flag);
   if(redraw)
      ::ChartRedraw(this.ID());
   return true;
  }
//+------------------------------------------------------------------+
//| Set the flag of displaying vertical separators                   |
//| between adjacent periods                                         |
//+------------------------------------------------------------------+
bool CChartObj::SetShowPeriodSeparatorsFlag(const string source,const bool flag,const bool redraw=false)
  {
   ::ResetLastError();
   if(!::ChartSetInteger(this.ID(),CHART_SHOW_PERIOD_SEP,flag))
     {
      CMessage::ToLog(source,::GetLastError(),true);
      return false;
     }
   this.SetProperty(CHART_PROP_SHOW_PERIOD_SEP,flag);
   if(redraw)
      ::ChartRedraw(this.ID());
   return true;
  }
//+------------------------------------------------------------------+
//| Set the flag of displaying a grid on the chart                   |
//+------------------------------------------------------------------+
bool CChartObj::SetShowGridFlag(const string source,const bool flag,const bool redraw=false)
  {
   ::ResetLastError();
   if(!::ChartSetInteger(this.ID(),CHART_SHOW_GRID,flag))
     {
      CMessage::ToLog(source,::GetLastError(),true);
      return false;
     }
   this.SetProperty(CHART_PROP_SHOW_GRID,flag);
   if(redraw)
      ::ChartRedraw(this.ID());
   return true;
  }
//+------------------------------------------------------------------+
//| Set the flag of displaying object text descriptions              |
//+------------------------------------------------------------------+
bool CChartObj::SetShowObjectDescriptionsFlag(const string source,const bool flag,const bool redraw=false)
  {
   ::ResetLastError();
   if(!::ChartSetInteger(this.ID(),CHART_SHOW_OBJECT_DESCR,flag))
     {
      CMessage::ToLog(source,::GetLastError(),true);
      return false;
     }
   this.SetProperty(CHART_PROP_SHOW_OBJECT_DESCR,flag);
   if(redraw)
      ::ChartRedraw(this.ID());
   return true;
  }
//+------------------------------------------------------------------+
//| Set the flag of displaying trading levels on the chart           |
//+------------------------------------------------------------------+
bool CChartObj::SetShowTradeLevelsFlag(const string source,const bool flag,const bool redraw=false)
  {
   ::ResetLastError();
   if(!::ChartSetInteger(this.ID(),CHART_SHOW_TRADE_LEVELS,flag))
     {
      CMessage::ToLog(source,::GetLastError(),true);
      return false;
     }
   this.SetProperty(CHART_PROP_SHOW_TRADE_LEVELS,flag);
   if(redraw)
      ::ChartRedraw(this.ID());
   return true;
  }
//+------------------------------------------------------------------+
//| Set the flag enabling dragging                                   |
//| trading levels on a chart using a mouse                          |
//+------------------------------------------------------------------+
bool CChartObj::SetDragTradeLevelsFlag(const string source,const bool flag,const bool redraw=false)
  {
   ::ResetLastError();
   if(!::ChartSetInteger(this.ID(),CHART_DRAG_TRADE_LEVELS,flag))
     {
      CMessage::ToLog(source,::GetLastError(),true);
      return false;
     }
   this.SetProperty(CHART_PROP_DRAG_TRADE_LEVELS,flag);
   if(redraw)
      ::ChartRedraw(this.ID());
   return true;
  }
//+------------------------------------------------------------------+
//| Set the flag of displaying the time scale on the chart           |
//+------------------------------------------------------------------+
bool CChartObj::SetShowDateScaleFlag(const string source,const bool flag,const bool redraw=false)
  {
   ::ResetLastError();
   if(!::ChartSetInteger(this.ID(),CHART_SHOW_DATE_SCALE,flag))
     {
      CMessage::ToLog(source,::GetLastError(),true);
      return false;
     }
   this.SetProperty(CHART_PROP_SHOW_DATE_SCALE,flag);
   if(redraw)
      ::ChartRedraw(this.ID());
   return true;
  }
//+------------------------------------------------------------------+
//| Set the flag of displaying the price scale on the chart          |
//+------------------------------------------------------------------+
bool CChartObj::SetShowPriceScaleFlag(const string source,const bool flag,const bool redraw=false)
  {
   ::ResetLastError();
   if(!::ChartSetInteger(this.ID(),CHART_SHOW_PRICE_SCALE,flag))
     {
      CMessage::ToLog(source,::GetLastError(),true);
      return false;
     }
   this.SetProperty(CHART_PROP_SHOW_PRICE_SCALE,flag);
   if(redraw)
      ::ChartRedraw(this.ID());
   return true;
  }
//+------------------------------------------------------------------+
//|Set the flag of displaying the quick trading panel on the chart   |
//+------------------------------------------------------------------+
bool CChartObj::SetShowOneClickPanelFlag(const string source,const bool flag,const bool redraw=false)
  {
   ::ResetLastError();
   if(!::ChartSetInteger(this.ID(),CHART_SHOW_ONE_CLICK,flag))
     {
      CMessage::ToLog(source,::GetLastError(),true);
      return false;
     }
   this.SetProperty(CHART_PROP_SHOW_ONE_CLICK,flag);
   if(redraw)
      ::ChartRedraw(this.ID());
   return true;
  }
//+------------------------------------------------------------------+
//| Set the flag of docking a chart window                           |
//+------------------------------------------------------------------+
bool CChartObj::SetDockedFlag(const string source,const bool flag,const bool redraw=false)
  {
   ::ResetLastError();
   if(!::ChartSetInteger(this.ID(),CHART_IS_DOCKED,flag))
     {
      CMessage::ToLog(source,::GetLastError(),true);
      return false;
     }
   this.SetProperty(CHART_PROP_IS_DOCKED,flag);
   if(redraw)
      ::ChartRedraw(this.ID());
   return true;
  }
//+------------------------------------------------------------------+
Como podemos ver, todos estos métodos resultan idénticos a los anteriores, con la excepción de la propiedad a modificar (marcada a color en el último método).
Aquí tenemos los tres métodos privados encargados de configurar los modos de representación del gráfico, la escala y los volúmenes en el gráfico:
//+------------------------------------------------------------------+
//| Set the chart type                                               |
//+------------------------------------------------------------------+
bool CChartObj::SetMode(const string source,const ENUM_CHART_MODE mode,const bool redraw=false)
  {
   ::ResetLastError();
   if(!::ChartSetInteger(this.ID(),CHART_MODE,mode))
     {
      CMessage::ToLog(source,::GetLastError(),true);
      return false;
     }
   this.SetProperty(CHART_PROP_MODE,mode);
   if(redraw)
      ::ChartRedraw(this.ID());
   return true;
  }
//+------------------------------------------------------------------+
//| Set the chart scale                                              |
//+------------------------------------------------------------------+
bool CChartObj::SetScale(const string source,const int scale,const bool redraw=false)
  {
   int value=(scale<0 ? 0 : scale>5 ? 5 : scale);
   ::ResetLastError();
   if(!::ChartSetInteger(this.ID(),CHART_SCALE,value))
     {
      CMessage::ToLog(source,::GetLastError(),true);
      return false;
     }
   this.SetProperty(CHART_PROP_SCALE,value);
   if(redraw)
      ::ChartRedraw(this.ID());
   return true;
  }
//+------------------------------------------------------------------+
//| Set the mode of displaying the volumes on a chart                |
//+------------------------------------------------------------------+
bool CChartObj::SetModeVolume(const string source,ENUM_CHART_VOLUME_MODE mode,const bool redraw=false)
  {
   ::ResetLastError();
   if(!::ChartSetInteger(this.ID(),CHART_SHOW_VOLUMES,mode))
     {
      CMessage::ToLog(source,::GetLastError(),true);
      return false;
     }
   this.SetProperty(CHART_PROP_SHOW_VOLUMES,mode);
   if(redraw)
      ::ChartRedraw(this.ID());
   return true;
  }
//+------------------------------------------------------------------+
Los métodos también son idénticos a los analizados anteriormente, salvo por los parámetros de entrada en los que se transmiten los modos requeridos en lugar de las banderas, y en el método de configuración de la escala del gráfico; además, se comprueban los límites del valor de escala transmitido, de 0 a 5.
Los gráficos tienen propiedades que no se pueden configurar: solo podemos obtenerlas. Pero para que el objeto de gráfico tenga los mismos valores que el gráfico, necesitaremos métodos que nos permitan escribir los valores de los parámetros del gráfico en las propiedades del objeto correspondientes. Estas se establecen al crear el objeto de gráfico, pero si el terminal las cambia, deberemos reaccionar a tiempo a este cambio y realizar las modificaciones adecuadas en las propiedades del objeto de gráfico.
Precisamente para ello se han pensado los siguientes métodos privados:
//+------------------------------------------------------------------+
//|  Set the property                                                |
//| "Number of bars on a chart that are available for display"       |
//+------------------------------------------------------------------+
void CChartObj::SetVisibleBars(void)
  {
   this.SetProperty(CHART_PROP_VISIBLE_BARS,::ChartGetInteger(this.ID(),CHART_VISIBLE_BARS));
  }
//+--------------------------------------------------------------------+
//|  Set the property                                                  |
//| "The total number of chart windows including indicator subwindows" |
//+--------------------------------------------------------------------+
void CChartObj::SetWindowsTotal(void)
  {
   this.SetProperty(CHART_PROP_WINDOWS_TOTAL,::ChartGetInteger(this.ID(),CHART_WINDOWS_TOTAL));
  }
//+----------------------------------------------------------------------+
//| Set the property "The number of the first visible bar on the chart"  |
//+----------------------------------------------------------------------+
void CChartObj::SetFirstVisibleBars(void)
  {
   this.SetProperty(CHART_PROP_FIRST_VISIBLE_BAR,::ChartGetInteger(this.ID(),CHART_FIRST_VISIBLE_BAR));
  }
//+------------------------------------------------------------------+
//| Set the property "Width of the chart in bars"                    |
//+------------------------------------------------------------------+
void CChartObj::SetWidthInBars(void)
  {
   this.SetProperty(CHART_PROP_WIDTH_IN_BARS,::ChartGetInteger(this.ID(),CHART_WIDTH_IN_BARS));
  }
//+------------------------------------------------------------------+
//| Set the property "Width of the chart in pixels"                  |
//+------------------------------------------------------------------+
void CChartObj::SetWidthInPixels(void)
  {
   this.SetProperty(CHART_PROP_WIDTH_IN_PIXELS,::ChartGetInteger(this.ID(),CHART_WIDTH_IN_PIXELS));
  }
//+------------------------------------------------------------------+
//| Set the property "Chart window maximized"                        |
//+------------------------------------------------------------------+
void CChartObj::SetMaximizedFlag(void)
  {
   this.SetProperty(CHART_PROP_IS_MAXIMIZED,::ChartGetInteger(this.ID(),CHART_IS_MAXIMIZED));
  }
//+------------------------------------------------------------------+
//| Set the property "Chart window minimized"                        |
//+------------------------------------------------------------------+
void CChartObj::SetMinimizedFlag(void)
  {
   this.SetProperty(CHART_PROP_IS_MINIMIZED,::ChartGetInteger(this.ID(),CHART_IS_MINIMIZED));
  }
//+------------------------------------------------------------------+
//| Set the property "Name of an EA launched on the chart"           |
//+------------------------------------------------------------------+
void CChartObj::SetExpertName(void)
  {
   this.SetProperty(CHART_PROP_EXPERT_NAME,::ChartGetString(this.ID(),CHART_EXPERT_NAME));
  }
//+------------------------------------------------------------------+
//| Set the property "Name of a script launched on the chart"        |
//+------------------------------------------------------------------+
void CChartObj::SetScriptName(void)
  {
   this.SetProperty(CHART_PROP_SCRIPT_NAME,::ChartGetString(this.ID(),CHART_SCRIPT_NAME));
  }
//+------------------------------------------------------------------+
Aquí, solo se registra el parámetro del gráfico en la propiedad de objeto correspondiente al mismo. Implementaremos el trabajo con estos métodos en artículos posteriores.
Ahora, necesitaremos añadir a la sección pública de la clase los métodos de acceso simplificado a las propiedades del objeto de gráfico. Estos serán los métodos encargados de establecer los parámetros del gráfico en el estado Activado/Desactivado, así como de configurar el color, el tamaño y otras funcionalidades necesarias para trabajar con el gráfico.
Hay muchos métodos, así que los analizaremos por grupos.
Métodos de retorno/establecimiento de propiedades con los valores Activado/Desactivado:
//--- Constructors
                     CChartObj(){;}
                     CChartObj(const long chart_id);
//+------------------------------------------------------------------+
//| Methods of simplified access to chart object properties          |
//+------------------------------------------------------------------+
//--- (1) Return, (2) enable, (3) disable drawing a price chart
   bool              IsShow(void)                                    const { return (bool)this.GetProperty(CHART_PROP_SHOW);              }
   bool              SetShowON(const bool redraw=false)                    { return this.SetShowFlag(DFUN,true,redraw);                   }
   bool              SetShowOFF(const bool redraw=false)                   { return this.SetShowFlag(DFUN,true,redraw);                   }

//--- (1) Return, (2) enable, (3) disable access to the context menu using the right click
   bool              IsAllowedContextMenu(void)                      const { return (bool)this.GetProperty(CHART_PROP_CONTEXT_MENU);      }
   bool              SetContextMenuON(const bool redraw=false)             { return this.SetContextMenuFlag(DFUN,true,redraw);            }
   bool              SetContextMenuOFF(const bool redraw=false)            { return this.SetContextMenuFlag(DFUN,false,redraw);           }

//--- (1) Return, (2) enable, (3) disable access to the Crosshair using the middle click
   bool              IsCrosshairTool(void)                           const { return (bool)this.GetProperty(CHART_PROP_CROSSHAIR_TOOL);    }
   bool              SetCrosshairToolON(const bool redraw=false);
   bool              SetCrosshairToolOFF(const bool redraw=false);

//--- (1) Return, (2) enable, (3) disable scrolling the chart horizontally using the left click
   bool              IsMouseScroll(void)                             const { return (bool)this.GetProperty(CHART_PROP_MOUSE_SCROLL);      }
   bool              SetMouseScrollON(const bool redraw=false)             { return this.SetMouseScrollFlag(DFUN,true,redraw);            }
   bool              SetMouseScrollOFF(const bool redraw=false)            { return this.SetMouseScrollFlag(DFUN,false,redraw);           }

//--- (1) Return, (2) enable, (3) disable sending messages about mouse wheel events to all MQL5 programs on a chart
   bool              IsEventMouseWhell(void)                         const { return (bool)this.GetProperty(CHART_PROP_EVENT_MOUSE_WHEEL); }
   bool              SetEventMouseWhellON(const bool redraw=false)         { return this.SetEventMouseWhellFlag(DFUN,true,redraw);        }
   bool              SetEventMouseWhellOFF(const bool redraw=false)        { return this.SetEventMouseWhellFlag(DFUN,false,redraw);       }

//--- (1) Return, (2) enable, (3) disable sending messages about mouse button movement and click events to all MQL5 programs on a chart
   bool              IsEventMouseMove(void)                          const { return (bool)this.GetProperty(CHART_PROP_EVENT_MOUSE_MOVE);  }
   bool              SetEventMouseMoveON(const bool redraw=false)          { return this.SetEventMouseMoveFlag(DFUN,true,redraw);         }
   bool              SetEventMouseMoveOFF(const bool redraw=false)         { return this.SetEventMouseMoveFlag(DFUN,false,redraw);        }

//--- (1) Return, (2) enable, (3) disable sending messages about the graphical object creation event to all MQL5 programs on a chart
   bool              IsEventObjectCreate(void)                       const { return (bool)this.GetProperty(CHART_PROP_EVENT_OBJECT_CREATE);}
   bool              SetEventObjectCreateON(const bool redraw=false)       { return this.SetEventObjectCreateFlag(DFUN,true,redraw);      }
   bool              SetEventObjectCreateOFF(const bool redraw=false)      { return this.SetEventObjectCreateFlag(DFUN,false,redraw);     }

//--- (1) Return, (2) enable, (3) disable sending messages about the graphical object destruction event to all MQL5 programs on a chart
   bool              IsEventObjectDelete(void)                       const { return (bool)this.GetProperty(CHART_PROP_EVENT_OBJECT_DELETE);}
   bool              SetEventObjectDeleteON(const bool redraw=false)       { return this.SetEventObjectDeleteFlag(DFUN,true,redraw);      }
   bool              SetEventObjectDeleteOFF(const bool redraw=false)      { return this.SetEventObjectDeleteFlag(DFUN,false,redraw);     }

//--- (1) Return, (2) enable, (3) disable price chart in the foreground
   bool              IsForeground(void)                              const { return (bool)this.GetProperty(CHART_PROP_FOREGROUND);        }
   bool              SetForegroundON(const bool redraw=false)              { return this.SetForegroundFlag(DFUN,true,redraw);             }
   bool              SetForegroundOFF(const bool redraw=false)             { return this.SetForegroundFlag(DFUN,false,redraw);            }

//--- (1) Return, (2) enable, (3) disable shift of the price chart from the right border
   bool              IsShift(void)                                   const { return (bool)this.GetProperty(CHART_PROP_SHIFT);             }
   bool              SetShiftON(const bool redraw=false)                   { return this.SetShiftFlag(DFUN,true,redraw);                  }
   bool              SetShiftOFF(const bool redraw=false)                  { return this.SetShiftFlag(DFUN,false,redraw);                 }

//--- (1) Return, (2) enable, (3) disable auto scroll to the right border of the chart
   bool              IsAutoscroll(void)                              const { return (bool)this.GetProperty(CHART_PROP_AUTOSCROLL);        }
   bool              SetAutoscrollON(const bool redraw=false)              { return this.SetAutoscrollFlag(DFUN,true,redraw);             }
   bool              SetAutoscrollOFF(const bool redraw=false)             { return this.SetAutoscrollFlag(DFUN,false,redraw);            }

//--- (1) Return, (2) enable, (3) disable the permission to manage the chart using a keyboard
   bool              IsKeyboardControl(void)                         const { return (bool)this.GetProperty(CHART_PROP_KEYBOARD_CONTROL);  }
   bool              SetKeyboardControlON(const bool redraw=false)         { return this.SetKeyboardControlFlag(DFUN,true,redraw);        }
   bool              SetKeyboardControlOFF(const bool redraw=false)        { return this.SetKeyboardControlFlag(DFUN,false,redraw);       }

//--- (1) Return, (2) enable, (3) disable the permission for the chart to intercept Space and Enter key strokes to activate the quick navigation bar
   bool              IsQuickNavigation(void)                         const { return (bool)this.GetProperty(CHART_PROP_QUICK_NAVIGATION);  }
   bool              SetQuickNavigationON(const bool redraw=false)         { return this.SetQuickNavigationFlag(DFUN,true,redraw);        }
   bool              SetQuickNavigationOFF(const bool redraw=false)        { return this.SetQuickNavigationFlag(DFUN,false,redraw);       }

//--- (1) Return, (2) enable, (3) disable a fixed scale
   bool              IsScaleFix(void)                                const { return (bool)this.GetProperty(CHART_PROP_SCALEFIX);          }
   bool              SetScaleFixON(const bool redraw=false)                { return this.SetScaleFixFlag(DFUN,true,redraw);               }
   bool              SetScaleFixOFF(const bool redraw=false)               { return this.SetScaleFixFlag(DFUN,false,redraw);              }

//--- (1) Return, (2) enable, (3) disable the 1:1 scale
   bool              IsScaleFix11(void)                              const { return (bool)this.GetProperty(CHART_PROP_SCALEFIX_11);       }
   bool              SetScaleFix11ON(const bool redraw=false)              { return this.SetScaleFix11Flag(DFUN,true,redraw);             }
   bool              SetScaleFix11OFF(const bool redraw=false)             { return this.SetScaleFix11Flag(DFUN,false,redraw);            }

//--- (1) Return, (2) enable, (3) disable the mode of specifying the chart scale in points per bar
   bool              IsScalePTPerBar(void)                           const { return (bool)this.GetProperty(CHART_PROP_SCALE_PT_PER_BAR);  }
   bool              SetScalePTPerBarON(const bool redraw=false)           { return this.SetScalePTPerBarFlag(DFUN,true,redraw);          }
   bool              SetScalePTPerBarOFF(const bool redraw=false)          { return this.SetScalePTPerBarFlag(DFUN,false,redraw);         }

//--- (1) Return, (2) enable, (3) disable a display of a symbol ticker in the upper left corner
   bool              IsShowTicker(void)                              const { return (bool)this.GetProperty(CHART_PROP_SHOW_TICKER);       }
   bool              SetShowTickerON(const bool redraw=false)              { return this.SetShowTickerFlag(DFUN,true,redraw);             }
   bool              SetShowTickerOFF(const bool redraw=false)             { return this.SetShowTickerFlag(DFUN,false,redraw);            }

//--- (1) Return, (2) enable, (3) disable a display of OHLC values in the upper left corner
   bool              IsShowOHLC(void)                                const { return (bool)this.GetProperty(CHART_PROP_SHOW_OHLC);         }
   bool              SetShowOHLCON(const bool redraw=false)                { return this.SetShowOHLCFlag(DFUN,true,redraw);               }
   bool              SetShowOHLCOFF(const bool redraw=false)               { return this.SetShowOHLCFlag(DFUN,false,redraw);              }

//--- (1) Return, (2) enable, (3) disable the display of a Bid value as a horizontal line on the chart
   bool              IsShowBidLine(void)                             const { return (bool)this.GetProperty(CHART_PROP_SHOW_BID_LINE);     }
   bool              SetShowBidLineON(const bool redraw=false)             { return this.SetShowBidLineFlag(DFUN,true,redraw);            }
   bool              SetShowBidLineOFF(const bool redraw=false)            { return this.SetShowBidLineFlag(DFUN,false,redraw);           }

//--- (1) Return, (2) enable, (3) disable the display of a Ask value as a horizontal line on the chart
   bool              IsShowAskLine(void)                             const { return (bool)this.GetProperty(CHART_PROP_SHOW_ASK_LINE);     }
   bool              SetShowAskLineON(const bool redraw=false)             { return this.SetShowAskLineFlag(DFUN,true,redraw);            }
   bool              SetShowAskLineOFF(const bool redraw=false)            { return this.SetShowAskLineFlag(DFUN,false,redraw);           }

//--- (1) Return, (2) enable, (3) disable the display of a Last value as a horizontal line on the chart
   bool              IsShowLastLine(void)                            const { return (bool)this.GetProperty(CHART_PROP_SHOW_LAST_LINE);    }
   bool              SetShowLastLineON(const bool redraw=false)            { return this.SetShowLastLineFlag(DFUN,true,redraw);           }
   bool              SetShowLastLineOFF(const bool redraw=false)           { return this.SetShowLastLineFlag(DFUN,false,redraw);          }

//--- (1) Return, (2) enable, (3) disable the display of vertical separators between adjacent periods
   bool              IsShowPeriodSeparators(void)                    const { return (bool)this.GetProperty(CHART_PROP_SHOW_PERIOD_SEP);   }
   bool              SetShowPeriodSeparatorsON(const bool redraw=false)    { return this.SetShowPeriodSeparatorsFlag(DFUN,true,redraw);   }
   bool              SetShowPeriodSeparatorsOFF(const bool redraw=false)   { return this.SetShowPeriodSeparatorsFlag(DFUN,false,redraw);  }

//--- (1) Return, (2) enable, (3) disable the display of the chart grid
   bool              IsShowGrid(void)                                const { return (bool)this.GetProperty(CHART_PROP_SHOW_GRID);         }
   bool              SetShowGridON(const bool redraw=false)                { return this.SetShowGridFlag(DFUN,true,redraw);               }
   bool              SetShowGridOFF(const bool redraw=false)               { return this.SetShowGridFlag(DFUN,false,redraw);              }

//--- (1) Return, (2) enable, (3) disable the display of text descriptions of objects
   bool              IsShowObjectDescriptions(void)   const { return (bool)this.GetProperty(CHART_PROP_SHOW_OBJECT_DESCR);                }
   bool              SetShowObjectDescriptionsON(const bool redraw=false);
   bool              SetShowObjectDescriptionsOFF(const bool redraw=false);

//--- (1) Return, (2) enable, (3) disable the display of trade levels on the chart (levels of open positions, Stop Loss, Take Profit and pending orders)
   bool              IsShowTradeLevels(void)                         const { return (bool)this.GetProperty(CHART_PROP_SHOW_TRADE_LEVELS); }
   bool              SetShowTradeLevelsON(const bool redraw=false)         { return this.SetShowTradeLevelsFlag(DFUN,true,redraw);        }
   bool              SetShowTradeLevelsOFF(const bool redraw=false)        { return this.SetShowTradeLevelsFlag(DFUN,false,redraw);       }

//--- (1) Return, (2) enable, (3) disable the ability to drag trading levels on a chart using mouse
   bool              IsDragTradeLevels(void)                         const { return (bool)this.GetProperty(CHART_PROP_DRAG_TRADE_LEVELS); }
   bool              SetDragTradeLevelsON(const bool redraw=false)         { return this.SetDragTradeLevelsFlag(DFUN,true,redraw);        }
   bool              SetDragTradeLevelsOFF(const bool redraw=false)        { return this.SetDragTradeLevelsFlag(DFUN,false,redraw);       }

//--- (1) Return, (2) enable, (3) disable the display of the time scale on the chart
   bool              IsShowDateScale(void)                           const { return (bool)this.GetProperty(CHART_PROP_SHOW_DATE_SCALE);   }
   bool              SetShowDateScaleON(const bool redraw=false)           { return this.SetShowDateScaleFlag(DFUN,true,redraw);          }
   bool              SetShowDateScaleOFF(const bool redraw=false)          { return this.SetShowDateScaleFlag(DFUN,false,redraw);         }

//--- (1) Return, (2) enable, (3) disable the display of the price scale on the chart
   bool              IsShowPriceScale(void)                          const { return (bool)this.GetProperty(CHART_PROP_SHOW_PRICE_SCALE);  }
   bool              SetShowPriceScaleON(const bool redraw=false)          { return this.SetShowPriceScaleFlag(DFUN,true,redraw);         }
   bool              SetShowPriceScaleOFF(const bool redraw=false)         { return this.SetShowPriceScaleFlag(DFUN,false,redraw);        }

//--- (1) Return, (2) enable, (3) disable the display of the quick trading panel on the chart
   bool              IsShowOneClickPanel(void)                       const { return (bool)this.GetProperty(CHART_PROP_SHOW_ONE_CLICK);    }
   bool              SetShowOneClickPanelON(const bool redraw=false)       { return this.SetShowOneClickPanelFlag(DFUN,true,redraw);      }
   bool              SetShowOneClickPanelOFF(const bool redraw=false)      { return this.SetShowOneClickPanelFlag(DFUN,false,redraw);     }

//--- (1) Return, (2) enable, (3) disable docking the chart window
   bool              IsDocked(void)                                  const { return (bool)this.GetProperty(CHART_PROP_IS_DOCKED);         }
   bool              SetDockedON(const bool redraw=false)                  { return this.SetDockedFlag(DFUN,true,redraw); }
   bool              SetDockedOFF(const bool redraw=false)                 { return this.SetDockedFlag(DFUN,false,redraw); }

//--- (1) Enable and (2) disable the display of the chart above all others
   bool              SetBringToTopON(const bool redraw=false)              { return this.SetBringToTopFlag(DFUN,true,redraw);             }
   bool              SetBringToTopOFF(const bool redraw=false)             { return this.SetBringToTopFlag(DFUN,false,redraw);            }
Todos los métodos de establecimiento de banderas son idénticos, y retornan el resultado del funcionamiento de los métodos privados correspondientes de establecimiento de banderas que hemos descrito anteriormente. Los métodos que retornan los valores de las propiedades devuelven el valor escrito en la propiedad correspondiente del objeto. Los dos últimos métodos solo establecen banderas, ya que no hay forma de retornar una propiedad del gráfico "por encima de todas las demás" usando la función ChartGetInteger() con el identificador CHART_BRING_TO_TOP; esta es una propiedad del gráfico solo para escribir valores.
Aquí tenemos los métodos encargados de retornar/establecer los modos de representación del gráfico, la escala y los volúmenes en el gráfico:
//--- (1) Return, set the chart type (2) bars, (3) candles, (4) line
   ENUM_CHART_MODE   Mode(void)                                      const { return (ENUM_CHART_MODE)this.GetProperty(CHART_PROP_MODE);   }
   bool              SetModeBars(const bool redraw=false)                  { return this.SetMode(DFUN,CHART_BARS,redraw);                 }
   bool              SetModeCandles(const bool redraw=false)               { return this.SetMode(DFUN,CHART_CANDLES,redraw);              }
   bool              SetModeLine(const bool redraw=false)                  { return this.SetMode(DFUN,CHART_LINE,redraw);                 }

//--- (1) Return, (2 - 7) set the chart scale
   int               Scale(void)                                     const { return (int)this.GetProperty(CHART_PROP_SCALE);              }
   bool              SetScale0(const bool redraw=false)                    { return this.SetScale(DFUN,0,redraw);                         }
   bool              SetScale1(const bool redraw=false)                    { return this.SetScale(DFUN,1,redraw);                         }
   bool              SetScale2(const bool redraw=false)                    { return this.SetScale(DFUN,2,redraw);                         }
   bool              SetScale3(const bool redraw=false)                    { return this.SetScale(DFUN,3,redraw);                         }
   bool              SetScale4(const bool redraw=false)                    { return this.SetScale(DFUN,4,redraw);                         }
   bool              SetScale5(const bool redraw=false)                    { return this.SetScale(DFUN,5,redraw);                         }

//--- (1) Return, set the volume display modes (2) disabled, (3) tick volumes, (4) real volumes
   ENUM_CHART_VOLUME_MODE  ModeVolume(void)                          const { return (ENUM_CHART_VOLUME_MODE)this.GetProperty(CHART_PROP_SHOW_VOLUMES);}
   bool              SetModeVolumeHide(const bool redraw=false)            { return this.SetModeVolume(DFUN,CHART_VOLUME_HIDE,redraw);    }
   bool              SetModeVolumeTick(const bool redraw=false)            { return this.SetModeVolume(DFUN,CHART_VOLUME_TICK,redraw);    }
   bool              SetModeVolumeReal(const bool redraw=false)            { return this.SetModeVolume(DFUN,CHART_VOLUME_REAL,redraw);    }
Aquí, los métodos para retornar los valores de las propiedades son idénticos a los métodos para retornar las banderas: se retorna el valor establecido en la propiedad correspondiente del objeto. Y los métodos de configuración de valores retornan el resultado del funcionamiento de los métodos privados con el valor indicado, que debemos asignar a la propiedad del objeto y al gráfico.
Métodos para retornar y configurar los colores de representación de varios elementos en el gráfico y otros parámetros modificables del gráfico:
//--- Return, (2) set the chart background color
   color             ColorBackground(void)                           const { return (color)this.GetProperty(CHART_PROP_COLOR_BACKGROUND); }
   bool              SetColorBackground(const color colour,const bool redraw=false);

//--- (1) Return, (2) set the color of axes, scale and OHLC line
   color             ColorForeground(void)                           const { return (color)this.GetProperty(CHART_PROP_COLOR_FOREGROUND); }
   bool              SetColorForeground(const color colour,const bool redraw=false);

//--- (1) Return and (2) set the grid color
   color             ColorGrid(void)                                 const { return (color)this.GetProperty(CHART_PROP_COLOR_GRID);       }
   bool              SetColorGrid(const color colour,const bool redraw=false);

//--- (1) Return and (2) set the volume color and position opening levels
   color             ColorVolume(void)                               const { return (color)this.GetProperty(CHART_PROP_COLOR_VOLUME);     }
   bool              SetColorVolume(const color colour,const bool redraw=false);

//--- (1) Return and (2) set the color of up bar, its shadow and border of bullish candle body
   color             ColorUp(void)                                   const { return (color)this.GetProperty(CHART_PROP_COLOR_CHART_UP);   }
   bool              SetColorUp(const color colour,const bool redraw=false);

//--- (1) Return and (2) set the color of down bar, its shadow and border of bearish candle body
   color             ColorDown(void)                                 const { return (color)this.GetProperty(CHART_PROP_COLOR_CHART_DOWN); }
   bool              SetColorDown(const color colour,const bool redraw=false);

//--- (1) Return and (2) set the color of the chart line and Doji candles
   color             ColorLine(void)                                 const { return (color)this.GetProperty(CHART_PROP_COLOR_CHART_LINE); }
   bool              SetColorLine(const color colour,const bool redraw=false);

//--- (1) Return and (2) set the color of the bullish candle body
   color             ColorCandleBull(void)                           const { return (color)this.GetProperty(CHART_PROP_COLOR_CANDLE_BULL);}
   bool              SetColorCandleBull(const color colour,const bool redraw=false);

//--- (1) Return and (2) set the color of the bearish candle body
   color             ColorCandleBear(void)                           const { return (color)this.GetProperty(CHART_PROP_COLOR_CANDLE_BEAR);}
   bool              SetColorCandleBear(const color colour,const bool redraw=false);

//--- (1) Return and (2) set the Bid price line color
   color             ColorBid(void)                                  const { return (color)this.GetProperty(CHART_PROP_COLOR_BID);        }
   bool              SetColorBid(const color colour,const bool redraw=false);

//--- (1) Return and (2) set the Ask price line color
   color             ColorAsk(void)                                  const { return (color)this.GetProperty(CHART_PROP_COLOR_ASK);        }
   bool              SetColorAsk(const color colour,const bool redraw=false);

//--- (1) Return and (2) set the color of the price line of the last performed deal (Last)
   color             ColorLast(void)                                 const { return (color)this.GetProperty(CHART_PROP_COLOR_LAST);       }
   bool              SetColorLast(const color colour,const bool redraw=false);

//--- (1) Return and (2) set the color of stop order levels (Stop Loss and Take Profit)
   color             ColorStops(void)                                const { return (color)this.GetProperty(CHART_PROP_COLOR_STOP_LEVEL); }
   bool              SetColorStops(const color colour,const bool redraw=false);

//--- (1) Return and (2) set the left coordinate of the undocked chart window relative to the virtual screen
   int               FloatLeft(void)                                 const { return (int)this.GetProperty(CHART_PROP_FLOAT_LEFT);         }
   bool              SetFloatLeft(const int value,const bool redraw=false);

//--- (1) Return and (2) set the top coordinate of the undocked chart window relative to the virtual screen
   int               FloatTop(void)                                  const { return (int)this.GetProperty(CHART_PROP_FLOAT_TOP);          }
   bool              SetFloatTop(const int value,const bool redraw=false);

//--- (1) Return and (2) set the right coordinate of the undocked chart window relative to the virtual screen
   int               FloatRight(void)                                const { return (int)this.GetProperty(CHART_PROP_FLOAT_RIGHT);        }
   bool              SetFloatRight(const int value,const bool redraw=false);

//--- (1) Return and (2) set the bottom coordinate of the undocked chart window relative to the virtual screen
   int               FloatBottom(void)                               const { return (int)this.GetProperty(CHART_PROP_FLOAT_BOTTOM);       }
   bool              SetFloatBottom(const int value,const bool redraw=false);

//--- (1) Return and (2) set the shift size of the zero bar from the right border in %
   double            ShiftSize(void)                                 const { return this.GetProperty(CHART_PROP_SHIFT_SIZE);              }
   bool              SetShiftSize(const double value,const bool redraw=false);

//--- (1) Return and (2) set the chart fixed position from the left border in %
   double            FixedPosition(void)                             const { return this.GetProperty(CHART_PROP_FIXED_POSITION);          }
   bool              SetFixedPosition(const double value,const bool redraw=false);

//--- (1) Return and (2) set the fixed chart maximum
   double            FixedMaximum(void)                              const { return this.GetProperty(CHART_PROP_FIXED_MAX);               }
   bool              SetFixedMaximum(const double value,const bool redraw=false);

//--- (1) Return and (2) set the fixed chart minimum
   double            FixedMinimum(void)                              const { return this.GetProperty(CHART_PROP_FIXED_MIN);               }
   bool              SetFixedMinimum(const double value,const bool redraw=false);

//--- (1) Return and (2) set the value of the scale in points per bar
   double            PointsPerBar(void)                              const { return this.GetProperty(CHART_PROP_POINTS_PER_BAR);          }
   bool              SetPointsPerBar(const double value,const bool redraw=false);

//--- (1) Return and (2) set the comment on the chart
   string            Comment(void)                                   const { return this.GetProperty(CHART_PROP_COMMENT);                 }
   bool              SetComment(const string comment,const bool redraw=false);

//--- (1) Return and (2) set the chart symbol
   string            Symbol(void)                                    const { return this.GetProperty(CHART_PROP_SYMBOL);                  }
   bool              SetSymbol(const string symbol);

//--- (1) Return and (2) set the chart period
   ENUM_TIMEFRAMES   Timeframe(void)                                 const { return (ENUM_TIMEFRAMES)this.GetProperty(CHART_PROP_TIMEFRAME); }
   bool              SetTimeframe(const ENUM_TIMEFRAMES timeframe);
Los métodos para retornar los valores de las propiedades devuelven los valores escritos en la propiedad correspondiente del objeto, mientras que los métodos de establecimiento aquí solo son declarados;analizaremos su implementación más adelante.
Métodos que retornan las propiedades del objeto de gráfico correspondientes a los parámetros del gráfico solo para la lectura:
//--- (1) Return the Chart object identification attribute
   bool              IsObject(void)                                  const { return (bool)this.GetProperty(CHART_PROP_IS_OBJECT);         }

//--- Return the chart ID
   long              ID(void)                                        const { return this.GetProperty(CHART_PROP_ID);                      }

//--- Return the number of bars on a chart that are available for display
   int               VisibleBars(void)                               const { return (int)this.GetProperty(CHART_PROP_VISIBLE_BARS);       }

//--- Return the total number of chart windows including indicator subwindows
   int               WindowsTotal(void)                              const { return (int)this.GetProperty(CHART_PROP_WINDOWS_TOTAL);      }

//--- Return the chart window handle
   int               Handle(void)                                    const { return (int)this.GetProperty(CHART_PROP_WINDOW_HANDLE);      }

//--- Return the number of the first visible bar on the chart
   int               FirstVisibleBars(void)                          const { return (int)this.GetProperty(CHART_PROP_FIRST_VISIBLE_BAR);  }

//--- Return the chart width in bars
   int               WidthInBars(void)                               const { return (int)this.GetProperty(CHART_PROP_WIDTH_IN_BARS);      }

//--- Return the chart width in pixels
   int               WidthInPixels(void)                             const { return (int)this.GetProperty(CHART_PROP_WIDTH_IN_PIXELS);    }

//--- Return the "Chart window maximized" property
   bool              IsMaximized(void)                               const { return (bool)this.GetProperty(CHART_PROP_IS_MAXIMIZED);      }

//--- Return the "Chart window minimized" property
   bool              IsMinimized(void)                               const { return (bool)this.GetProperty(CHART_PROP_IS_MINIMIZED);      }

//--- Return the name of an EA launched on the chart
   string            ExpertName(void)                                const { return this.GetProperty(CHART_PROP_EXPERT_NAME);             }

//--- Return the name of a script launched on the chart
   string            ScriptName(void)                                const { return this.GetProperty(CHART_PROP_SCRIPT_NAME);             }
Los métodos retornan el valor escrito en la propiedad correspondiente del objeto de gráfico.
Métodos que retornan/establecen los valores de los parámetros del gráfico para los cuales se debe especificar el número de subventana:
//--- (1) Return and (2) set the height of the specified chart in pixels
   int               WindowHeightInPixels(const int sub_window)      const { return (int)::ChartGetInteger(this.ID(),CHART_HEIGHT_IN_PIXELS,sub_window);       }
   bool              SetWindowHeightInPixels(const int height,const int sub_window,const bool redraw=false);

//--- Return the distance in Y axis pixels between the upper frame of the indicator subwindow and the upper frame of the chart main window
   int               WindowYDistance(const int sub_window)           const { return (int)::ChartGetInteger(this.ID(),CHART_WINDOW_YDISTANCE,sub_window);       }

//--- Return the specified subwindow visibility
   bool              IsVisibleWindow(const int sub_window)           const { return (bool)::ChartGetInteger(this.Handle(),CHART_WINDOW_IS_VISIBLE,sub_window); }

//--- Return the minimum of the specified chart
   double            PriceMinimum(const int sub_window)              const { return ::ChartGetDouble(this.ID(),CHART_PRICE_MIN,sub_window);  }

//--- Return the maximum of the specified chart
   double            PriceMaximum(const int sub_window)              const { return ::ChartGetDouble(this.ID(),CHART_PRICE_MAX,sub_window);  }
Estos métodos todavía están aquí temporalmente, ya que más adelante, en el objeto de gráfico existirá una lista de subventanas de indicadores pertenecientes al gráfico cuyos números deberemos especificar en las funciones para establecer/retornar los valores, y estos métodos serán rediseñados. Por consiguiente, los valores se retornan no desde las propiedades del objeto, sino directamente desde el gráfico que se describe en este objeto de gráfico.
Método para emular un tick:
//--- Emulate a tick (chart updates - similar to the terminal Refresh command)
   void              EmulateTick(void)                                     { ::ChartSetSymbolPeriod(this.ID(),this.Symbol(),this.Timeframe());}

  };
//+------------------------------------------------------------------+
//| Parametric constructor                                           |
//+------------------------------------------------------------------+
Podemos utilizar la llamada de la función ChartSetSymbolPeriod() con indicación del mismo símbolo y marco temporal que en el gráfico actual para actualizar el gráfico (similar al comando Refresh en la terminal). La actualización del gráfico, a su vez, inicia el recálculo de los indicadores adjuntos al mismo. Por ello, podemos calcular el indicador en el gráfico incluso si no hay ticks (por ejemplo, los fines de semana).
Implementamos fuera del cuerpo de la clase los métodos declarados en el bloque de métodos de acceso simplificado a las propiedades del objeto.
Métodos para establecer el color de los elementos del gráfico y otros parámetros personalizados del mismo:
//+------------------------------------------------------------------+
//| Set the chart background color                                   |
//+------------------------------------------------------------------+
bool CChartObj::SetColorBackground(const color colour,const bool redraw=false)
  {
   ::ResetLastError();
   if(!::ChartSetInteger(this.ID(),CHART_COLOR_BACKGROUND,colour))
     {
      CMessage::ToLog(DFUN,::GetLastError(),true);
      return false;
     }
   this.SetProperty(CHART_PROP_COLOR_BACKGROUND,colour);
   if(redraw)
      ::ChartRedraw(this.ID());
   return true;
  }
//+------------------------------------------------------------------+
//| Set the color of axes, scale and OHLC line                       |
//+------------------------------------------------------------------+
bool CChartObj::SetColorForeground(const color colour,const bool redraw=false)
  {
   ::ResetLastError();
   if(!::ChartSetInteger(this.ID(),CHART_COLOR_FOREGROUND,colour))
     {
      CMessage::ToLog(DFUN,::GetLastError(),true);
      return false;
     }
   this.SetProperty(CHART_PROP_COLOR_FOREGROUND,colour);
   if(redraw)
      ::ChartRedraw(this.ID());
   return true;
  }
//+------------------------------------------------------------------+
//| Set the grid color                                               |
//+------------------------------------------------------------------+
bool CChartObj::SetColorGrid(const color colour,const bool redraw=false)
  {
   ::ResetLastError();
   if(!::ChartSetInteger(this.ID(),CHART_COLOR_GRID,colour))
     {
      CMessage::ToLog(DFUN,::GetLastError(),true);
      return false;
     }
   this.SetProperty(CHART_PROP_COLOR_GRID,colour);
   if(redraw)
      ::ChartRedraw(this.ID());
   return true;
  }
//+------------------------------------------------------------------+
//| Set the volume color and position opening levels                 |
//+------------------------------------------------------------------+
bool CChartObj::SetColorVolume(const color colour,const bool redraw=false)
  {
   ::ResetLastError();
   if(!::ChartSetInteger(this.ID(),CHART_COLOR_VOLUME,colour))
     {
      CMessage::ToLog(DFUN,::GetLastError(),true);
      return false;
     }
   this.SetProperty(CHART_PROP_COLOR_VOLUME,colour);
   if(redraw)
      ::ChartRedraw(this.ID());
   return true;
  }
//+----------------------------------------------------------------------+
//|Set the color of up bar, its shadow and border of bullish candle body |
//+----------------------------------------------------------------------+
bool CChartObj::SetColorUp(const color colour,const bool redraw=false)
  {
   ::ResetLastError();
   if(!::ChartSetInteger(this.ID(),CHART_COLOR_CHART_UP,colour))
     {
      CMessage::ToLog(DFUN,::GetLastError(),true);
      return false;
     }
   this.SetProperty(CHART_PROP_COLOR_CHART_UP,colour);
   if(redraw)
      ::ChartRedraw(this.ID());
   return true;
  }
//+-----------------------------------------------------------------------+
//|Set the color of down bar, its shadow and border of bearish candle body|
//+-----------------------------------------------------------------------+
bool CChartObj::SetColorDown(const color colour,const bool redraw=false)
  {
   ::ResetLastError();
   if(!::ChartSetInteger(this.ID(),CHART_COLOR_CHART_DOWN,colour))
     {
      CMessage::ToLog(DFUN,::GetLastError(),true);
      return false;
     }
   this.SetProperty(CHART_PROP_COLOR_CHART_DOWN,colour);
   if(redraw)
      ::ChartRedraw(this.ID());
   return true;
  }
//+------------------------------------------------------------------+
//| Set the color of the chart line and Doji candles                 |
//+------------------------------------------------------------------+
bool CChartObj::SetColorLine(const color colour,const bool redraw=false)
  {
   ::ResetLastError();
   if(!::ChartSetInteger(this.ID(),CHART_COLOR_CHART_LINE,colour))
     {
      CMessage::ToLog(DFUN,::GetLastError(),true);
      return false;
     }
   this.SetProperty(CHART_PROP_COLOR_CHART_LINE,colour);
   if(redraw)
      ::ChartRedraw(this.ID());
   return true;
  }
//+------------------------------------------------------------------+
//| Set the color of bullish candle body                             |
//+------------------------------------------------------------------+
bool CChartObj::SetColorCandleBull(const color colour,const bool redraw=false)
  {
   ::ResetLastError();
   if(!::ChartSetInteger(this.ID(),CHART_COLOR_CANDLE_BULL,colour))
     {
      CMessage::ToLog(DFUN,::GetLastError(),true);
      return false;
     }
   this.SetProperty(CHART_PROP_COLOR_CANDLE_BULL,colour);
   if(redraw)
      ::ChartRedraw(this.ID());
   return true;
  }
//+------------------------------------------------------------------+
//| Set the color of bearish candle body                             |
//+------------------------------------------------------------------+
bool CChartObj::SetColorCandleBear(const color colour,const bool redraw=false)
  {
   ::ResetLastError();
   if(!::ChartSetInteger(this.ID(),CHART_COLOR_CANDLE_BEAR,colour))
     {
      CMessage::ToLog(DFUN,::GetLastError(),true);
      return false;
     }
   this.SetProperty(CHART_PROP_COLOR_CANDLE_BEAR,colour);
   if(redraw)
      ::ChartRedraw(this.ID());
   return true;
  }
//+------------------------------------------------------------------+
//| Set the Bid price line color                                     |
//+------------------------------------------------------------------+
bool CChartObj::SetColorBid(const color colour,const bool redraw=false)
  {
   ::ResetLastError();
   if(!::ChartSetInteger(this.ID(),CHART_COLOR_BID,colour))
     {
      CMessage::ToLog(DFUN,::GetLastError(),true);
      return false;
     }
   this.SetProperty(CHART_PROP_COLOR_BID,colour);
   if(redraw)
      ::ChartRedraw(this.ID());
   return true;
  }
//+------------------------------------------------------------------+
//| Set the Ask price line color                                     |
//+------------------------------------------------------------------+
bool CChartObj::SetColorAsk(const color colour,const bool redraw=false)
  {
   ::ResetLastError();
   if(!::ChartSetInteger(this.ID(),CHART_COLOR_ASK,colour))
     {
      CMessage::ToLog(DFUN,::GetLastError(),true);
      return false;
     }
   this.SetProperty(CHART_PROP_COLOR_ASK,colour);
   if(redraw)
      ::ChartRedraw(this.ID());
   return true;
  }
//+------------------------------------------------------------------+
//|Set the color of the price line of the last performed deal (Last) |
//+------------------------------------------------------------------+
bool CChartObj::SetColorLast(const color colour,const bool redraw=false)
  {
   ::ResetLastError();
   if(!::ChartSetInteger(this.ID(),CHART_COLOR_LAST,colour))
     {
      CMessage::ToLog(DFUN,::GetLastError(),true);
      return false;
     }
   this.SetProperty(CHART_PROP_COLOR_LAST,colour);
   if(redraw)
      ::ChartRedraw(this.ID());
   return true;
  }
//+------------------------------------------------------------------+
//|Set the color of stop order levels (Stop Loss and Take Profit)    |
//+------------------------------------------------------------------+
bool CChartObj::SetColorStops(const color colour,const bool redraw=false)
  {
   ::ResetLastError();
   if(!::ChartSetInteger(this.ID(),CHART_COLOR_STOP_LEVEL,colour))
     {
      CMessage::ToLog(DFUN,::GetLastError(),true);
      return false;
     }
   this.SetProperty(CHART_PROP_COLOR_STOP_LEVEL,colour);
   if(redraw)
      ::ChartRedraw(this.ID());
   return true;
  }
//+------------------------------------------------------------------+
//| Set the left coordinate of the undocked chart                    |
//| relative to the virtual screen                                   |
//+------------------------------------------------------------------+
bool CChartObj::SetFloatLeft(const int value,const bool redraw=false)
  {
   ::ResetLastError();
   if(!::ChartSetInteger(this.ID(),CHART_FLOAT_LEFT,value))
     {
      CMessage::ToLog(DFUN,::GetLastError(),true);
      return false;
     }
   this.SetProperty(CHART_PROP_FLOAT_LEFT,value);
   if(redraw)
      ::ChartRedraw(this.ID());
   return true;
  }
//+------------------------------------------------------------------+
//| Set the top coordinate of the undocked chart                     |
//| relative to the virtual screen                                   |
//+------------------------------------------------------------------+
bool CChartObj::SetFloatTop(const int value,const bool redraw=false)
  {
   ::ResetLastError();
   if(!::ChartSetInteger(this.ID(),CHART_FLOAT_TOP,value))
     {
      CMessage::ToLog(DFUN,::GetLastError(),true);
      return false;
     }
   this.SetProperty(CHART_PROP_FLOAT_TOP,value);
   if(redraw)
      ::ChartRedraw(this.ID());
   return true;
  }
//+------------------------------------------------------------------+
//| Set the right coordinate of the undocked chart                   |
//| relative to the virtual screen                                   |
//+------------------------------------------------------------------+
bool CChartObj::SetFloatRight(const int value,const bool redraw=false)
  {
   ::ResetLastError();
   if(!::ChartSetInteger(this.ID(),CHART_FLOAT_RIGHT,value))
     {
      CMessage::ToLog(DFUN,::GetLastError(),true);
      return false;
     }
   this.SetProperty(CHART_PROP_FLOAT_RIGHT,value);
   if(redraw)
      ::ChartRedraw(this.ID());
   return true;
  }
//+------------------------------------------------------------------+
//| Set the bottom coordinate of the undocked chart                  |
//| relative to the virtual screen                                   |
//+------------------------------------------------------------------+
bool CChartObj::SetFloatBottom(const int value,const bool redraw=false)
  {
   ::ResetLastError();
   if(!::ChartSetInteger(this.ID(),CHART_FLOAT_BOTTOM,value))
     {
      CMessage::ToLog(DFUN,::GetLastError(),true);
      return false;
     }
   this.SetProperty(CHART_PROP_FLOAT_BOTTOM,value);
   if(redraw)
      ::ChartRedraw(this.ID());
   return true;
  }
//+------------------------------------------------------------------+
//| Sets the value of zeroth bar shift                               |
//| from the right edge in %                                         |
//+------------------------------------------------------------------+
bool CChartObj::SetShiftSize(const double value,const bool redraw=false)
  {
   double size=(value<10.0 ? 10.0 : value>50.0 ? 50.0 : value);
   ::ResetLastError();
   if(!::ChartSetDouble(this.ID(),CHART_SHIFT_SIZE,size))
     {
      CMessage::ToLog(DFUN,::GetLastError(),true);
      return false;
     }
   this.SetProperty(CHART_PROP_SHIFT_SIZE,size);
   if(redraw)
      ::ChartRedraw(this.ID());
   return true;
  }
//+------------------------------------------------------------------+
//| Set the location of the chart fixed position                     |
//| from the left edge in %                                          |
//+------------------------------------------------------------------+
bool CChartObj::SetFixedPosition(const double value,const bool redraw=false)
  {
   double pos=(value<0 ? 0 : value>100.0 ? 100.0 : value);
   ::ResetLastError();
   if(!::ChartSetDouble(this.ID(),CHART_FIXED_POSITION,pos))
     {
      CMessage::ToLog(DFUN,::GetLastError(),true);
      return false;
     }
   this.SetProperty(CHART_PROP_FIXED_POSITION,pos);
   if(redraw)
      ::ChartRedraw(this.ID());
   return true;
  }
//+------------------------------------------------------------------+
//| Set the fixed chart maximum                                      |
//+------------------------------------------------------------------+
bool CChartObj::SetFixedMaximum(const double value,const bool redraw=false)
  {
   ::ResetLastError();
   if(!::ChartSetDouble(this.ID(),CHART_FIXED_MAX,value))
     {
      CMessage::ToLog(DFUN,::GetLastError(),true);
      return false;
     }
   this.SetProperty(CHART_PROP_FIXED_MAX,value);
   if(redraw)
      ::ChartRedraw(this.ID());
   return true;
  }
//+------------------------------------------------------------------+
//| Set the fixed chart minimum                                      |
//+------------------------------------------------------------------+
bool CChartObj::SetFixedMinimum(const double value,const bool redraw=false)
  {
   ::ResetLastError();
   if(!::ChartSetDouble(this.ID(),CHART_FIXED_MIN,value))
     {
      CMessage::ToLog(DFUN,::GetLastError(),true);
      return false;
     }
   this.SetProperty(CHART_PROP_FIXED_MIN,value);
   if(redraw)
      ::ChartRedraw(this.ID());
   return true;
  }
//+------------------------------------------------------------------+
//| Set the value of the scale in points per bar                     |
//+------------------------------------------------------------------+
bool CChartObj::SetPointsPerBar(const double value,const bool redraw=false)
  {
   ::ResetLastError();
   if(!::ChartSetDouble(this.ID(),CHART_POINTS_PER_BAR,value))
     {
      CMessage::ToLog(DFUN,::GetLastError(),true);
      return false;
     }
   this.SetProperty(CHART_PROP_POINTS_PER_BAR,value);
   if(redraw)
      ::ChartRedraw(this.ID());
   return true;
  }
//+------------------------------------------------------------------+
//| Set the comment on the chart                                     |
//+------------------------------------------------------------------+
bool CChartObj::SetComment(const string comment,const bool redraw=false)
  {
   ::ResetLastError();
   if(!::ChartSetString(this.ID(),CHART_COMMENT,comment))
     {
      CMessage::ToLog(DFUN,::GetLastError(),true);
      return false;
     }
   this.SetProperty(CHART_PROP_COMMENT,comment);
   if(redraw)
      ::ChartRedraw(this.ID());
   return true;
  }
//+------------------------------------------------------------------+
//| Set the height of the specified chart in pixels                  |
//+------------------------------------------------------------------+
bool CChartObj::SetWindowHeightInPixels(const int height,const int sub_window,const bool redraw=false)
  {
   ::ResetLastError();
   if(!::ChartSetInteger(this.ID(),CHART_HEIGHT_IN_PIXELS,sub_window,height))
     {
      CMessage::ToLog(DFUN,::GetLastError(),true);
      return false;
     }
   if(redraw)
      ::ChartRedraw(this.ID());
   return true;
  }
//+------------------------------------------------------------------+
//| Set the chart symbol                                             |
//+------------------------------------------------------------------+
bool CChartObj::SetSymbol(const string symbol)
  {
   ::ResetLastError();
   if(!::ChartSetSymbolPeriod(this.ID(),symbol,this.Timeframe()))
     {
      CMessage::ToLog(DFUN,::GetLastError(),true);
      return false;
     }
   this.SetProperty(CHART_PROP_SYMBOL,symbol);
   this.m_digits=(int)::SymbolInfoInteger(this.Symbol(),SYMBOL_DIGITS);
   return true;
  }
//+------------------------------------------------------------------+
//| Set the chart period                                             |
//+------------------------------------------------------------------+
bool CChartObj::SetTimeframe(const ENUM_TIMEFRAMES timeframe)
  {
   ::ResetLastError();
   if(!::ChartSetSymbolPeriod(this.ID(),this.Symbol(),timeframe))
     {
      CMessage::ToLog(DFUN,::GetLastError(),true);
      return false;
     }
   this.SetProperty(CHART_PROP_TIMEFRAME,timeframe);
   return true;
  }
//+------------------------------------------------------------------+
Los métodos son idénticos a los métodos privados analizados anteriormente y tienen la misma lógica, así que el lector podrá estudiarlos por su cuenta. En cualquier caso, siempre podrá escribir cualquier duda en los comentarios al artículo.
Con esto, damos por finalizada la creación del objeto de gráfico. Encontrará su listado completo en los archivos de la biblioteca adjuntos al artículo.
Simulación
Para la prueba, tomaremos el asesor del artículo anterior
y lo guardaremos en la nueva carpeta \MQL5\Experts\TestDoEasy\Part67\ con el nuevo nombre TestDoEasyPart67.mq5.
Hacemos eso... Abrimos tres gráficos de diferentes instrumentos: en el primero funcionará el asesor, mietras que los dos otros simplemente estarán abiertos. En el primer inicio, el asesor leerá todos los gráficos, creará los objetos de gráfico correspondientes, los añadirá a la lista creada temporalmente para la prueba y luego leerá la lista creada y mostrará las descripciones breves de los objetos de gráfico ubicados en ella. Para el primer gráfico (en el que opera el asesor experto), mostraremos una descripción completa del objeto de gráfico.
Como las clases de las señales ahora están conectadas a través del objeto principal de la biblioteca CEngine, entonces,
en lugar de la línea para conectar la clase de objeto de señal mql5
//|                                             TestDoEasyPart66.mq5 |
//|                        Copyright 2021, MetaQuotes Software Corp. |
//|                             https://mql5.com/en/users/artmedia70 |
//+------------------------------------------------------------------+
#property copyright "Copyright 2021, MetaQuotes Software Corp."
#property link      "https://mql5.com/en/users/artmedia70"
#property version   "1.00"
//--- includes
#include <DoEasy\Engine.mqh>
#include <DoEasy\Objects\MQLSignalBase\MQLSignal.mqh>
//--- enums
incluiremos el archivo de la clase de objeto de gráfico:
//|                                             TestDoEasyPart67.mq5 |
//|                        Copyright 2021, MetaQuotes Software Corp. |
//|                             https://mql5.com/en/users/artmedia70 |
//+------------------------------------------------------------------+
#property copyright "Copyright 2021, MetaQuotes Software Corp."
#property link      "https://mql5.com/en/users/artmedia70"
#property version   "1.00"
//--- includes
#include <DoEasy\Engine.mqh>
#include <DoEasy\Objects\Chart\ChartObj.mqh>
//--- enums
En el manejador OnTick(), en lugar del bloque de código para trabajar con las señales
//--- Search for available signals in the database and check the ability to subscribe to a signal by its name
   static bool done=false;
   //--- If the first launch and working with signals is enabled in EA custom settings
   if(InpUseMqlSignals && !done)
     {
      //--- Display the list of all free signals in the journal
      Print("");
      engine.GetSignalsMQL5Collection().PrintShort(true,false,true);
      //--- Get the list of free signals
      CArrayObj *list=engine.GetListSignalsMQL5Free();
      //--- If the list is obtained
      if(list!=NULL)
        {
         //--- Find a signal with the maximum growth in % in the list
         int index_max_gain=CSelect::FindMQLSignalMax(list,SIGNAL_MQL5_PROP_GAIN);
         CMQLSignal *signal_max_gain=list.At(index_max_gain);
         //--- If the signal is found
         if(signal_max_gain!=NULL)
           {
            //--- Display the full signal description in the journal
            signal_max_gain.Print();
            //--- If managed to subscribe to a signal
            if(engine.SignalsMQL5Subscribe(signal_max_gain.ID()))
              {
               //--- Set subscription parameters
               //--- Enable copying deals by subscription
               engine.SignalsMQL5CurrentSetSubscriptionEnableON();
               //--- Set synchronization without the confirmation dialog
               engine.SignalsMQL5CurrentSetConfirmationsDisableOFF();
               //--- Set copying Stop Loss and Take Profit
               engine.SignalsMQL5CurrentSetSLTPCopyON();
               //--- Set the market order slippage used when synchronizing positions and copying deals
               engine.SignalsMQL5CurrentSetSlippage(2);
               //--- Set the percentage for converting deal volume
               engine.SignalsMQL5CurrentSetEquityLimit(50);
               //--- Set deposit limitations (in %)
               engine.SignalsMQL5CurrentSetDepositPercent(70);
               //--- Display subscription parameters in the journal
               engine.SignalsMQL5CurrentSubscriptionParameters();
              }
           }
        }
      done=true;
      return;
     }
   //--- If a signal subscription is active,  unsubscribe
   if(engine.SignalsMQL5CurrentID()>0)
     {
      engine.SignalsMQL5Unsubscribe();
     }
//---
incluiremos el bloque de código para trabajar con los objetos de gráfico:
//+------------------------------------------------------------------+
//| Expert tick function                                             |
//+------------------------------------------------------------------+
void OnTick()
  {
//--- Handle the NewTick event in the library
   engine.OnTick(rates_data);

//--- If working in the tester
   if(MQLInfoInteger(MQL_TESTER))
     {
      engine.OnTimer(rates_data);   // Working in the timer
      PressButtonsControl();        // Button pressing control
      engine.EventsHandling();      // Working with events
     }

//--- If the trailing flag is set
   if(trailing_on)
     {
      TrailingPositions();          // Trailing positions
      TrailingOrders();             // Trailing pending orders
     }

//--- If it is the first launch
   static bool done=false;
   if(!done)
     {
      //--- Create the list object for storing chart objects
      CArrayObj *list=new CArrayObj();
      if(list==NULL)
         return;
      //--- Declare the variables and get the first chart ID
      long currChart,prevChart=ChartFirst();
      int i=0;
      //--- Create the chart object and add it to the list
      CChartObj *chart_first=new CChartObj(prevChart);
      list.Add(chart_first);
      //--- In the loop by the total number of terminal charts (not more than 100)
      while(i<CHARTS_MAX)
        {
         //--- based on the previous one, get the new chart
         currChart=ChartNext(prevChart);
         //--- When reaching the end of the chart list, complete the loop
         if(currChart<0) break;
         //--- Create the chart object based on the current chart ID in the loop and add it to the list
         CChartObj *chart=new CChartObj(currChart);
         list.Add(chart);
         //--- remember the current chart ID for ChartNext() and increase the loop counter
         prevChart=currChart;
         i++;
        }
      Print("");
      //--- From the filled list in the loop, receive the next chart object and display its short description
      int total=list.Total();
      for(int j=0;j<total;j++)
        {
         CChartObj *chart_obj=list.At(j);
         chart_obj.PrintShort();
        }
      Print("");
      //--- Display the full description of the very first chart
      chart_first=list.At(0);
      chart_first.Print();
      //--- Destroy the list of chart objects
      delete list;
      done=true;
     }
//---
  }
//+------------------------------------------------------------------+
La lógica al completo se describe con detalle en el código, por lo que no requerirá de explicaciones adicionales. En cualquier caso, podrán escribir cualquier duda en los comentarios al artículo.
Esto es todo lo que queríamos hacer hoy.
Compilamos el asesor, abrimos los tres gráficos en el terminal e iniciamos el asesor en el primero de ellos, especificando previamente en los parámetros "trabajar solo con el símbolo y el marco temporal actuales":
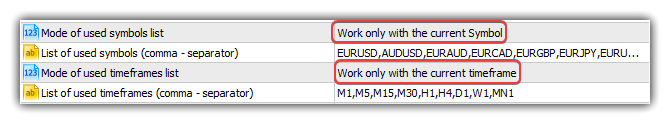
Cuando llegue el primer tick, el asesor creará tres objetos de gráfico y los mostrará en el diario, además de los mensajes correspondientes sobre la inicialización de varias clases de la biblioteca y las descripciones breves de los tres objetos de gráfico creados:
Chart window EURUSD H4 ID: 131733844391938630, HWND: 918600
Chart window AUDUSD H1 ID: 131733844391938632, HWND: 1182638
Chart window GBPUSD H4 ID: 131733844391938633, HWND: 1705036
A continuación, mostrará la descripción completa de todas las propiedades del objeto de gráfico que describe el primer gráfico del terminal:
============= The beginning of the parameter list (Chart window EURUSD H4) =============
Chart ID: 131733844391938630
Timeframe: H4
Drawing attributes of a price chart: Yes
Object "Chart": No
Chart on top of other charts: No
Accessing the context menu by pressing the right mouse button: Yes
Accessing the "Crosshair tool" by pressing the middle mouse button: Yes
Scrolling the chart horizontally using the left mouse button: Yes
Sending messages about mouse wheel events to all mql5 programs on a chart: No
Send notifications of mouse move and mouse click events to all mql5 programs on a chart: No
Send a notification of an event of new object creation to all mql5-programs on a chart: No
Send a notification of an event of object deletion to all mql5-programs on a chart: No
Chart type: Display as Japanese candlesticks
Price chart in the foreground: No
Price chart indent from the right border: Yes
Automatic moving to the right border of the chart: Yes
Managing the chart using a keyboard: Yes
Allowed to intercept Space and Enter key presses on the chart to activate the quick navigation bar: Yes
Scale: 2
Fixed scale mode: No
Scale 1:1 mode: No
Scale to be specified in points per bar: No
Display a symbol ticker in the upper left corner: Yes
Display OHLC values in the upper left corner: Yes
Display Bid values as a horizontal line in a chart: Yes
Display Ask values as a horizontal line in a chart: Yes
Display Last values as a horizontal line in a chart: No
Display vertical separators between adjacent periods: No
Display grid in the chart: No
Display volume in the chart: Tick volumes
Display textual descriptions of objects: Yes
The number of bars on the chart that can be displayed: 96
The total number of chart windows, including indicator subwindows: 1
Chart window handle: 918600
Number of the first visible bar in the chart: 95
Chart width in bars: 117
Chart width in pixels: 466
Chart background color: clrWhite
Color of axes, scales and OHLC line: clrBlack
Grid color: clrSilver
Color of volumes and position opening levels: clrGreen
Color for the up bar, shadows and body borders of bull candlesticks: clrBlack
Color for the down bar, shadows and body borders of bear candlesticks: clrBlack
Line chart color and color of "Doji" Japanese candlesticks: clrBlack
Body color of a bull candlestick: clrWhite
Body color of a bear candlestick: clrBlack
Bid price level color: clrLightSkyBlue
Ask price level color: clrCoral
Line color of the last executed deal price (Last): clrSilver
Color of stop order levels (Stop Loss and Take Profit): clrOrangeRed
Displaying trade levels in the chart (levels of open positions, Stop Loss, Take Profit and pending orders): Yes
Permission to drag trading levels on a chart with a mouse: Yes
Showing the time scale on a chart: Yes
Showing the price scale on a chart: Yes
Showing the "One click trading" panel on a chart: No
Chart window is maximized: No
Chart window is minimized: No
The chart window is docked: Yes
The left coordinate of the undocked chart window relative to the virtual screen: 0
The top coordinate of the undocked chart window relative to the virtual screen: 0
The right coordinate of the undocked chart window relative to the virtual screen: 0
The bottom coordinate of the undocked chart window relative to the virtual screen: 0
------
The size of the zero bar indent from the right border in percents: 18.63
Chart fixed position from the left border in percent value: 0.00
Fixed  chart maximum: 1.22650
Fixed  chart minimum : 1.17770
Scale in points per bar: 1.00
Chart minimum: 1.17770
Chart maximum: 1.22650
------
Text of a comment in a chart: ""
The name of the Expert Advisor running on the chart: "TestDoEasyPart67"
The name of the script running on the chart: ""
Symbol: "EURUSD"
============= End of the parameter list (Chart window EURUSD H4) =============
¿Qué es lo próximo?
En el próximo artículo, ampliaremos las capacidades del objeto de gráfico creando objetos de subventana para él, y también crearemos una colección de objetos de gráfico.
Más abajo se adjuntan todos los archivos de la versión actual de la biblioteca y el archivo del asesor de prueba para MQL5. Puede descargarlo todo y ponerlo a prueba por sí mismo.
Querríamos señalar que no resulta recomendable usar los objetos de gráfico en desarrollos propios en su estado actual, debido a los cambios adicionales que sufrirán más adelante.
Si tiene preguntas, observaciones o sugerencias, podrá concretarlas en los comentarios al artículo.
*Artículos de esta serie:
Trabajando con los precios en la biblioteca DoEasy (Parte 62): Actualización de las series de tick en tiempo real, preparando para trabajar con la Profundidad del mercado
Trabajando con los precios en la biblioteca DoEasy (Parte 63): Profundidad del mercado, clase de orden abstracta de la Profundidad del mercado
Trabajando con los precios en la biblioteca DoEasy (Parte 64): Profundidad del mercado, clases del objeto de instantánea y del objeto de serie de instantáneas del DOM
Trabajando con los precios y Señales en la biblioteca DoEasy (Parte 65): Colección de la profundidad de mercado y clase para trabajar con las Señales MQL5.com
Otras clases en la biblioteca DoEasy (Parte 66): Clases de Colección de Señales MQL5.com
Traducción del ruso hecha por MetaQuotes Ltd.
Artículo original: https://www.mql5.com/ru/articles/9213
Advertencia: todos los derechos de estos materiales pertenecen a MetaQuotes Ltd. Queda totalmente prohibido el copiado total o parcial.
Este artículo ha sido escrito por un usuario del sitio web y refleja su punto de vista personal. MetaQuotes Ltd. no se responsabiliza de la exactitud de la información ofrecida, ni de las posibles consecuencias del uso de las soluciones, estrategias o recomendaciones descritas.


 Plantilla para proyectar el MVC y posibilidades de uso
 Redes neuronales: así de sencillo (Parte 13): Normalización por lotes (Batch Normalization)
- Aplicaciones de trading gratuitas
- 8 000+ señales para copiar
- Noticias económicas para analizar los mercados financieros
Usted acepta la política del sitio web y las condiciones de uso