Back to Economic Data
- Utilities
- Version: 1.0
- Activations: 10

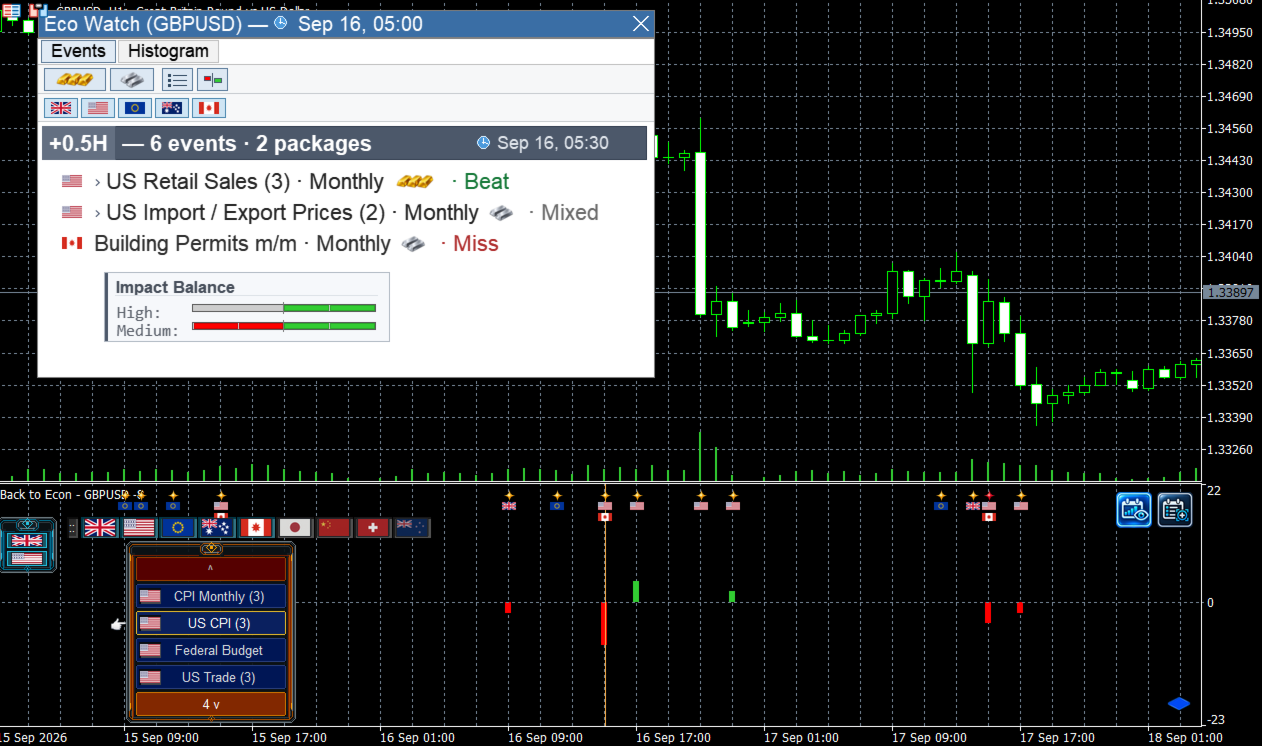
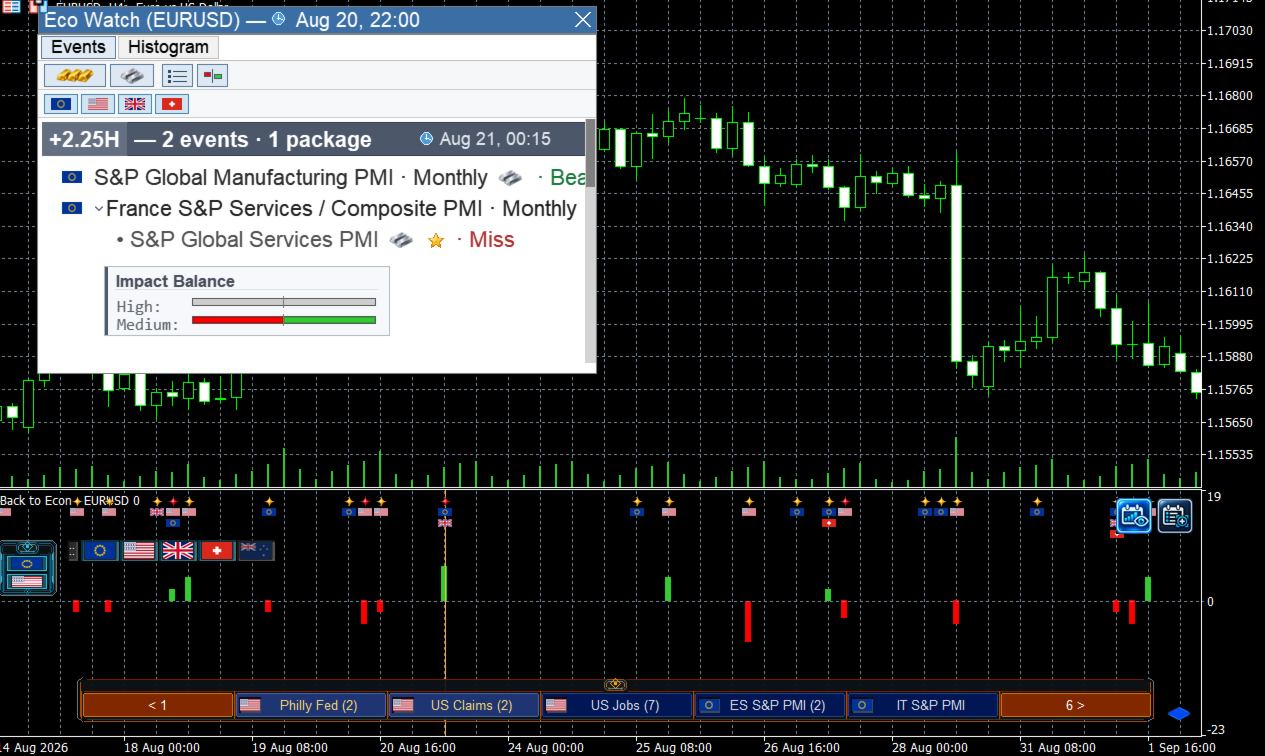
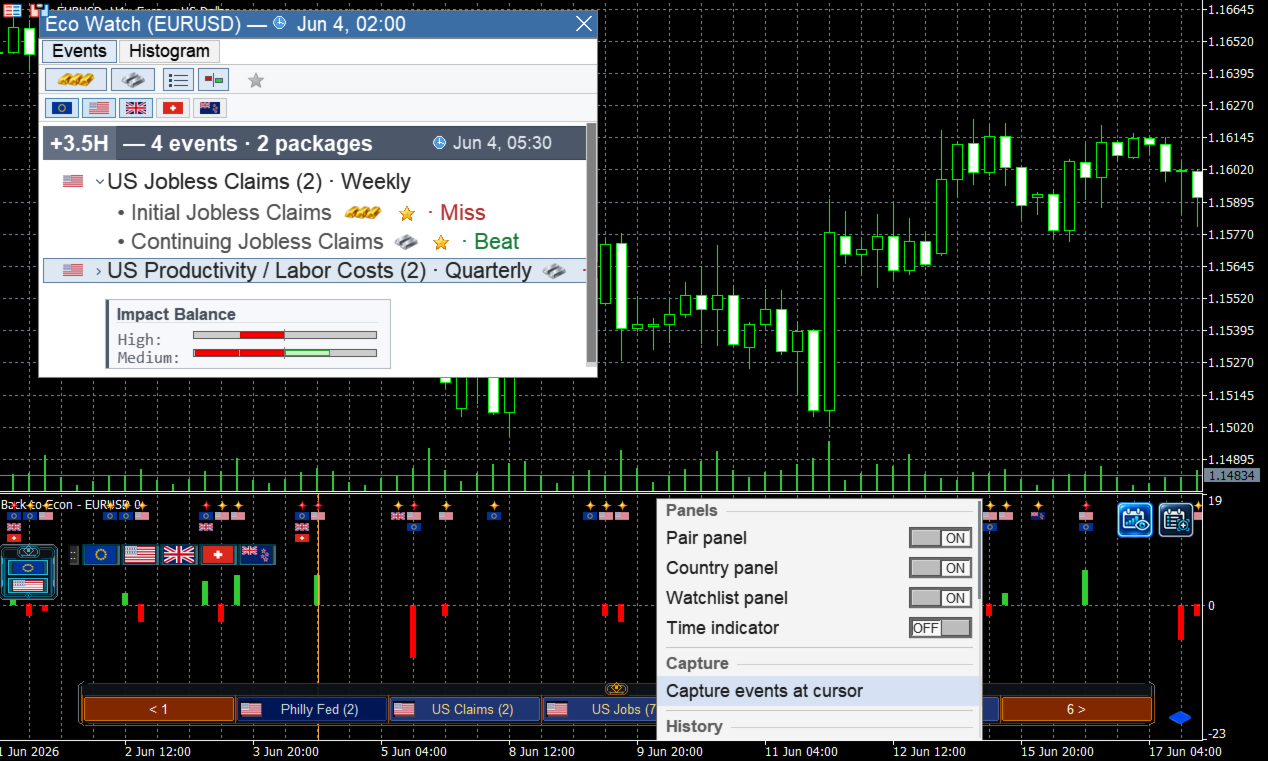
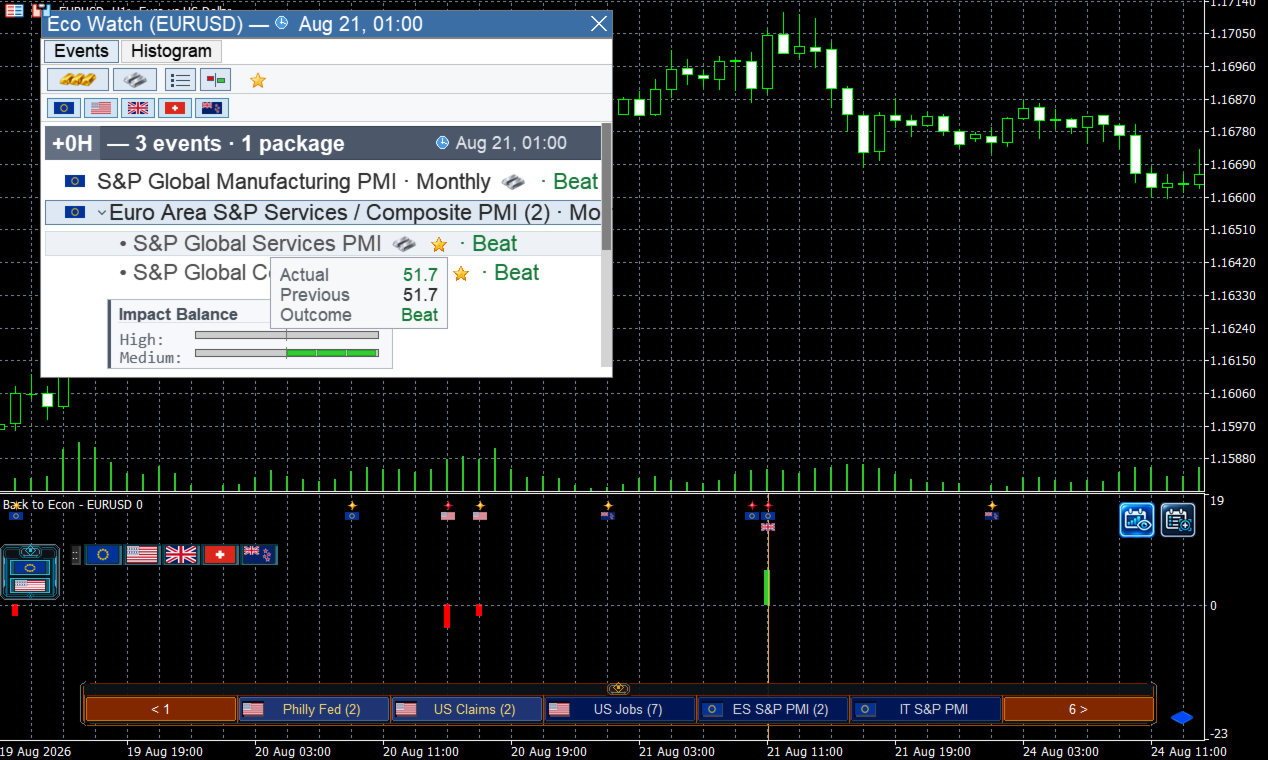
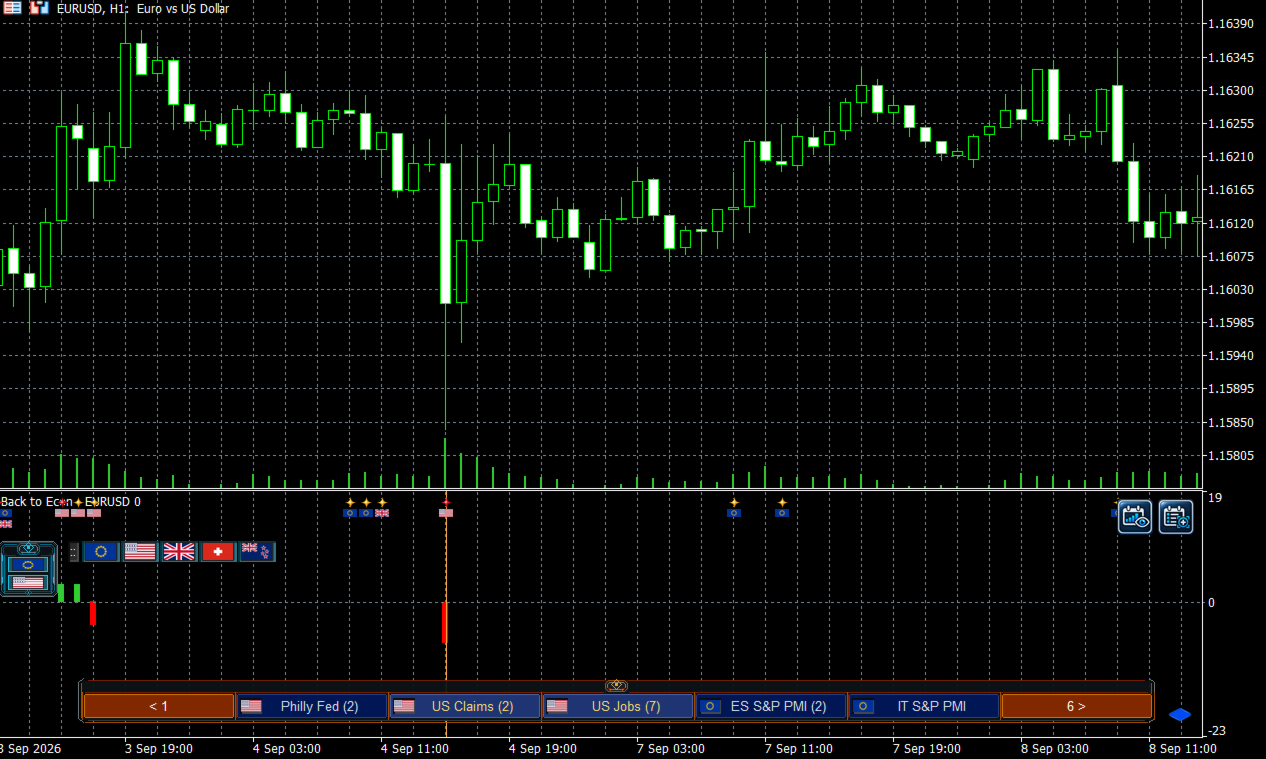
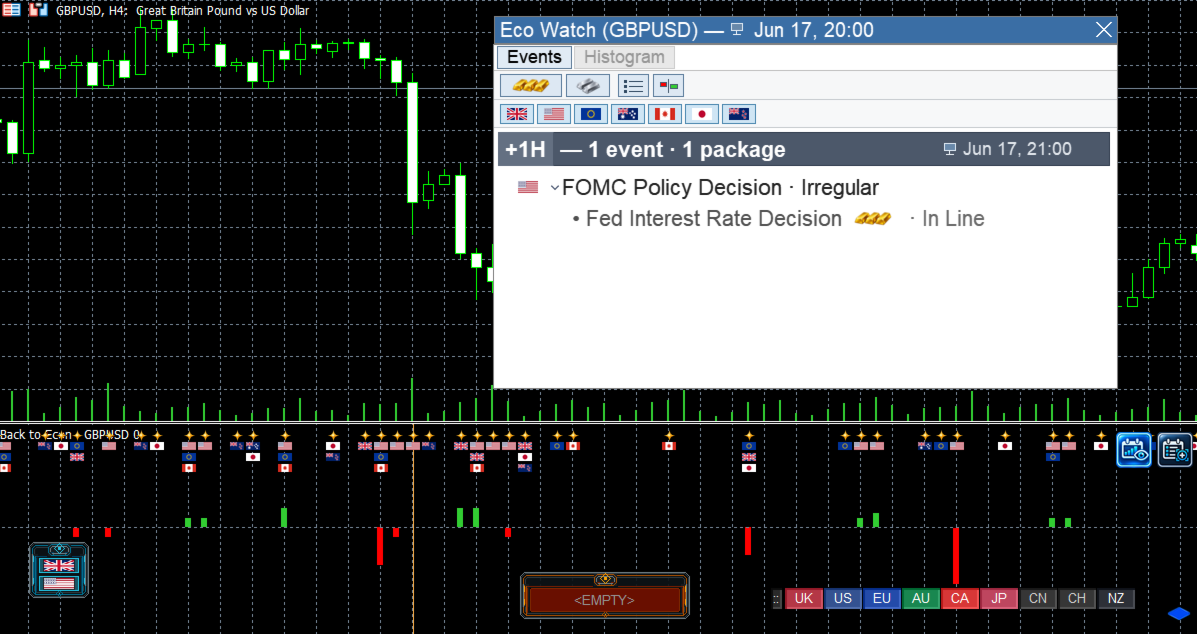
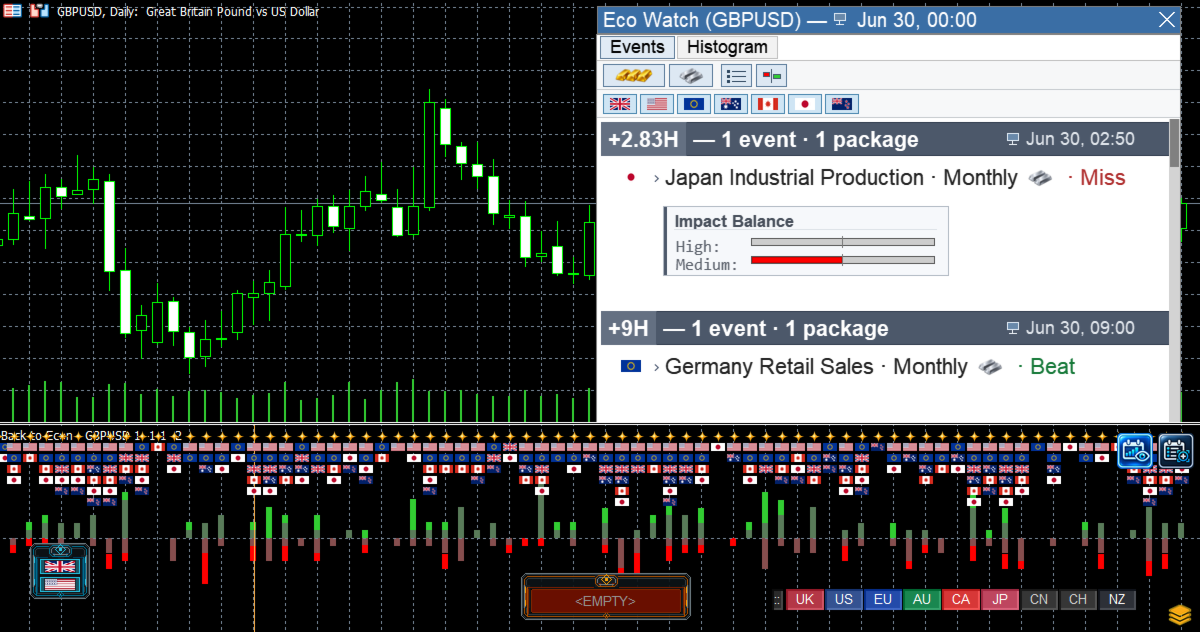
This product allows you to view past economic releases on the same chart as your candlesticks.
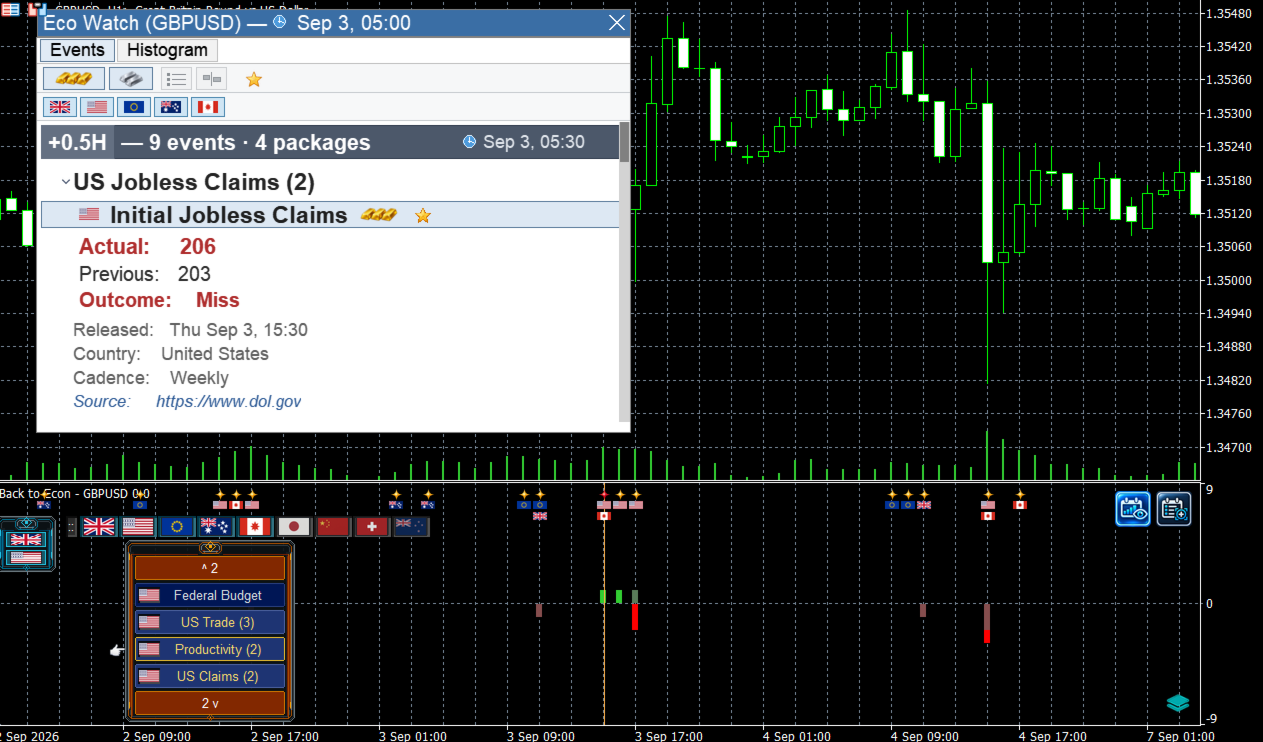
This can be useful for studying what happened relative to consensus expectations, including whether the data beat, missed, or came in line with expectations.
It also comes with an economic indicator shown through the histogram. Its purpose is to help you quickly understand the overall outcome of the economic data at that time. The histogram comes with three different viewing modes, ranging from a simple overall view to a more detailed breakdown.
The Eco Watch window presents the economic data in a way that helps you understand the main idea of what happened without unnecessary clutter.
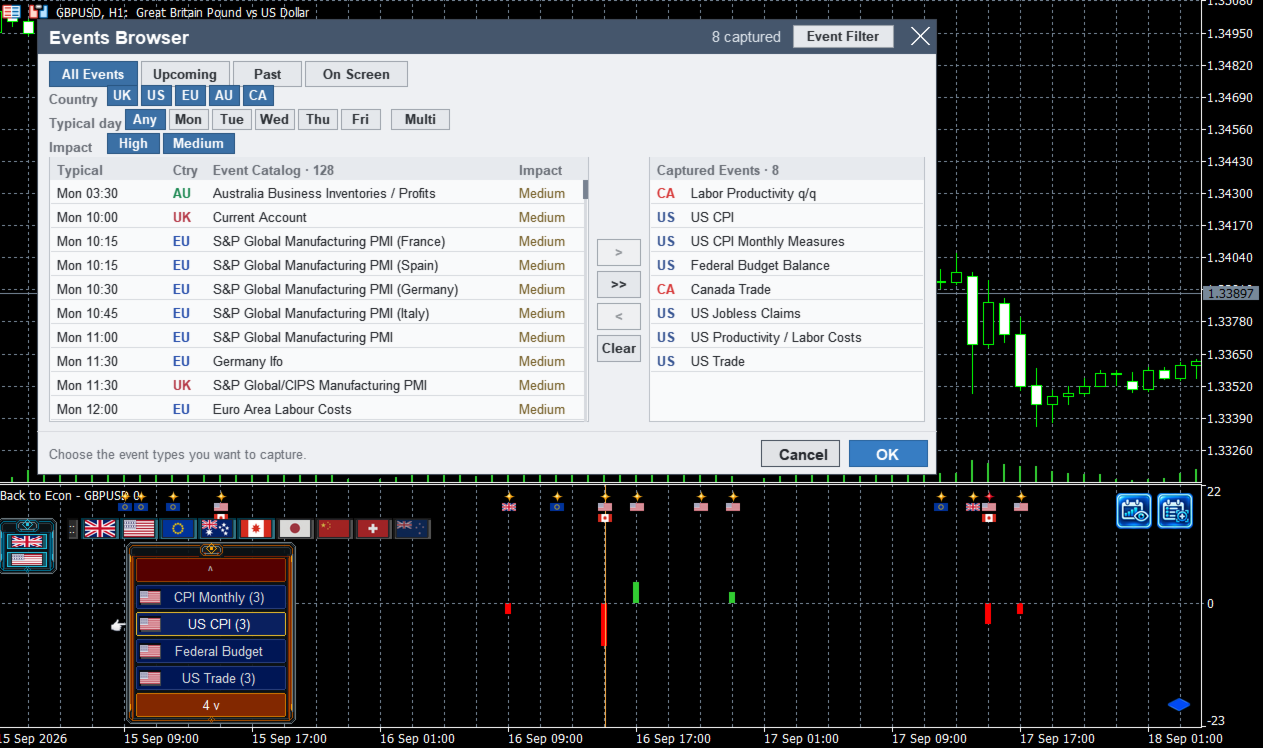
This product has been designed specifically with traders in mind. It filters out low-importance events by default and works with nine major economies and currency regions: the United States, Eurozone, United Kingdom, Japan, Switzerland, Canada, Australia, New Zealand, and China.
You can go back and study price action relative to economic releases for roughly 20 years, depending on the available historical data.
Please note that the demo does not work properly in the Strategy Tester and is not representative of the full paid product.