Garman Klass Volatility
- Indicators
- Version: 1.0
- Activations: 5

# Garman Klass Volatility - An estimator using the whole OHLC
*Category: Volatility | Difficulty: advanced | Window: separate window below the chart | Markets: Universal (Forex, indices, commodities, crypto, stocks) | Suggested timeframes: M15, M30, H1, H4, D1*
## Short description
> A volatility estimator using open, high, low and close instead of closes only. Its ratio to the classic estimate separates intra-bar movement from close-to-close movement.
### Overview
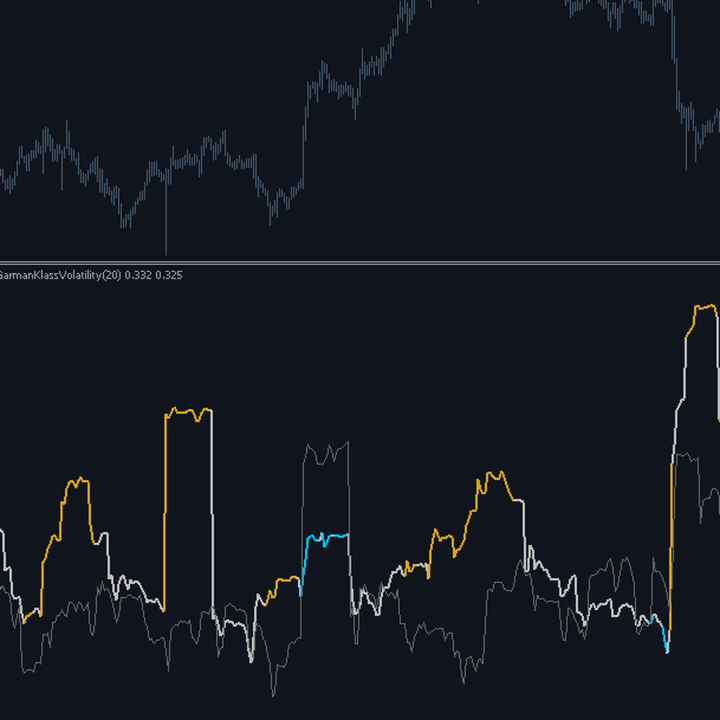
The standard deviation of closes throws away three quarters of the available data: of every bar it uses only the close and ignores open, high and low, which were nonetheless observed. The estimator proposed by Garman and Klass uses all four and, for the same window, produces a volatility estimate with far lower error. In practice twenty bars of the OHLC estimator carry roughly the same information as one hundred bars of the close based one. The indicator draws both estimates, and their ratio is informative in itself: when the OHLC estimate is clearly higher, the market moves a lot inside bars and then comes back, typical of agitated sideways phases; when it is lower, movement concentrates between one close and the next, the signature of a trending market or one with frequent gaps.
### How the calculation works
1. For every bar the logarithm of the high to low ratio and of the close to open ratio are computed.
2. The variance contribution is half the square of the first, minus a constant equal to twice the logarithm of two minus one, times the square of the second.
3. That constant is computed once at initialisation rather than on every bar.
4. The estimator can produce negative contributions on individual anomalous bars: these are zeroed so the sum cannot turn negative.
5. The average of the contributions over the window, square rooted, is the volatility estimate as a percentage per bar.
6. In parallel the standard deviation of close to close returns is computed over the same window, for comparison.
### How to use it
- Use the OHLC estimate in place of standard deviation wherever a volatility measure is needed: it is more precise for the same data.
- The gold line flags an agitated market: much movement inside bars that does not translate into progress between closes.
- The blue line flags a market where movement happens between closes: a clean trend or frequent gaps.
- The ratio between the two estimates is an excellent filter for scalpers, who live off intra-bar movement.
- On short windows the greater efficiency of the OHLC estimator is more evident: that is where the advantage shows.
### Who it is for and on which timeframes
It targets system builders who want a more precise volatility measure to base stops, sizing and filters on. Reading the ratio between the two estimates also interests discretionary traders, because it separates two situations that look alike on the chart. It works from M15 to D1. It should be avoided on instruments with unreliable highs and lows, such as some index CFDs where the wicks are generated by the broker feed rather than by real trades.
### Practical example of reading a signal
On DAX40 M30 the OHLC estimate sits steadily forty per cent above the close based one and the line is gold. The chart shows candles with very long wicks and small bodies: price covers a lot of ground within each half hour but always closes near where it opened. It is the ideal context for range traders and a terrible one for breakout buyers, because every extension fades. The next day the ratio falls below eighty per cent and the line turns blue: candles now have full bodies and short wicks. The same instrument now demands the opposite approach, and all that changed is how movement distributes inside the bars.
## Input parameters
| Parameter | Default | Description |
|---|---|---|
| `InpPeriod` | 20 | Estimation window in bars. Thanks to the estimator higher efficiency, short windows stay usable where close based ones would be too noisy. |
| `InpChopRatio` | 1.30 | Ratio between the two estimates beyond which the market is classified as agitated, with much intra-bar movement. |
| `InpTrendRatio` | 0.80 | Ratio below which movement is classified as concentrated between closes, typical of clean trends or gaps. |
## Advantages / strengths
- It uses four prices per bar instead of one: for the same window the estimate has far lower error.
- It allows short windows without the estimate becoming unusable through noise.
- The ratio with the classic estimate adds qualitative information about the type of movement, not just its size.
- No repaint and explicit handling of the negative contributions the estimator can produce.
## Limitations and warnings
- It implicitly assumes no gaps between bars: with frequent gaps it underestimates real volatility.
- It depends on the quality of highs and lows provided by the broker, which on some CFDs do not correspond to real trades.
- The formula is not intuitive and those unfamiliar with it struggle to understand why the two values differ.
- The two ratio classification thresholds are empirical values, to be verified on your own instrument.
**No repaint:** values printed on a closed bar are never modified afterwards.
**Disclaimer.** This product is a technical analysis tool, not an automated trading system, and it offers no profit guarantee whatsoever. Financial markets carry the risk of total loss of the invested capital. Past performance is not indicative of future results. Every signal must be confirmed with your own analysis, a money management plan and prior testing on a demo account. The author is not responsible for trading decisions taken on the basis of this indicator.
## Suggested tags / keywords for MQL5
`volatility`, `garman klass`, `ohlc`, `estimator`, `efficiency`, `range`, `no repaint`, `quantitative`