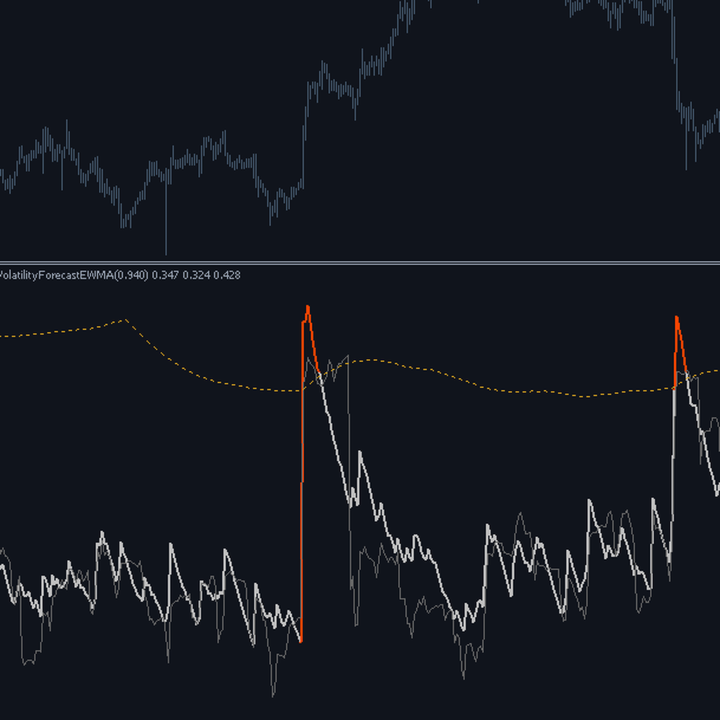
Volatility Forecast EWMA
- Indicators
- Version: 1.0
- Activations: 5

# Volatility Forecast EWMA - Forecasting the next bar
*Category: Volatility | Difficulty: advanced | Window: separate window below the chart | Markets: Universal (Forex, indices, commodities, crypto, stocks) | Suggested timeframes: M15, M30, H1, H4, D1*
## Short description
> Estimates next bar volatility with an EWMA model on variance, the same scheme used in portfolio risk management, alongside the volatility actually observed.
### Overview
Every volatility indicator looks backwards and measures how much the market has moved. This one looks forward and estimates how much it will move on the next bar. The model is the exponentially weighted moving average of variance: forecast variance is a combination of yesterday forecast and the square of today observed return, weighted by the decay factor lambda. A high lambda gives the model long memory and slow reaction to shocks, a low one makes it responsive but nervous. Alongside the forecast, the volatility actually realized over the recent window is drawn: comparing the two lines visually lets you judge within seconds how reliable the model is on that particular instrument, information no theoretical documentation can provide.
### How the calculation works
1. The logarithmic return of every bar is computed versus the previous close.
2. Forecast variance updates recursively: lambda times the previous variance plus one minus lambda times the square of the observed return.
3. The volatility forecast is the square root of that variance, expressed as a percentage per bar.
4. The initial seed is the sample variance of the first available bars, so the recursion starts from a sensible value.
5. The comparison realized volatility is computed backwards over the InpRealizedWin window, with the same method as any classic measure.
6. The alert threshold is a multiple of the long term average forecast, so it adapts automatically to the instrument.
### How to use it
- Use the forecast to size the position before opening it, instead of adjusting after volatility has already changed.
- Compare the forecast line with the realized one: if they overlap well the model is reliable on that instrument.
- A forecast exceeding the gold threshold indicates expected high volatility conditions: the moment to widen stops or reduce exposure.
- Lower lambda on markets that change regime quickly, raise it on those with persistent volatility.
- A forecast in the blue zone signals expected compression: a context suited to range strategies, not to immediate breakouts.
### Who it is for and on which timeframes
It targets traders managing risk quantitatively who want to size positions on expected rather than past volatility. It works from M15 to D1. The lambda value of 0.94 is the classic RiskMetrics figure for daily data: on intraday timeframes lowering it is advisable. Traders unfamiliar with volatility models can still use it by reading the colour alone, but they will miss the most interesting part, the assessment of model quality through the comparison of the two lines.
### Practical example of reading a signal
On NASDAQ100 H1 the forecast sits steadily around 0.18 per cent and realized volatility follows it closely: the model describes this market well. A macro release produces a bar six times the normal size. Forecast variance absorbs that enormous square and the forecast line jumps to 0.55, exceeding the alert threshold. There is no need to wait for realized volatility, computed over twenty bars, to update slowly: the forecast says immediately that the next bar will likely be very wide. A trader opening a position at that moment cuts size by two thirds. Over the following sessions the forecast gradually decays back towards normal.
## Input parameters
| Parameter | Default | Description |
|---|---|---|
| `InpLambda` | 0.94 | Model decay factor. High values give long memory and slow reaction, low ones responsiveness and nervousness. The classic value for daily data is 0.94. |
| `InpRealizedWin` | 20 | Window of the realized volatility drawn for comparison. It does not affect the forecast, it only serves to evaluate it. |
| `InpBaselineWin` | 250 | Window of the long term average forecast, from which the alert threshold is derived. |
| `InpAlertMult` | 1.50 | Multiplier applied to the long term average to obtain the threshold. With 1.50 an expected volatility half again above normal is flagged. |
## Advantages / strengths
- It looks forward rather than backward: it lets you adjust risk before volatility changes, not after.
- The visual comparison between forecast and realized lets you judge model quality on your own instrument.
- Extremely light recursive update: a single product and a sum per bar.
- The alert threshold is relative to the instrument history, not an arbitrary absolute value.
## Limitations and warnings
- The model reacts to shocks but does not anticipate them: unexpected news catches it as unprepared as any other indicator.
- A single anomalous return carries substantial immediate weight, so the forecast can overestimate for several bars after an isolated event.
- Being recursive, the value depends on the whole loaded history: the first bars after changing chart depth differ slightly.
- The model assumes zero mean variance: on series with pronounced drift the estimate is slightly biased upwards.
**No repaint:** values printed on a closed bar are never modified afterwards.
**Disclaimer.** This product is a technical analysis tool, not an automated trading system, and it offers no profit guarantee whatsoever. Financial markets carry the risk of total loss of the invested capital. Past performance is not indicative of future results. Every signal must be confirmed with your own analysis, a money management plan and prior testing on a demo account. The author is not responsible for trading decisions taken on the basis of this indicator.
## Suggested tags / keywords for MQL5
`volatility`, `forecast`, `ewma`, `risk management`, `riskmetrics`, `position sizing`, `no repaint`, `quantitative`