Kalman Trend Filter
- Indicators
- Version: 1.0
- Activations: 5

# Kalman Trend Filter - Level and velocity Kalman filter
*Category: Trend | Difficulty: advanced | Window: chart window (overlaid on price) | Markets: Universal (Forex, indices, commodities, crypto, stocks) | Suggested timeframes: M15, M30, H1, H4, D1*
## Short description
> A two state Kalman filter that simultaneously estimates price level and velocity. The gain self-adjusts: it trusts the model when data are consistent and re-adapts immediately to shocks.
### Overview
The Kalman filter is the standard tool for estimating the state of a system observed through noisy measurements, which is exactly the situation of anyone looking at a chart. This implementation models price with two states: a level and a slowly changing velocity. On every bar the filter first predicts where price should be by extending the estimated velocity, then compares the prediction with the actual close and corrects both states in proportion to its own uncertainty. The practical consequence is that lag is not fixed as in a moving average: when observations confirm the model the filter trusts it and stays smooth, when an unexpected move arrives the prediction error is large and the correction is immediate.
### How the calculation works
1. The state consists of level and velocity, with a symmetric covariance matrix representing their uncertainty.
2. In the prediction step the level advances by the current velocity and the uncertainty grows by the process noise.
3. Measurement noise and process noise are expressed not in points but in ATR multiples, so the tuning stays valid when the instrument or timeframe changes.
4. The Kalman gain is recomputed on every bar from the ratio between model uncertainty and measurement noise: this is the self-adjusting part.
5. The innovation, the difference between observed and predicted price, corrects level and velocity and reduces the uncertainty.
6. The dotted projection line shows where the level would end up on the next bar if the estimated velocity stayed unchanged.
### How to use it
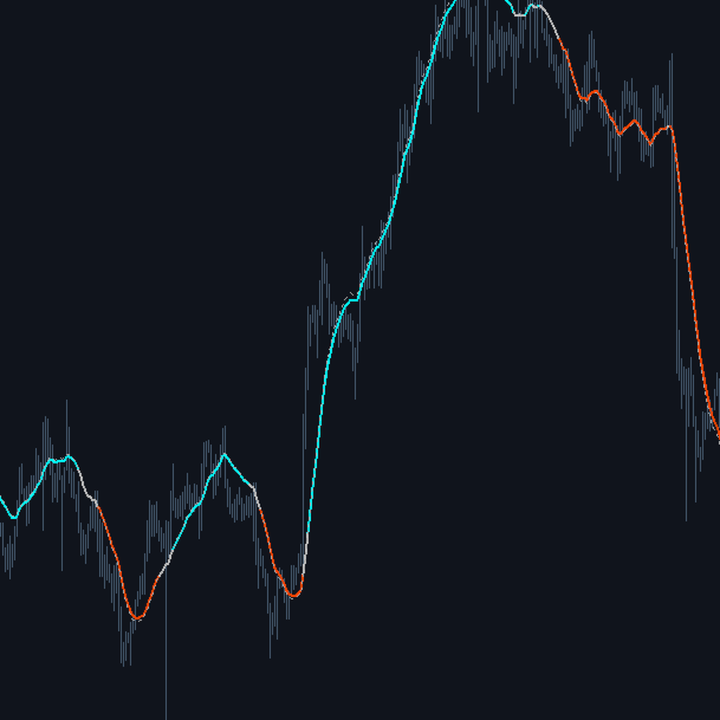
- Read the main line as an estimate of price stripped of noise: its colour gives the sign of the velocity, hence the structural direction.
- The distance between price and line is the recent innovation: an unusual distance means the market is doing something the model did not anticipate.
- The projection line next to price helps judge whether the forming bar is confirming or contradicting the estimated velocity.
- Raise InpMeasureNoise for a very smooth line to use as a background filter; lower it for a responsive line to use as a trailing reference.
- The colour change, corresponding to a reversal of the estimated velocity, is more reliable than a price to average crossover but still lags the absolute high or low.
### Who it is for and on which timeframes
It targets quantitatively minded traders and system developers who want a baseline of higher quality than a moving average and are willing to tune two noise parameters instead of one period. It works on any timeframe from M15 up. Anyone applying it without understanding it will find the defaults already sensible, but the real advantage emerges once the meaning of the ratio between the two noises is understood, since that ratio is the only thing that truly matters in the tuning.
### Practical example of reading a signal
On XAUUSD H1 price rises in an orderly fashion: the Kalman line is blue and hugs the closes, with the projection slightly above. A macro release hits and price loses the equivalent of four ATR in a single bar. The innovation is enormous, the filter gain rises and the line bends down on the very next bar, while a 50 period EMA would stay pointed up for another ten bars. The estimated velocity turns negative, the line goes orange and the projection moves below price: the model accepted the new regime instead of continuing to average the old one.
## Input parameters
| Parameter | Default | Description |
|---|---|---|
| `InpMeasureNoise` | 1.00 | How much noise we attribute to the observed price, in ATR multiples. Raising it makes the filter trust individual bars less, giving a smoother and slower line. |
| `InpProcessNoise` | 0.06 | How quickly we allow the true trend to change, in ATR multiples. Raising it makes the filter more responsive to shocks but also more nervous. |
| `InpAtrPeriod` | 50 | ATR window setting the scale of both noises. Keep it wide, since an unstable scale would also destabilise the gain. |
| `InpFlatFilter` | 0.02 | Minimum velocity in ATR per bar below which the line is drawn grey instead of directional. |
| `InpAppliedPrice` | PRICE_CLOSE | Price observed by the filter. PRICE_MEDIAN reduces the effect of long wicks on the estimates. |
## Advantages / strengths
- Lag is not constant: it shrinks automatically when the market does something unexpected, which is precisely when it matters.
- It explicitly estimates velocity, information no moving average provides and which makes the one bar projection possible.
- Parameters are expressed in ATR units, so a tuning found on one market stays reasonable on another.
- No repaint: the estimate on a closed bar is final and never revised by later bars.
## Limitations and warnings
- It has two counter-intuitive parameters: traders used to thinking in periods face an initial learning effort.
- Being recursive, the value depends on the whole loaded history, so the first bars after changing chart depth may differ slightly.
- The model assumes slowly varying velocity: in markets alternating sudden bursts and pauses, such as crypto over weekends, the estimate falls behind.
- The one bar projection is a linear extrapolation, not a forecast: it must not be read as an indication of future price.
**No repaint:** values printed on a closed bar are never modified afterwards.
**Disclaimer.** This product is a technical analysis tool, not an automated trading system, and it offers no profit guarantee whatsoever. Financial markets carry the risk of total loss of the invested capital. Past performance is not indicative of future results. Every signal must be confirmed with your own analysis, a money management plan and prior testing on a demo account. The author is not responsible for trading decisions taken on the basis of this indicator.
## Suggested tags / keywords for MQL5
`kalman`, `filter`, `trend`, `state space`, `smoothing`, `velocity`, `no repaint`, `quantitative`