Garman Klass Volatility

# Garman Klass Volatility - An estimator using the whole OHLC

*Category: Volatility | Difficulty: advanced | Window: separate window below the chart | Markets: Universal (Forex, indices, commodities, crypto, stocks) | Suggested timeframes: M15, M30, H1, H4, D1*

## Short description

> A volatility estimator using open, high, low and close instead of closes only. Its ratio to the classic estimate separates intra-bar movement from close-to-close movement.

### Overview

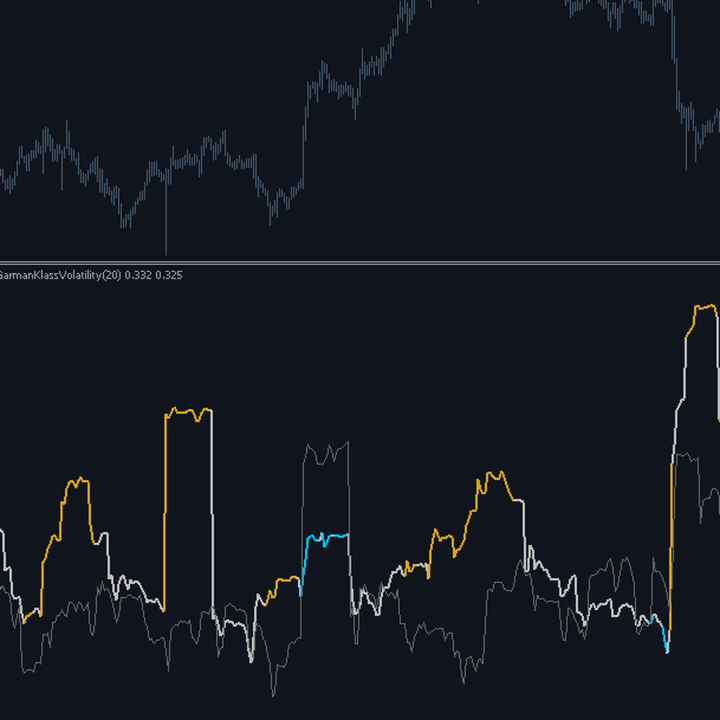
The standard deviation of closes throws away three quarters of the available data: of every bar it uses only the close and ignores open, high and low, which were nonetheless observed. The estimator proposed by Garman and Klass uses all four and, for the same window, produces a volatility estimate with far lower error. In practice twenty bars of the OHLC estimator carry roughly the same information as one hundred bars of the close based one. The indicator draws both estimates, and their ratio is informative in itself: when the OHLC estimate is clearly higher, the market moves a lot inside bars and then comes back, typical of agitated sideways phases; when it is lower, movement concentrates between one close and the next, the signature of a trending market or one with frequent gaps.

### How the calculation works

1. For every bar the logarithm of the high to low ratio and of the close to open ratio are computed.
2. The variance contribution is half the square of the first, minus a constant equal to twice the logarithm of two minus one, times the square of the second.
3. That constant is computed once at initialisation rather than on every bar.
4. The estimator can produce negative contributions on individual anomalous bars: these are zeroed so the sum cannot turn negative.
5. The average of the contributions over the window, square rooted, is the volatility estimate as a percentage per bar.
6. In parallel the standard deviation of close to close returns is computed over the same window, for comparison.

### How to use it

- Use the OHLC estimate in place of standard deviation wherever a volatility measure is needed: it is more precise for the same data.
- The gold line flags an agitated market: much movement inside bars that does not translate into progress between closes.
- The blue line flags a market where movement happens between closes: a clean trend or frequent gaps.
- The ratio between the two estimates is an excellent filter for scalpers, who live off intra-bar movement.
- On short windows the greater efficiency of the OHLC estimator is more evident: that is where the advantage shows.

### Who it is for and on which timeframes

It targets system builders who want a more precise volatility measure to base stops, sizing and filters on. Reading the ratio between the two estimates also interests discretionary traders, because it separates two situations that look alike on the chart. It works from M15 to D1. It should be avoided on instruments with unreliable highs and lows, such as some index CFDs where the wicks are generated by the broker feed rather than by real trades.

### Practical example of reading a signal

On DAX40 M30 the OHLC estimate sits steadily forty per cent above the close based one and the line is gold. The chart shows candles with very long wicks and small bodies: price covers a lot of ground within each half hour but always closes near where it opened. It is the ideal context for range traders and a terrible one for breakout buyers, because every extension fades. The next day the ratio falls below eighty per cent and the line turns blue: candles now have full bodies and short wicks. The same instrument now demands the opposite approach, and all that changed is how movement distributes inside the bars.

## Input parameters

| Parameter | Default | Description |
|---|---|---|
| `InpPeriod` | 20 | Estimation window in bars. Thanks to the estimator higher efficiency, short windows stay usable where close based ones would be too noisy. |
| `InpChopRatio` | 1.30 | Ratio between the two estimates beyond which the market is classified as agitated, with much intra-bar movement. |
| `InpTrendRatio` | 0.80 | Ratio below which movement is classified as concentrated between closes, typical of clean trends or gaps. |

## Advantages / strengths

- It uses four prices per bar instead of one: for the same window the estimate has far lower error.
- It allows short windows without the estimate becoming unusable through noise.
- The ratio with the classic estimate adds qualitative information about the type of movement, not just its size.
- No repaint and explicit handling of the negative contributions the estimator can produce.

## Limitations and warnings

- It implicitly assumes no gaps between bars: with frequent gaps it underestimates real volatility.
- It depends on the quality of highs and lows provided by the broker, which on some CFDs do not correspond to real trades.
- The formula is not intuitive and those unfamiliar with it struggle to understand why the two values differ.
- The two ratio classification thresholds are empirical values, to be verified on your own instrument.

**No repaint:** values printed on a closed bar are never modified afterwards.

**Disclaimer.** This product is a technical analysis tool, not an automated trading system, and it offers no profit guarantee whatsoever. Financial markets carry the risk of total loss of the invested capital. Past performance is not indicative of future results. Every signal must be confirmed with your own analysis, a money management plan and prior testing on a demo account. The author is not responsible for trading decisions taken on the basis of this indicator.

## Suggested tags / keywords for MQL5

`volatility`, `garman klass`, `ohlc`, `estimator`, `efficiency`, `range`, `no repaint`, `quantitative`
추천 제품
GDS Renko Anatomy Free Renko Structure and Movement Anatomy Indicator for MetaTrader 5 GDS Renko Anatomy is a free MetaTrader 5 indicator for traders who use Renko charts and want a clearer way to understand how brick-based movement is built. The indicator helps visualize Renko movement anatomy: structure, legs, pullbacks, pauses, continuation areas and weakening movement phases. It does not give buy or sell signals. It does not predict price movement. It is a visual context tool for manual Renk
Professional Renko Chart MT5 Professional Renko Chart MT5는 MetaTrader 5용 깔끔한 렌코 차트 지표로, 별도의 지표 창에 렌코 브릭을 표시하도록 설계되었습니다. 또한 선택적으로 메인 가격 차트 위에 렌코 박스를 직접 시각화할 수 있습니다. 이 지표는 MetaTrader 5 안에서 익숙한 렌코 차트 스타일을 사용하고 싶은 트레이더를 위해 제작되었습니다. TradingView와 같은 인기 있는 최신 차트 플랫폼에서 제공되는 렌코 차트 시각화와 유사한 방식으로, 일반적인 시간 기반 캔들을 렌코 브릭으로 변환하고 그 결과를 단순하고 명확하며 실용적인 형식으로 표시합니다. 여러 개의 일반 차트 캔들이 하나의 렌코 브릭을 만들 수 있습니다. Professional Renko Chart MT5는 메인 가격 차트 위에 렌코 박스를 표시할 수도 있으며, 각 렌코 브릭을 형성하는 데 사용된 일반 캔들의 개수도 보여줄 수 있습니다. 이 지표는 Exp
Smooth Patterns
Roman Vashchilin
Trading patterns on Forex is considered to be the highest level of trading, since it usually requires years of mastering various patterns (shapes and candle combinations) and the ways they affect the price. Patterns are different combinations of Japanese candles on a chart, shapes of classical technical analysis, as well as any regularities of the market behavior repeating many times under the same conditions. After the patterns appear on a chart, the price starts behaving in a certain way allow
World Session Zone Clock for MetaTrader 5 (MT5) *NO DEMO VERSION AVAILABLE* World Session Clock is a professional market session clock for MetaTrader 5 that visually displays global trading sessions in real time . It helps traders quickly identify market opens, closes, and session overlaps without manual time calculations or time-zone adjustments. The product combines a 24-hour analog clock , digital time display , session arcs , and optional chart session zones into a clean, lightweight interf
Cycle Projection Pro is a cyclical analysis indicator for MetaTrader 5, designed for the Daily timeframe. It identifies and projects recurring price cycles forward in time, helping you estimate when — not how much — the market may be approaching a turning point. How it works The indicator sums six harmonic cycles with explicit periods — Weekly, Biweekly, Monthly, Quarterly, Semiannual, Annual — each independently adjustable and can be turned on or off. Their combination produces a composite wav
GDS Renko Ghost Free Renko Market Memory Visualization Indicator for MetaTrader 5 GDS Renko Ghost is a free MetaTrader 5 indicator for traders who use Renko charts and want to study how similar Renko structures behaved in the past. The indicator visualizes historical Renko memory: similar past structures, continuation paths, consensus behavior and uncertainty zones. It does not give buy or sell signals. It does not predict price movement. It is a visual research and context tool for manual Renko
GDS Renko Pip ST Chart - Pip-Based Renko Chart Indicator for MetaTrader 5 GDS Renko Pip ST Chart is a pip-based Renko chart indicator for MetaTrader 5. It helps traders build and study cleaner Renko price movement using a practical fixed pip or point-based brick structure. This tool is designed as a Renko chart foundation for manual analysis. It does not predict the market, does not generate buy or sell signals and does not decide whether a trade should be opened. Renko EDGE EA Golden Delta | A
VibeFox Alligator — 추세 감지, 시장 단계 및 진입 지점 VibeFox Alligator는 MetaTrader 5용 실시간 빌 윌리엄스 앨리게이터 지표입니다. 세 개의 평활 이동 평균선인 Jaw, Teeth, Lips를 가격 차트에 직접 그리고, 진입 신호가 나타나는 순간을 명확한 화살표로 표시하며, 모든 컨트롤을 하나의 현대적인 인터랙티브 패널에 모읍니다. 세 개의 선을 수동으로 지켜보며 시장이 언제 깨어나는지 추측하는 대신, 시장 상태와 진입 지점이 형성되는 바로 그 순간을 확인할 수 있습니다. Alligator가 측정하는 것 빌 윌리엄스는 앨리게이터를 시장 행동의 은유로 설명했습니다. 세 개의 평활 이동 평균선은 앨리게이터의 Jaw (턱), Teeth (이빨), Lips (입술)를 나타내며, 각각 지연을 줄이기 위해 시간상 앞으로 이동됩니다. 세 선이 얽혀 있거나 서로 가깝게 묶여 있을 때, 앨리게이터는 잠들어 있습니다 — 시장은 뚜렷한 방향 없이 낮은 에너지의
Renko + ATR Trend Envelope PRO+ (Non-Repainting) Renko + ATR Trend Envelope PRO+ is a clean trend-filter indicator that combines a Renko-style step histogram with an ATR-based trend envelope. It highlights trend direction, volatility expansion/contraction and trend reversals with arrows and optional alerts. This tool is ideal for: Trend following strategies Breakout confirmation Filtering false entries during choppy markets Visualizing volatility using ATR envelopes Key Features Renko-Style Hi
Gino Renko
Stephane, Andr Valette
1 (1)
Another renko-based indicator. It returns different usable values ​​for an EA, and is directly displayed on the main chart. Its setting is very simple: The size of the renko The number of bars taken into account The falling color The color on the rise Returned values: Buffer 0 : Value of the middle Buffer 1 : Value of the Top Buffer 2 : Value of the Bottom Buffer 3 : Direction of renko (0.0 for top ; 1.0 for bottom) Buffer 4 : Ratio of the renko, for example, if it is twice, 3 times, ro more of
Quantum Live Renko Charts Indicator for MT5
QUANTUM TRADING SOFTWARE LIMITED
Renko is a well-known Japanese charting technique that removes time from the chart. Instead of drawing bars in constant intervals (time) as a normal chart would, a Renko chart does so only when price moves beyond a predefined amount. In a Renko chart, a bar is created when price exceeds the previous bar’s high or low by a predefined amount or what we call the Box Size. The result is a chart with equally sized bars running up or down in 45 degree angles. Such a chart offers the following advant
DAILY OH/OL SDEV QUANT MODEL - STATISTICAL TRADING WITH PRECISION RISK MANAGEMENT TRADE WITH MATHEMATICAL CERTAINTY - KNOW YOUR EXACT STOP-LOSS AND TAKE-PROFIT BEFORE YOU ENTER This indicator analyzes 5,000+ days of price history to give you: Exact entry levels (sigma bands locked at daily open) Exact stop-loss distance (from M
Trend Direction ADX indicator for MT5
Renaud Herve Francois Candel
Trend Direction ADX indicator Trend Direction ADX is part of a serie of indicators used to characterize market conditions. Almost any strategy only work under certain market conditions. Therefore it is important to be able to characterize market conditions at any time: trend direction, trend strength, volatility, etc.. Trend Direction ADX is an indicator to be used to characterize trend direction: trending up trending down ranging Trend Direction ADX is based on ADX standard indicator. Tre
VibeFox Supertrend — 적응형 승수와 진입 신호를 갖춘 동적 ATR 추세 밴드 VibeFox Supertrend는 MetaTrader 5를 위한 실시간 오버레이 지표입니다. 가격 차트 위에 직접 단일 동적 선을 그립니다: 선은 상승 추세에서는 봉 아래로, 하락 추세에서는 봉 위로 달리며, 추세가 실제로 반전할 때만 측면을 바꿉니다. ATR 기반 밴드가 선이 가격으로부터 얼마나 멀리 위치하는지를 결정하므로, 지표는 변동성 높은 시장에서 자연스럽게 넓어지고 시장이 조용해지면 좁아집니다. 선택적 적응형 승수(Kaufman Efficiency Ratio)는 추세 상황에서 밴드를 더 좁히고 혼조 상황에서는 넓혀, 거짓 전환을 줄입니다. 모든 컨트롤은 하나의 현대적인 인터랙티브 canvas 패널에 모여 있습니다. Supertrend이 측정하는 것 이 지표는 한 가지를 추적합니다: 지배적 추세의 방향과 동적 밴드가 가격으로부터 얼마나 멀리 위치하는지. 각 봉에서 밴드는 Averag
GDS Renko Structure Free Renko Structure Indicator for MetaTrader 5 GDS Renko Structure is a free MetaTrader 5 indicator for traders who use Renko charts and want a clearer way to read market structure, movement phases and brick-based behavior. The indicator helps visualize how Renko structure is forming on the chart: movement legs, pauses, continuation areas, pullback behavior and structural shifts. It does not give buy or sell signals. It does not predict price movement. It is a visual context
MACD Sniper Pro
Noppawat Tumjai
MACD Sniper Pro is an advanced automated trading system designed for traders seeking high-precision entries and robust risk management. By combining the classic momentum of MACD Crossover with a strict ADX Volatility Filter and Dynamic ATR Management , this EA completely eliminates emotional trading and filters out dangerous flat/sideways markets. Unlike standard MACD indicators that suffer during consolidation, MACD Sniper Pro verifies trend strength before entering and protects your capital us
Short Description: Prop Firm Protector EZ MT5 is an EA designed to protect your funded account by managing risk and ensuring compliance with the Prop Firm's trading rules. This EA automatically monitors equity levels, closes trades when profit targets or drawdown limits are reached, and provides a visual display of key account metrics. The EA features a Super Easy setup, is simple to use, and works with all different Prop Firm service providers. Overview: Prop Firm Protector EZ MT5 is an Draw
Renko Brick Pro
Timothy Chuma Ifiora
Renko Brick Pro - Advanced Renko Indicator for MT5 Professional Renko bricks with intelligent ATR sizing and ready-to-use EA integration buffers. Renko charts eliminate market noise by creating bricks only when price moves a specific amount. Unlike traditional price charts, each brick represents the same price movement, giving you cleaner trend identification and better entry points. This indicator brings true Renko analysis to MT5 with intelligent ATR-based brick calculations that automatically
Overview The Market Perspective Structure Indicator is a comprehensive MetaTrader indicator designed to provide traders with a detailed analysis of market structure across multiple timeframes. It identifies and visualizes key price action elements, including swing highs and lows, Break of Structure (BOS), Change of Character (CHOCH), internal structures, equal highs/lows, premium/discount levels, previous levels from higher timeframes, and trading session zones. With extensive customization opt
GoldenShot
Adam Hrncir
4.31 (32)
10 LICENSES LEFT AT   $ 249  / $ 299  NEXT /   $ 399 final price. The earlier you decide, the less you pay. Check the live signal   /   Read the manual  / Why are the back-test numbers that good - is it real or over-fitted? One shot. One target. Zero recovery. GoldenShot is a single-position gold EA built for controlled, long-term trading. It waits for a qualified setup, takes one clean shot with a real stop loss, and if the idea does not work, it manages the trade instead of rescuing it. No
Trend Line Map Pro MT5
STE S.S.COMPANY
4.09 (11)
트렌드 라인 맵 표시기는 트렌드 스크리너 표시기의 애드온입니다. Trend screener(Trend Line Signals)에 의해 생성된 모든 신호에 대한 스캐너로 작동합니다. Trend Screener Indicator 기반의 Trend Line Scanner입니다. Trend Screener Pro 표시기가 없으면 Trend Line Map Pro가 작동하지 않습니다. It's a Trend Line Scanner based on Trend Screener Indicator. If you don't have Trend Screener Pro Indicator,     the Trend Line Map Pro will not work . MQL5 블로그에 액세스하여 추세선 지도 표시기의 무료 버전을 다운로드할 수 있습니다. Metatrader Tester 제한 없이 구매하기 전에 사용해 보십시오. : 여기를 클릭하세요 1. 쉽게 얻을 수 있는 이점 통화 및 시간 프레
Cumulative Delta NG
Anton Polkovnikov
Cumulative delta indicator As most traders believe, the price moves under the pressure of market buying or selling. When someone redeems an offer standing in the cup, the deal is a "buy". If someone pours into the bid standing in the cup - the deal goes with the direction of "sale". The delta is the difference between purchases and sales. A cumulative delta - the difference between the cumulative sum of purchases and sales for a certain period of time. It allows you to see who is currently contr
Phantom Edge SMC
Nattapon Chuekamhod
Phantom Edge SMC — The Ultimate Smart Money Indicator for MT5 Tired of manually drawing structures while trading SMC or ICT concepts? Let Phantom Edge SMC do the heavy lifting for you. Key Features Internal & Swing Structure: Automatically detects BOS and CHoCH across two structural levels. Order Blocks (OB): Identifies Internal and Swing OBs with automated mitigation tracking. Equal Highs / Lows: Highlights EQH / EQL to pinpoint Liquidity pools. Fair Value Gaps (FVG): Displays FVGs with
If you've ever stared at a gold chart, done the math in your head three times, and still second-guessed your lot size right before entry - this tool was built for you. Current price: $39 - increases by $10 after every 20 purchases until reaching the final price of $89 . Next price: $49 . Complete Buyer Kit: 34 Professional Resources included at no additional cost. MT5 Presets, PDF Guides, Checklists, Mindmaps, Reference Cards, and Excel Workbooks - built from 8 years of developing structured XAU
GDS Renko Adaptive - Adaptive Renko Chart Indicator for MetaTrader 5 GDS Renko Adaptive is a free adaptive Renko chart indicator for MetaTrader 5. It helps traders observe price movement through a more flexible Renko structure instead of relying only on one fixed brick-size view. The purpose of this tool is to support manual Renko analysis by making structure, movement rhythm and changing market conditions easier to observe. It does not predict the market and does not generate buy or sell signal
The Expert Advisor is used to create Renko chart, realtime updates, easy for technical analysis. Backtest your strategy with all indicators with Renko chart in MetaTrader 5. Parameters Box Size : input the number of box size. Show Wicks : if true , draw a candle with high/low. History Start: input the date to creat first candle. Maximum Bars: limit number of bars on renko chart How to use Attach the Expert Advisor to a chart (timeframe M1), for which you want to create a renko. Input box size a
Advanced CRT Indicator MT5 — Candle Range Theory Tool Advanced CRT Indicator MT5 is a professional analysis tool that automates Candle Range Theory. It identifies consolidation ranges, breakout levels, Fair Value Gaps (FVG), and profit targets, with a real-time dashboard and alerts. Overview - Multi-timeframe candle range detection   - Automatic breakout levels with buffer settings   - Fair Value Gap identification and tracking   - Up to three customizable target levels (Risk:Reward ratios)  
RenkoFromRealTicks
Stanislav Korotky
4.67 (3)
This non-trading expert utilizes so called custom symbols feature ( available in MQL API as well) to build renko charts based on history of real ticks of selected standard symbol. RenkoFromRealTicks generates custom symbol quotes, thus you may open many charts to apply different EAs and indicators to the renko. It also transmits real ticks to update renko charts in real time. The generated renko chart uses M1 timeframe. It makes no sense to switch the renko chart to a timeframe other than M1. T
Renko Builder GLX1
Eranga Thilina Dhanushka Gallage
GLX1 Renko Builder   Expert Advisor (EA) can create the Renko bar charts on any symbol. The Renko charts are generated as real-time custom symbol charts which can be further used for technical analysis with any MT5 compatible indicator.  Find the free   GLX1 Renko Euro   Expert Advisor from here.  https://www.mql5.com/en/market/product/115074 Included Features: Truly responsive Renko Charting on a custom symbol chart Accurate automatic live chart update Ability to attach any MT5 indicator Abi
Babel Assistant
Iurii Bazhanov
4.33 (9)
Babel assistant 1 MT5 넷팅(netting) 로봇 "Babel_assistant_1"은 ZigZag 지표를 사용하여 M1, M5, M15, H1, H4, D1 및 W1 타임프레임 전반에 걸쳐 피보나치 수준을 생성하고, 매수 및 매도 트렌드의 강도를 계산합니다. 지정된 트렌드 수준 4.925를 초과하면 "Lot for open a position" 설정을 사용하여 포지션을 엽니다. 그런 다음, Babel은 특정 피보나치 수준에 대기 주문(pending orders)을 배치하고 지정된 손절매(Stop Loss) 및 이익실현(Take Profit) 라인을 설정합니다. 화면에는 포지션, 거래 및 트렌드의 현재 결과가 표시됩니다. 0.02랏 이상의 수동 포지션 증가는 로봇에 의해 자체 대기 주문의 트리거로 인식됩니다. 0.01랏의 대기 주문 또는 시장가 주문은 체결 시 단순히 포지션 볼륨을 변경합니다. 면책 조항: 아래에 제시된 자료는 정보 제공 및 교육 목적으로만 제공됩니다
FREE
이 제품의 구매자들이 또한 구매함
Trend Sniper X
Sarvarbek Abduvoxobov
4.9 (42)
Trend Sniper X 는 트레이더가 추세 방향과 잠재적 반전 지점을 명확하고 정확하게 포착할 수 있도록 도와주는 MetaTrader 5용 멀티 타임프레임 추세 추종 지표입니다. MT4용: https://www.mql5.com/en/market/product/193245 가격 정보: 현재 가격은 프로모션 할인가이며, 향후 업데이트 및 새로운 기능이 출시됨에 따라 변동될 수 있습니다. 보너스 혜택: 본 지표 전용 무료 자동매매 Assistant EA를 받으시려면 구매 후 작성자에게 메시지를 보내주시기 바랍니다. Code2Profit 채널 멀티 타임프레임 분석으로 시장을 마스터하세요! Trend Sniper X로 승률을 극대화하는 방법: 핵심 규칙 및 세션 팁 기술 사양 플랫폼 MetaTrader 5 지표 유형 멀티 타임프레임 추세 지표 운용 타임프레임 모든 차트 타임프레임 지원, 독립적으로 선택 가능한 상위 타임프레임(M1–MN1) 주요 상품 외환, 금(XAUUSD) 및 기타 C
Smart Trend Trading System — MetaTrader 5 구매 후 MQL5에서 저에게 메시지를 보내시면 Smart Universal Expert Advisor를 무료로 받으실 수 있으며, 온라인 강좌, PDF 매뉴얼 및 비공개 그룹 이용 권한도 함께 제공됩니다. STTS는 추세 방향, 진입·청산 신호, 반전 구간, 주요 가격 수준을 차트에 모아 보여줍니다. 시스템을 참고해 수동으로 거래하거나, 별도의 호환 EA를 연결하여 선택한 설정에 따라 자동으로 거래를 실행할 수 있습니다. 하나의 시스템, 네 가지 트레이딩 접근법 STTS의 트레이딩 접근법은 크게 네 가지로 나뉩니다. • 스캘핑 — 단기 신호와 시장 움직임을 살펴봅니다. • 추세 매매 — 방향을 평가하고 추세 안에서 기회를 찾습니다. • 반전 매매 — 잠재적인 전환 구간과 방향 변화를 파악합니다. • 거래량 매매 — 거래량 기반 정보로 시장 활동을 평가합니다. 진입·청산 화살표, 추세 정보, 지지·저항 수
SuperScalp Pro
Van Minh Nguyen
4.56 (36)
SuperScalp Pro - Professional Multi-Layer Confluence Scalping System SuperScalp Pro는 클래식 Supertrend에 여러 지능형 확인 필터를 추가한 고급 스캘핑 지표입니다. 더 높은 확률의 Buy/Sell 거래 기회를 식별하는 데 도움을 주며, 잘못된 신호를 크게 줄이는 데 도움을 줍니다. 명확한 Buy 및 Sell 화살표가 차트에 직접 표시되며, ATR 기반 Stop Loss 및 Take Profit 수준이 실시간으로 자동 계산됩니다. 구매 후 설정 방법 및 권장 구성에 대한 안내가 필요하시면 저에게 문의해 주세요. SuperScalp Pro Auto Trader를 사용하여 신호를 쉽게 자동화할 수 있습니다: [Auto Trader] 권장 설정 파일 다운로드: [Set File] 전체 문서는 제품 블로그에서 확인할 수 있습니다: [User Guide] 업데이트를 확인하려면 공식 채널에 참여하세요: [Official C
새로운 왕의 등장 - 인디케이터 + 주문 관리 표시(TP1 + TP2 + TP3) + 선택형 텔레그램 시그널 전송 기능 포함 (무료) (완전한 트레이딩 및 시그널 시스템) 골드를 위한 최고의 EA: Gold Slayer 이 인디케이터는 고급 전략, 사용자 지정 가능한 주문 관리 시스템, 그리고 엔벨로프 확장을 결합한 평균 회귀(mean reversion) 시스템을 포함하고 있습니다. 또한 RSI와 같은 여러 지능형 확인 필터를 통해 높은 확률의 반전 진입 구간을 포착하여 BUY 및 SELL 시그널을 제공합니다. 단순히 거래 방법만 배우는 것이 아니라, 여러 포지션을 효과적으로 관리하고 이전에 수익 중인 오픈 포지션으로 손실 거래를 커버하는 방법까지 익힐 수 있습니다. M5 전용으로 설계 및 최적화되었으며, 유동성이 풍부해 시그널이 더 깔끔하고 신뢰도 높은 BTCUSD와 XAUUSD에서 뛰어난 성능을 발휘합니다. 이 인디케이터는 ATR 기반으로 자동 계산된 진입가, 손절가, 익절가와
SMC Intraday Formula
VividMind Digital Solutions
5 (26)
먼저 솔직하게 말하겠습니다. 어떤 인디케이터도 단독으로 당신을 수익성 있게 만들어주지 않습니다. 누군가 그렇게 말한다면, 그는 당신에게 꿈을 파는 것입니다. 완벽한 매수/매도 화살표를 보여주는 모든 인디케이터는 완벽하게 보이도록 만들 수 있습니다 — 단지 올바른 과거 구간을 확대하고 승리한 거래만 캡처하면 됩니다. 우리는 그렇게 하지 않습니다.  SMC Intraday Formula는 도구입니다. 시장 구조를 읽고, 가장 높은 확률의 가격 구간을 표시하며, 현재 스마트 머니의 흐름이 어떻게 보이는지 아주 단순한 언어로 보여줍니다. 최종 결정은 여전히 당신이 합니다. 실행도 당신이 합니다. 하지만 이제는 희망이 아니라 정확성으로 거래하게 됩니다. 우리는 이 인디케이터를 지난 약 3년 동안 골드(XAUUSD) 및 주요 외환 통화쌍의 데이 트레이딩 스캘핑에 사용해 왔습니다. M1, M5, M15, M30에서 우리의 핵심 도구입니다. 이 도구는 미래를 예측하려 하지 않습니다 — 지금 형성
Entry Points Pro for MT5
Yury Orlov
4.52 (151)
전설이 돌아왔습니다: Entry Points Pro 10. MQL5 마켓 Top-3 자리를 3년간 지켜온 전설적인 지표의 재출시입니다. 수백 개의 호평 리뷰(두 버전 합산 589개), 매일 이 지표로 거래하는 수천 명의 트레이더, 31,000회 이상의 데모 다운로드   MT4+MT5 . 지난 5년간 여러분이 남긴 리뷰를 하나도 빠짐없이 읽었고, 약속 대신 그 답을 버전 10에 담았습니다. 1999년부터 시장에서 활동하며 정직함과 자신의 평판, 그리고 고객을 소중히 여기는 개발자가 만들었습니다. Entry Points Pro의 진입 시그널은 절대 리페인팅되지 않습니다. 그리고 이번에는 개발자의 말뿐이 아니라 검증 가능한 사실입니다: 확정 시그널은 캔들 종가에서만 표시되며, 자동화 테스트에서 리페인팅 0건 이 확인되었습니다(EURUSD, XAUUSD, BTCUSD에서 2,486,568회의 불변조건 검사 — 위반 0건). 검증 방법은 공개되어 있으니 전략 테스터에서 직접 재현해 보실 수
Neuro Poseidon MT5
Daria Rezueva
4.75 (52)
Neuro Poseidon is a new indicator by Daria Rezueva. It combines precise trading signals with adaptive TP/SL levels - creating best possible trades as a result! Message me and get  Neuro Poseidon Assistant  as a gift to automize your trading process! What makes it stand out? 1. Proven profitability on all assets and timeframes 2. Only confirmed BUY and SELL signals present on the chart 3. Adaptive TP & SL levels generated by the software for each trade 4. Easy to understand - suitable for al
M5 Sniper
MeanFX
5 (3)
당신의 트레이딩 우위를 한눈에 확인하세요! M5 Sniper 는 MeanFX의 새로운 지표입니다. 정확한 트레이딩 신호 와 적응형 TP/SL 레벨 을 결합하여, 결과적으로 가능한 최고의 통계적 트레이딩을 만들어냅니다! 5회 구매마다 가격이 인상되며, 다음 가격은 69$입니다. 구매 후 저에게 메시지를 보내주시면 팁/가이드와 보너스 EA를 제공해 드립니다. 무엇이 이 지표를 특별하게 만들까요? Gold XAUUSD에서 검증된 통계적 성과 ( 거의 모든 자산에서 작동 하며, 일관된 결과 없이 모든 것을 다루려고 하기보다는 하나의 타임프레임을 완전히 익히는 데 집중합니다) 각 심볼당 하루 1~8회의 트레이드 와 높은 승률을 제공하며, 모든 통계적 우위를 우리의 편으로 가져갑니다. 차트에는 확인된 BUY 및 SELL 신호만 표시됩니다. 각 트레이드에 대해 지표가 생성하는 적응형 TP 및 SL 레벨 평균 승률 75%+ 평균 Signal Ratio 최소 1.1+ 알람 및 알림이 휴대폰 으로도
M1 Sniper MT5
Oleg Rodin
5 (7)
M1 SNIPER 는 사용하기 쉬운 거래 지표 시스템입니다. M1 시간대에 맞춰 설계된 화살표 지표입니다. 이 지표는 M1 시간대 스캘핑을 위한 단독 시스템으로 사용할 수 있으며, 기존 거래 시스템의 일부로도 사용할 수 있습니다. 이 거래 시스템은 M1 시간대 거래용으로 특별히 설계되었지만, 다른 시간대에도 사용할 수 있습니다. 원래는 XAUUSD와 BTCUSD 거래를 위해 이 방법을 설계했지만, 다른 시장 거래에도 유용하다는 것을 알게 되었습니다. 이 지표의 신호는 추세 방향과 반대로 거래될 수 있습니다. 저는 지표의 신호를 활용하여 양방향으로 거래할 수 있도록 돕는 특별한 거래 기법을 알려드립니다. 이 방법은 특별한 동적 지지선과 저항선 가격 영역을 활용하는 것을 기반으로 합니다. 구매하시면 M1 SNIPER 화살표 지표를 바로 다운로드하실 수 있습니다. 또한, 아래 스크린샷에 표시된 Apollo Dynamic SR 지표는 M1 SNIPER 도구를 사용하는 모든 사용자에게 무료로
Adaptive Price Action Engine 지표를 구매하면 EA(자동매매 프로그램)가 무료 멀티 타임프레임 기반 자기 최적화 추세 & 캔들 패턴 분석 시스템 시장은 끊임없이 변화하며, 모든 Price Action 패턴이 모든 시장 환경에서 동일한 가치를 가지는 것은 아닙니다. Adaptive Price Action Engine 은 변화하는 시장 환경에 적응할 수 있도록 설계되었으며, 추세 구조, 멀티 타임프레임 분석, 캔들 패턴 및 통계적 최적화 를 하나의 분석 프레임워크로 결합합니다. 두 가지 적응형 모드 Dual Alpha Trend Mode 낮은 타임프레임과 높은 타임프레임에서 적합한 Alpha Trend 파라미터를 자동으로 탐색하여, 최근 시장 움직임에 맞춰 추세 분석을 조정합니다. Candlestick + Alpha Mode Alpha Trend를 통한 시장 국면 분석과 22개의 상승 및 하락 캔들 패턴 을 결합합니다. 모든 패턴을 동일하게 취급하는 대신, 다양
ARIPoint
Temirlan Kdyrkhan
1 (4)
ARIPoint is a powerful trading companion designed to generate high-probability entry signals with dynamic TP/SL/DP levels based on volatility. Built-in performance tracking shows win/loss stats, PP1/PP2 hits, and success rates all updated live. Key Features: Buy/Sell signals with adaptive volatility bands Real-time TP/SL/DP levels based on ATR Built-in MA Filter with optional ATR/StdDev volatility Performance stats panel (Success, Profit/Loss, PP1/PP2) Alerts via popup, sound, push, or email Cu
Gann Made Easy MT5
Oleg Rodin
5 (12)
Gann Made Easy 는 mr.의 이론을 사용하여 최고의 거래 원칙을 기반으로 하는 전문적이고 사용하기 쉬운 Forex 거래 시스템입니다. W.D. 간. 이 표시기는 Stop Loss 및 Take Profit Levels를 포함하여 정확한 BUY 및 SELL 신호를 제공합니다. PUSH 알림을 사용하여 이동 중에도 거래할 수 있습니다. 구매 후 거래 방법 안내 및 유용한 추가 지표를 무료로 받으시려면 저에게 연락주세요! 아마도 Gann 거래 방법에 대해 이미 여러 번 들었을 것입니다. 일반적으로 Gann의 이론은 초보자 거래자뿐만 아니라 이미 거래 경험이 있는 사람들에게도 매우 복잡한 것입니다. Gann의 거래 방식은 이론적으로 적용하기 쉽지 않기 때문입니다. 나는 그 지식을 연마하고 Forex 지표에 최고의 원칙을 적용하기 위해 몇 년을 보냈습니다. 표시기는 적용하기가 매우 쉽습니다. 차트에 첨부하고 간단한 거래 권장 사항을 따르기만 하면 됩니다. 지표는 지속적으로 시장 분석
Scalper Vault MT5
Oleg Rodin
5 (1)
Scalper Vault는 당일 매매(intraday trading)에서 일관된 성과를 내고자 하는 트레이더를 위해 설계된, 강력하고 모든 기능을 갖춘 트레이딩 시스템입니다. 이 고정밀 지표는 외환(Forex) 및 바이너리 옵션 트레이더 모두에게 기관급 분석을 제공하는 독립적인 종합 트레이딩 시스템 역할을 합니다. 구매 후 저에게 연락해 주시면, 트레이딩 팁과 함께 특별한 보너스를 제공해 드립니다! Scalper Vault는 추측에 의존하거나 복잡한 수동 분석을 할 필요를 없애주며, 사용하기 쉬운 트레이딩 기법을 통해 오직 매매 실행에만 집중할 수 있도록 돕습니다. 정확한 추세 추종 신호: 핵심 알고리즘이 시장 구조를 분석하여, 지배적인 시장 추세 방향과 일치하는 고확률 신호만을 제공함으로써 잘못된 진입을 획기적으로 줄여줍니다. 정밀한 고점 및 저점 탐지: 시장의 움직임이 소진되는 지점을 스캔하여 잠재적인 반전 구간을 식별합니다. 간(Gann) 이론 기반의 매수/매도 구간: 수학적
Auto Optimized SpeedAngle 은 지속적인 워크포워드 최적화(Walk-Forward Optimization, WFO)를 통해 곡선 적합(curve-fitting)을 제거한 기관 수준의 모멘텀 벡터화 시스템입니다. 시장 체제가 바뀔 때 성능이 떨어지는 정적 입력에 의존하는 대신, 이 지표는 표본 외(Out-of-Sample, OOS) 검증을 사용하여 매개변수를 동적으로 재보정하며, 표시되는 신호가 과거의 우연이 아닌 진정한 통계적 우위를 나타내도록 보장합니다. 핵심 기관용 프레임워크 워크포워드 최적화 엔진: 핵심 알고리즘은 수천 가지의 룩백(lookback) 및 임계값 조합을 지속적으로 스캔하며, 데이터를 인샘플(in-sample)과 표본 외(out-of-sample) 세트로 엄격하게 분리합니다. 미지의 데이터 환경에서 수학적 우수성이 증명된 경우에만 새로운 매개변수 구성을 채택합니다. 정량적 목적 함수: 순수한 총이익을 쫓는 대신, 최적화 엔진은 기관 수준의 안정성
Entry In The Zone and SMC Multi Timeframe is a real-time market analysis tool based on Smart Money Concepts (SMC), designed to analyze market structure, price direction, and key trading zones. It supports both Single-Timeframe and Multi-Timeframe Analysis, providing a clearer view of overall market structure across multiple timeframes, with real-time BUY / SELL signals designed with a strict focus on No-Repaint principles. The signals are designed to help filter unclear setups and evaluate tradi
Trend Catcher ind mt5
Ramil Minniakhmetov
5 (18)
트렌드 캐처 인디케이터 트렌드 캐처 인디케이터는 개발자가 자체 개발한 맞춤형 적응형 트렌드 분석 지표들을 조합하여 시장 가격 움직임을 분석합니다. 단기적인 노이즈를 제거하고 근본적인 모멘텀 강도, 변동성 확대, 가격 구조 움직임에 집중하여 진정한 시장 방향을 파악합니다. 또한 이동 평균, RSI, 변동성 필터와 같은 맞춤형 지표들을 활용하여 가격을 평활화하고 트렌드를 필터링합니다. 실제 운영 모니터링 및 기타 제품은 다음 링크에서 확인하실 수 있습니다:   https://www.mql5.com/en/users/mechanic/seller 텔레그램에서는 EA나 설정 파일을 판매하지 않습니다. 사기이니 주의하세요. 모든 설정 파일은 블로그에서 무료로 제공됩니다. 중요! 구매 후 즉시 연락 주시면 사용 방법 및 보너스를 드립니다!
안녕하세요, 트레이더 여러분! 많은 개인 투자자들이 느린 웹 스크립트에 의존하고 있습니다. 수익성 있는 거래를 위해서는 체계적인 프레임워크가 필수적입니다. Astro AI 지표는 단순한 차트 오버레이가 아닙니다. 터미널에서 직접 실행되는 두 개의 에이전트로 구성된 정교한 신경망입니다. 시스템 기술 상세 설명: 1. 에이전트 1: 분석가 (그래픽 신경망 – GNN) 시장은 개별 가격 막대로 이루어진 것이 아니라 상호 연결된 데이터 네트워크입니다. 기능: 에이전트 1은 그래픽 신경망을 사용하여 이러한 복잡하고 비선형적인 관계를 파악합니다. 장점: 기존 지표는 과거 이동 평균만을 고려하는 반면, 저희 GNN은 시장의 심층적인 구조적 관계를 실시간으로 처리하여 개별 트레이더의 거래량이 시장에 큰 영향을 미치기 전에 숨겨진 상관관계를 찾아냅니다. 2. 에이전트 2: 실행기 (근접 전략 최적화 – PPO) 패턴 인식은 절반의 성공일 뿐입니다. 현재 시장 변동에 기반하여 올바른
Divergence Bomber
Ihor Otkydach
4.89 (94)
이 지표를 구매하신 분께는 다음과 같은 혜택이 무료로 제공됩니다: 각 거래를 자동으로 관리하고, 손절/익절 수준을 설정하며, 전략 규칙에 따라 거래를 종료하는 전용 도우미 툴 "Bomber Utility" 다양한 자산에 맞게 지표를 설정할 수 있는 셋업 파일(Set Files) "최소 위험", "균형 잡힌 위험", "관망 전략" 모드로 설정 가능한 Bomber Utility의 셋업 파일 이 전략을 빠르게 설치, 설정, 시작할 수 있도록 돕는 단계별 영상 매뉴얼 주의: 위의 모든 보너스를 받기 위해서는 MQL5 개인 메시지 시스템을 통해 판매자에게 연락해 주세요. 독창적인 커스텀 지표인 “Divergence Bomber(다이버전스 봄버)”를 소개합니다. 이 지표는 MACD 다이버전스(괴리) 전략을 기반으로 한 올인원(All-in-One) 거래 시스템입니다. 이 기술 지표의 주요 목적은 가격과 MACD 지표 간의 다이버전스를 감지하고, **향후 가격이 어느 방향으로 움직일지를 알려주
PainX GainX Blue Spike Fusion AI Advanced Synthetic Index Spike Detection Indicator for MetaTrader 5 Discover potential spike setups with a clear, organized, and professional trading interface. PainX GainX Blue Spike Fusion AI is a specialized indicator designed for traders who monitor synthetic indices and want a structured way to observe potential price spike opportunities. The indicator combines signal monitoring, market-condition analysis, visual alerts, and event tracking in one convenient
Unix Scalper
Issam Kassas
4 (4)
Unix Scalper — MetaTrader 5 구매 후 MQL5에서 저에게 메시지를 보내시면 Smart Universal Expert Advisor를 무료로 받으실 수 있으며, 온라인 강좌, PDF 매뉴얼 및 비공개 그룹 이용 권한도 함께 제공됩니다. 매매 기회를 찾고, 거래 계획을 확인하고, 실행 방법을 선택하세요. UNIX Scalper는 시장 분석, BUY/SELL/WAIT 판단, Entry, Stop Loss, TP1 및 TP2 가격 수준을 하나의 정돈된 패널에 제공합니다. 신호와 거래 계획을 한눈에 • 명확한 판단: BUY, SELL 또는 WAIT. • 구체적인 가격 수준: Entry, Stop Loss, TP1 및 TP2. • 다중 시간대 개요: 패널의 여러 시간대 신호를 비교하세요. • 판단을 돕는 분석: 추세, 모멘텀, 거래량, 변동성, 지지와 저항, 시장 품질. • 다양한 레이아웃: Minimized, Compact, Standard 또는 Full. 신호와
Volatility Master for MetaTrader is a real-time dashboard tool that scans up to  50 symbols  to identify high-volatility , trending markets instantly. With bullish/bearish signals, customizable alerts, and a user-friendly interface, it helps you avoid range-bound conditions and focus on high-probability trades. Clarity leads to confidence. Trade confidently and protect your capital effectively with this powerful dashboard. We don't offer free or bonus indicators in exchange of reviews from you.
Atomic Analyst MT5
Issam Kassas
4.48 (62)
Atomic Analyst — MetaTrader 5 구매 후 MQL5에서 저에게 메시지를 보내시면 Smart Universal Expert Advisor를 무료로 받으실 수 있으며, 온라인 강좌, PDF 매뉴얼 및 비공개 그룹 이용 권한도 함께 제공됩니다. Atomic Analyst는 가격 움직임 분석, 추세 방향, 진입·청산 신호, 손절 수준, 여러 익절 수준을 차트에 모아 보여줍니다. 신호를 확인하고 매매 상황을 이해하세요 Atomic Analyst는 분석 결과를 명확한 시각 정보로 정리합니다. • 잠재적인 진입 기회를 확인할 수 있는 매수·매도 화살표. • 거래 계획에 도움이 되는 손절 수준과 여러 익절 수준. • 시장 방향을 평가할 수 있는 추세, 강도, 모멘텀 수치. • 더 넓은 시장 맥락을 비교할 수 있는 여러 시간대 분석. • 변화하는 시장 상황을 따라갈 수 있는 색상별 캔들과 알림. 신호와 보조 분석을 함께 검토한 다음, 해당 매매 상황이 자신의 거래 규칙에
Break and Retest Hunter
Mohamed Hassan
5 (2)
Break and Retest Hunter is a powerful MetaTrader 5 indicator designed to automatically identify support and resistance levels, breakout structures, and potential retest opportunities in real time. Bonus Indicator: After purchasing Break and Retest Hunter , contact me to receive Trade Indicator Assistant EA completely free as a bonus utility. $65 for the next 10 copies . Next price is $120.  Combining adaptive market analysis, clear BUY/SELL signals, Fibonacci-based profit targets, and a premiu
FiboSniper Pro
Van Minh Nguyen
5 (3)
FiboSniper Pro – Multi-Filter Fibonacci System with Auto SL/TP and Control Panel FiboSniper Pro는 동적 Fibonacci Envelopes와 여러 확인 필터를 결합하여 선별된 Buy 및 Sell 신호를 생성하는 기술적 지표입니다. Fibonacci 레벨은 Moving Average와 ATR을 기반으로 계산된 후 ADX, EMA, RSI, ATR, Volume, Time 및 Candle 구조를 통해 필터링됩니다. 이 지표는 ATR 기반의 자동 Stop Loss 및 Take Profit 레벨을 차트에 직접 표시하며, 빠른 설정 조정을 위한 인터랙티브 Control Panel을 제공합니다. 구매 후 권장 설정 파일과 자세한 사용 방법을 받으려면 저에게 문의해 주세요. Auto Trader X를 사용하여 FiboSniper Pro 신호를 자동화할 수 있습니다: [Auto Trader X] User Guide 및 Se
Quantum TrendPulse
Bogdan Ion Puscasu
5 (26)
SuperTrend   ,   RSI   ,   Stochastic   의 힘을 하나의 포괄적인 지표로 결합하여 트레이딩 잠재력을 극대화하는 궁극의 트레이딩 도구   인 Quantum TrendPulse를   소개합니다. 정밀성과 효율성을 추구하는 트레이더를 위해 설계된 이 지표는 시장 추세, 모멘텀 변화, 최적의 진입 및 종료 지점을 자신 있게 식별하는 데 도움이 됩니다. 주요 특징: SuperTrend 통합:   주요 시장 추세를 쉽게 따라가고 수익성의 물결을 타세요. RSI 정밀도:   매수 과다 및 매도 과다 수준을 감지하여 시장 반전 시점을 파악하는 데 적합하며 SuperTrend 필터로 사용 가능 확률적 정확도:   변동성이 큰 시장에서 숨겨진 기회를 찾기 위해 확률적 진동   을 활용하고 SuperTrend의 필터로 사용 다중 시간대 분석:   M5부터 H1 또는 H4까지 다양한 시간대에 걸쳐 시장을 최신 상태로 유지하세요. 맞춤형 알림:   맞춤형 거래 조건이 충족되면
FX Power MT5 NG
Daniel Stein
5 (33)
FX Power: 통화 강세 분석으로 더 스마트한 거래 결정을 개요 FX Power 는 어떤 시장 상황에서도 주요 통화와 금의 실제 강세를 이해하기 위한 필수 도구입니다. 강한 통화를 매수하고 약한 통화를 매도함으로써 FX Power 는 거래 결정을 단순화하고 높은 확률의 기회를 발견합니다. 트렌드를 따르거나 극단적인 델타 값을 사용해 반전을 예측하고자 한다면, 이 도구는 귀하의 거래 스타일에 완벽히 적응합니다. 단순히 거래하지 말고, FX Power 로 더 스마트하게 거래하세요. 1. FX Power가 거래자에게 매우 유용한 이유 통화와 금의 실시간 강세 분석 • FX Power 는 주요 통화와 금의 상대적 강세를 계산하고 표시하여 시장 역학에 대한 명확한 통찰력을 제공합니다. • 어떤 자산이 앞서고 있고 어떤 자산이 뒤처지는지 모니터링하여 보다 현명한 거래 결정을 내릴 수 있습니다. 포괄적인 멀티 타임프레임 뷰 • 단기, 중기 및 장기 타임프레임에서 통화와 금의 강세를
PZ Divergence Trading MT5
PZ TRADING SLU
3.71 (7)
Unlock hidden profits: accurate divergence trading for all markets Tricky to find and scarce in frequency, divergences are one of the most reliable trading scenarios. This indicator finds and scans for regular and hidden divergences automatically using your favourite oscillator. [ Installation Guide | Update Guide | Troubleshooting | FAQ | All Products  ] Easy to trade Finds regular and hidden divergences Supports many well known oscillators Implements trading signals based on breakouts Displays
DayTrader PRO
Davit Beridze
5 (4)
DayTrader PRO DayTrader PRO는 존 에러스(John Ehlers)의 Laguerre 필터와 강력한 자동 최적화 엔진을 결합한 고급 트레이딩 지표입니다. 고정된 파라미터를 사용하는 대신, 최근 시장 상황을 바탕으로 최적의 설정을 자동으로 검색하므로 지속적인 수동 조정 없이도 변화하는 시장 변동성에 대응할 수 있습니다. 이 지표는 명확한 매수(BUY) 및 매도(SELL) 신호를 생성하며, 현재 시장 변동성을 기준으로 계산된 적응형 손절매(Stop Loss) 및 익절(Take Profit) 레벨을 제공합니다. 내장된 추세, 효율성 지수(Efficiency Ratio), 변동성 및 캔들 필터 기능은 저품질의 진입 신호를 제거하여 신호의 정확도를 높여줍니다. 실시간 성능 대시보드에서는 현재 최적화된 설정값, 수익 요인(Profit Factor), 승률(Win Rate), 최대 낙폭(Drawdown) 및 기타 트레이딩 통계를 확인할 수 있습니다. 또한 DayTrader PR
Gartley Hunter Multi
Siarhei Vashchylka
5 (12)
Gartley Hunter Multi - An indicator for searching for harmonic patterns simultaneously on dozens of trading instruments and on all possible timeframes. Manual (Be sure to read before purchasing) | Version for MT4 Advantages 1. Patterns: Gartley, Butterfly, Shark, Crab. Bat, Alternate Bat, Deep Crab, Cypher 2. Simultaneous search for patterns on dozens of trading instruments and on all possible timeframes 3. Search for patterns of all possible sizes. From the smallest to the largest 4. All fou
FX Trend MT5 NG
Daniel Stein
5 (6)
FX Trend NG: 차세대 멀티 마켓 트렌드 인텔리전스 개요 FX Trend NG 는 다중 시간 프레임 기반의 전문 트렌드 분석 및 시장 모니터링 도구입니다. 몇 초 만에 전체 시장 구조를 파악할 수 있도록 설계되었습니다. 여러 차트를 일일이 전환할 필요 없이, 어떤 종목이 추세에 있는지, 어디에서 모멘텀이 약화되고 있는지, 그리고 어떤 시간 프레임이 서로 정렬되어 있는지 즉시 확인할 수 있습니다. 출시 기념 특별 혜택 – FX Trend NG 를 $30 (6개월) 또는 $80 평생 라이선스 로 이용할 수 있습니다. 이미 Stein Investments 고객이신가요? -> 메시지를 보내 전용 고객 그룹에 참여하세요. 설정이나 사용 방법이 필요하신가요? -> Stein Investments 공식 페이지 를 방문하세요. 1. FX Trend NG가 특별한 이유 3단계 추세 로직 – 단순한 Buy / Sell이 아닙니다 • 대부분의 지표는 Buy 또는 Sell 두 가지 상태만 제
제작자의 제품 더 보기
This easy to setup indicator shows you the market volumes in a different way, with support and resistance as showed. You can setup: - Backdays volume to show - Heiken Ashi candle view It works for every kind of graph and every kind of period. The program shows the volumes based on the number of candles displayed in the chart: the more candles the more volumes. Enjoy this very useful indicator. Please feel free to message me to report any kind of improvements! :D
Liquidity Oscillator
Paolo Scopazzo
3 (2)
A powerful oscillator that provide Buy and Sell signals by calculating the investor liquidity. The more liquidity the more buy possibilities. The less liquidity the more sell possibilities. Please download the demo and run a backtest! HOW IT WORKS: The oscillator will put buy and sell arrow on the chart in runtime only . Top value is 95 to 100 -> Investors are ready to buy and you should follow. Bottom value is 5 to 0 -> Investors are ready to sell and you should follow. Alert + sound will appe
HeatMap viewer
Paolo Scopazzo
Showing like in the picture or in the logo  multiple pair, multiple timeframes, multiple indicators in the same time , allowing you to click and go straight on that pair. The indicator will change like a Carosello every 3 seconds and will show you the indicator values also by background color to check in a very fast way if its oversold or overbought . Feel free to ask for adding new pair or indicator , i will update it for free. Pair managed: EURUSD, GBPUSD, USDJPY, AUDUSD, USDCHF. Indicator man
# Adaptive Slope Ribbon - ATR-normalised regression slope ribbon *Category: Trend | Difficulty: intermediate | Window: separate window below the chart | Markets: Universal (Forex, indices, commodities, crypto, stocks) | Suggested timeframes: M15, M30, H1, H4, D1* ## Short description > Five linear regression slopes over growing horizons, normalised in ATR units and comparable across instruments. The histogram shows the mean slope coloured by the level of agreement between time scales. ## Fu
# Fractal Trend Channel - Structural channel from confirmed swings *Category: Trend | Difficulty: beginner | Window: chart window (overlaid on price) | Markets: Universal (Forex, indices, commodities, crypto, stocks) | Suggested timeframes: M15, M30, H1, H4, D1* ## Short description > Step channel built from the last confirmed fractal swings, with a midline coloured by market structure: higher highs and lows, lower highs and lows, or mixed structure. ### Overview Reading structure through
# Volatility Adaptive MA - Variable speed moving average *Category: Trend | Difficulty: intermediate | Window: chart window (overlaid on price) | Markets: Universal (Forex, indices, commodities, crypto, stocks) | Suggested timeframes: M5, M15, M30, H1, H4* ## Short description > A moving average whose smoothing factor is driven by the ratio between short and long term volatility: it accelerates during breakouts and slows down in compressed phases, cutting false crossovers. ### Overview Eve
# Trend Persistence Index - Persistence versus randomness *Category: Trend | Difficulty: advanced | Window: separate window below the chart | Markets: Universal (Forex, indices, commodities, crypto, stocks) | Suggested timeframes: M30, H1, H4, D1* ## Short description > Compares the direction changes actually observed with those expected from a purely random series. Above zero the market persists in one direction, below zero it keeps flipping. ### Overview In a random walk the sign of the
# Kalman Trend Filter - Level and velocity Kalman filter *Category: Trend | Difficulty: advanced | Window: chart window (overlaid on price) | Markets: Universal (Forex, indices, commodities, crypto, stocks) | Suggested timeframes: M15, M30, H1, H4, D1* ## Short description > A two state Kalman filter that simultaneously estimates price level and velocity. The gain self-adjusts: it trusts the model when data are consistent and re-adapts immediately to shocks. ### Overview The Kalman filter
# Multi Scale Trend Agreement - Consensus across eight horizons *Category: Trend | Difficulty: beginner | Window: separate window below the chart | Markets: Universal (Forex, indices, commodities, crypto, stocks) | Suggested timeframes: M5, M15, M30, H1, H4, D1* ## Short description > Checks price position against its own average on eight geometrically spaced scales and condenses the result into a single score from -100 to +100. ### Overview A trend worth the name is recognised from whatev
# Directional Efficiency - Net path versus gross path *Category: Trend | Difficulty: intermediate | Window: separate window below the chart | Markets: Universal (Forex, indices, commodities, crypto, stocks) | Suggested timeframes: M15, M30, H1, H4, D1* ## Short description > Signed ratio between the net distance travelled by price and the gross path actually covered. It separates straight trends from disorderly advances that burn capital. ### Overview Two markets can rise by the same amoun
# Trend Age Counter - Regime age versus typical duration *Category: Trend | Difficulty: intermediate | Window: separate window below the chart | Markets: Universal (Forex, indices, commodities, crypto, stocks) | Suggested timeframes: M30, H1, H4, D1* ## Short description > Counts how many bars the current regime has lasted and compares it with the average duration of all past regimes on the same instrument. It measures trend maturity, not strength. ### Overview Every trend indicator answer
# Regression Confidence Baseline - Bands on residual error *Category: Trend | Difficulty: intermediate | Window: chart window (overlaid on price) | Markets: Universal (Forex, indices, commodities, crypto, stocks) | Suggested timeframes: M15, M30, H1, H4, D1* ## Short description > Linear regression baseline with bands built on the residual standard error instead of the price standard deviation. Bands widen when the move loses order, not when price runs. ### Overview Classic volatility band
# Trend Exhaustion Meter - Composite exhaustion score *Category: Trend | Difficulty: advanced | Window: separate window below the chart | Markets: Universal (Forex, indices, commodities, crypto, stocks) | Suggested timeframes: M30, H1, H4, D1* ## Short description > A 0 to 100 score combining stretch from the mean, directional saturation and momentum fade. It measures the continuation risk of a move, not its reversal. ### Overview No single symptom says a trend is about to end, but when se
# Normalized Momentum Z - Momentum in standard scores *Category: Momentum | Difficulty: intermediate | Window: separate window below the chart | Markets: Universal (Forex, indices, commodities, crypto, stocks) | Suggested timeframes: M15, M30, H1, H4, D1* ## Short description > Standardises momentum against its own recent historical distribution and returns a z score. A value of +2 marks a thrust stronger than roughly 97 per cent of the instrument recent moves. ### Overview Raw momentum ha
# Momentum Curvature - Acceleration versus velocity *Category: Momentum | Difficulty: intermediate | Window: separate window below the chart | Markets: Universal (Forex, indices, commodities, crypto, stocks) | Suggested timeframes: M15, M30, H1, H4, D1* ## Short description > Measures price acceleration, the second derivative of the smoothed series, and compares it with velocity. It detects loss of thrust before direction changes. ### Overview Anyone who drives knows the brake pedal acts o
# Rate Of Change Spectrum - Which horizon is driving *Category: Momentum | Difficulty: advanced | Window: separate window below the chart | Markets: Universal (Forex, indices, commodities, crypto, stocks) | Suggested timeframes: M30, H1, H4, D1* ## Short description > Standardises the rate of change over six horizons and identifies which one is driving the move. It shows the dominant scale score and its rank. ### Overview Knowing the market is rising tells you little. Knowing whether it ri
# Impulse Strength Gauge - Movement weighted by volume *Category: Momentum | Difficulty: intermediate | Window: separate window below the chart | Markets: Universal (Forex, indices, commodities, crypto, stocks) | Suggested timeframes: M5, M15, M30, H1, H4* ## Short description > Weights every bar by combining body size in ATR units with volume relative to its average, then accumulates the contributions. It separates wide but empty bars from genuinely supported impulses. ### Overview A wide
# Dual Horizon Momentum Delta - Short versus long, time corrected *Category: Momentum | Difficulty: advanced | Window: separate window below the chart | Markets: Universal (Forex, indices, commodities, crypto, stocks) | Suggested timeframes: M15, M30, H1, H4, D1* ## Short description > Compares momentum on two horizons after normalising them by the square root of time, a correction without which the long horizon would always look larger by pure construction. ### Overview Directly comparing
# Impulse Retrace Ratio - Impulse size versus retracement size *Category: Momentum | Difficulty: intermediate | Window: separate window below the chart | Markets: Universal (Forex, indices, commodities, crypto, stocks) | Suggested timeframes: M15, M30, H1, H4, D1* ## Short description > Groups consecutive same sign changes into runs and compares the average size of bullish runs with that of bearish ones. It measures whether impulses are larger, not more numerous. ### Overview A healthy upt
# Momentum Thrust Counter - Counting thrusts beyond threshold *Category: Momentum | Difficulty: beginner | Window: separate window below the chart | Markets: Universal (Forex, indices, commodities, crypto, stocks) | Suggested timeframes: M15, M30, H1, H4, D1* ## Short description > Counts bars moving beyond an ATR multiple and reports the net balance. The total line separates calm from battle, both of which show a balance near zero. ### Overview Most bars on a chart carry no information: t
# Momentum Divergence Scanner - Divergences without repaint *Category: Momentum | Difficulty: intermediate | Window: chart window (overlaid on price) | Markets: Universal (Forex, indices, commodities, crypto, stocks) | Suggested timeframes: M15, M30, H1, H4, D1* ## Short description > Flags price to momentum divergences using confirmed swings only. The arrow appears on confirmation and is never withdrawn, unlike almost every other divergence indicator. ### Overview Almost every divergence
# Elastic Momentum Band - Momentum driven asymmetric channel *Category: Momentum | Difficulty: intermediate | Window: chart window (overlaid on price) | Markets: Universal (Forex, indices, commodities, crypto, stocks) | Suggested timeframes: M15, M30, H1, H4* ## Short description > A channel deforming with momentum: the band favouring the move draws closer to the average, the opposite one moves away. It makes breaks in direction easier and counter breaks more selective. ### Overview A symm
# Momentum Entropy Filter - Order versus randomness in thrusts *Category: Momentum | Difficulty: advanced | Window: separate window below the chart | Markets: Universal (Forex, indices, commodities, crypto, stocks) | Suggested timeframes: M30, H1, H4, D1* ## Short description > Computes the Shannon entropy of the recent momentum distribution and converts it into an order score from 0 to 100. It separates markets with recurring structure from those without regularity. ### Overview Shannon e
# Realized Volatility Cone - Historical volatility percentiles *Category: Volatility | Difficulty: intermediate | Window: separate window below the chart | Markets: Universal (Forex, indices, commodities, crypto, stocks) | Suggested timeframes: M30, H1, H4, D1* ## Short description > Draws realized volatility together with the percentiles of its own historical distribution. It tells whether the current level is high or low for that specific instrument. ### Overview Knowing that realized vo
# Volatility Forecast EWMA - Forecasting the next bar *Category: Volatility | Difficulty: advanced | Window: separate window below the chart | Markets: Universal (Forex, indices, commodities, crypto, stocks) | Suggested timeframes: M15, M30, H1, H4, D1* ## Short description > Estimates next bar volatility with an EWMA model on variance, the same scheme used in portfolio risk management, alongside the volatility actually observed. ### Overview Every volatility indicator looks backwards and
# Volatility Regime Classifier - Classification with hysteresis *Category: Volatility | Difficulty: intermediate | Window: separate window below the chart | Markets: Universal (Forex, indices, commodities, crypto, stocks) | Suggested timeframes: M15, M30, H1, H4, D1* ## Short description > Classifies volatility into four regimes using a hysteresis state machine, eliminating the constant flipping typical of fixed thresholds. The active threshold is drawn. ### Overview Classifying volatility
# Overnight Gap Risk - The risk stops cannot cover *Category: Volatility | Difficulty: intermediate | Window: separate window below the chart | Markets: Stocks | Suggested timeframes: H1, H4, D1* ## Short description > Splits each bar change into gap and intra-bar movement, and reports the share of risk attributable to gaps, the part no stop can protect against. ### Overview The risk of a position held past the close is not the same as that of the same position closed intraday, and the dif
# Volatility Breakout Projection - Levels projected from the open *Category: Volatility | Difficulty: beginner | Window: chart window (overlaid on price) | Markets: Universal (Forex, indices, commodities, crypto, stocks) | Suggested timeframes: M5, M15, M30, H1* ## Short description > Anchors a reference to each session open and projects two pairs of levels computed as fractions of the average daily range. Levels stay fixed for the whole session. ### Overview If an instrument covers on ave
# Compression Expansion Detector - Squeeze and release *Category: Volatility | Difficulty: intermediate | Window: separate window below the chart | Markets: Universal (Forex, indices, commodities, crypto, stocks) | Suggested timeframes: M15, M30, H1, H4, D1* ## Short description > Measures how far short term volatility has narrowed relative to the reference, counts how many bars the compression has lasted and highlights the bars following the release. ### Overview Volatility is not stable:
# Intraday Volatility Seasonality - Hourly volatility profile *Category: Volatility | Difficulty: intermediate | Window: separate window below the chart | Markets: Universal (Forex, indices, commodities, crypto, stocks) | Suggested timeframes: M5, M15, M30, H1* ## Short description > Builds the instrument average hourly volatility profile and compares it with the actual range of the current bar. It separates normally quiet hours from genuine anomalies. ### Overview Intraday volatility is n
필터:
리뷰 없음
리뷰 답변