Dynamic Trend Fill Pro
- Indicators
- Version: 1.0
- Activations: 5

Dynamic Trend Fill Pro is an advanced trend-visualization indicator that reveals market structure using the dynamic relationship between two channel systems.
Traditional moving-average indicators often lag excessively during ranging markets. By calculating the difference between market Noise and true Signal momentum, this indicator automatically adjusts its smoothing factor—reacting quickly in trending conditions while remaining stable during consolidation. This makes it highly suitable for today’s volatile trading environments.
The indicator consists of two channel layers. The Yellow Fill Zone represents the expansion and contraction of short-to-mid-term trends.
-
When the yellow area expands, market direction becomes clearer.
-
When it narrows, momentum weakens and the market enters consolidation or a potential trend transition.
The indicator also displays Red and Blue dynamic fill zones:
-
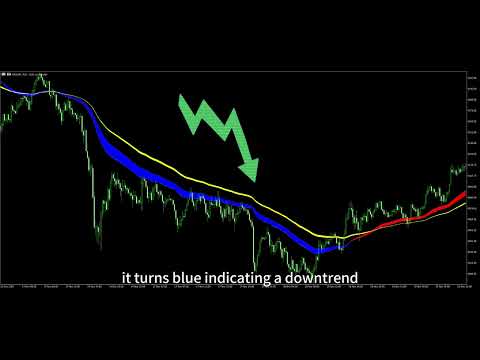
When price is above the yellow channel, red fill appears, indicating bullish strength.
-
When price is below the yellow channel, blue fill appears, signaling bearish momentum or a pullback phase.
This dual-layer structure helps traders identify trend direction, measure strength, filter false breakouts, and improve decision-making for entries, scaling-in, and exits.
Dynamic Trend Fill Pro works on all timeframes and instruments—Forex, gold, commodities, and indices—with particularly strong performance on gold analysis. Its intuitive visual design enhances understanding of price behavior, making it ideal for trend trading, swing trading, pullback trading, and multi-timeframe confirmation strategies. It is a professional yet highly practical tool for modern traders.
Indicator Structure
This indicator is composed of two channels: a fast channel and a slow channel.
The slow channel is displayed in yellow. The fast channel switches between red and blue.
When the fast channel is above the yellow channel, it turns red, indicating an uptrend.
When the fast channel is below the yellow channel, it turns blue, indicating a downtrend.
The red zone represents a support area, where buying is preferred.
The blue zone represents a resistance area, where selling is preferred.
The yellow zone acts as a strong support or strong resistance. When price breaks through this zone, the market may shift into a consolidation phase.
Practical Examples
① Strong Uptrend
A strong bullish trend must meet the following three conditions:
-
The red channel gradually expands.
-
The angle of the channel slopes upward.
-
The distance from the yellow channel increases.
During this period, only long positions should be taken, preferably when price pulls back near the red channel.
③ Strong Downtrend
A strong bearish trend must meet the following three conditions:
-
The blue channel gradually expands.
-
The angle of the channel slopes downward.
-
The distance from the yellow channel increases.
During this period, only short positions should be taken, preferably when price pulls back near the blue channel.
② Sideways / Ranging Market
The red or blue zones contract progressively and run parallel to, or frequently cross over and wrap around, the yellow channel.
In this environment, trades should be quick entries and quick exits.
Using multiple timeframes together can significantly improve accuracy.