Volumatic Fair Value Gaps MT5 Multi Timeframe
- Indicators
-
Duc Hoan Nguyen
 I develop practical trading tools for MetaTrader 4/5, with a focus on indicator integration, Multi-Timeframe analysis, market scanning, and automated trading solutions.
My work mainly includes:
• Indicator-to-EA Solutions - Version: 1.0
- Activations: 10
New tools will be $30 for the first week or the first 3 purchases!
Trading Tools Channel on MQL5: Join my MQL5 channel to update the latest news from me
See more MT5 version at: Volumatic Fair Value Gaps MT5 Multi Timeframe
See more MT4 version at: Volumatic Fair Value Gaps MT4 Multi Timeframe
See more products at: All Products
-
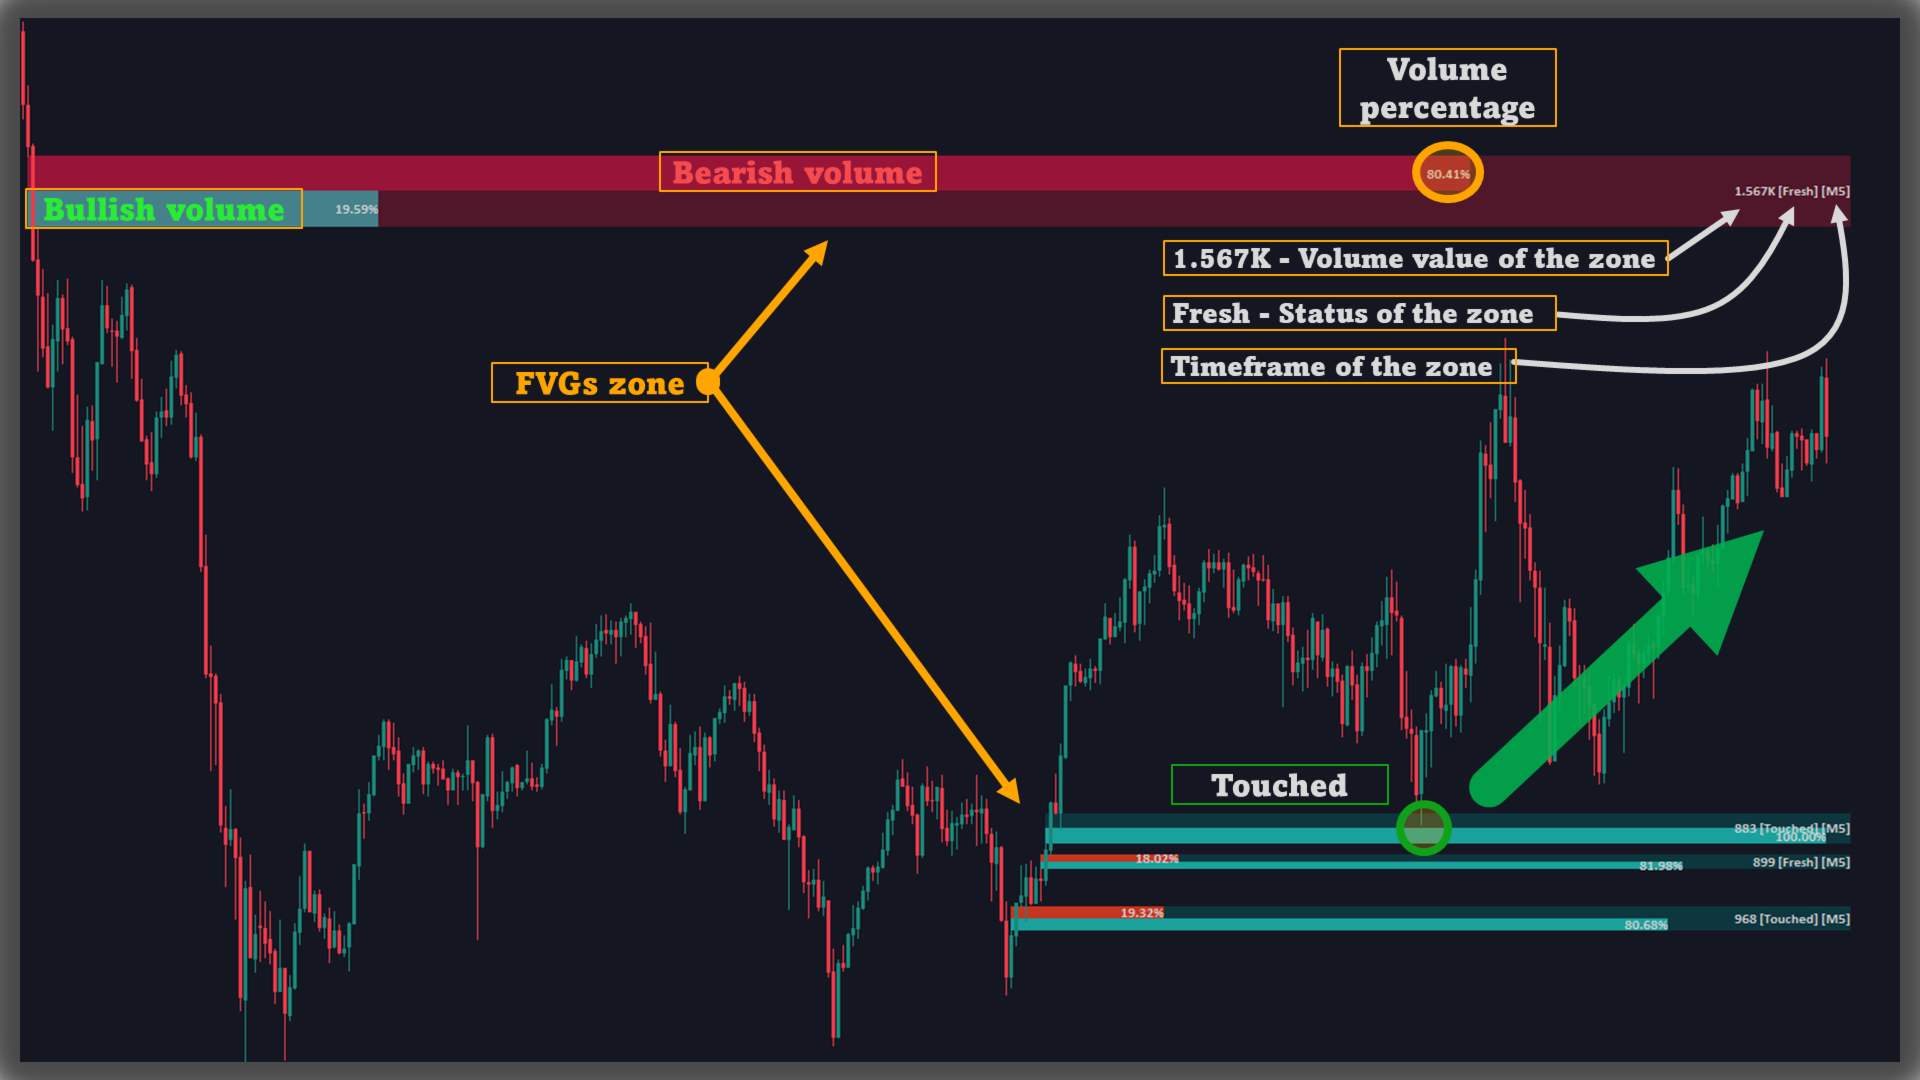
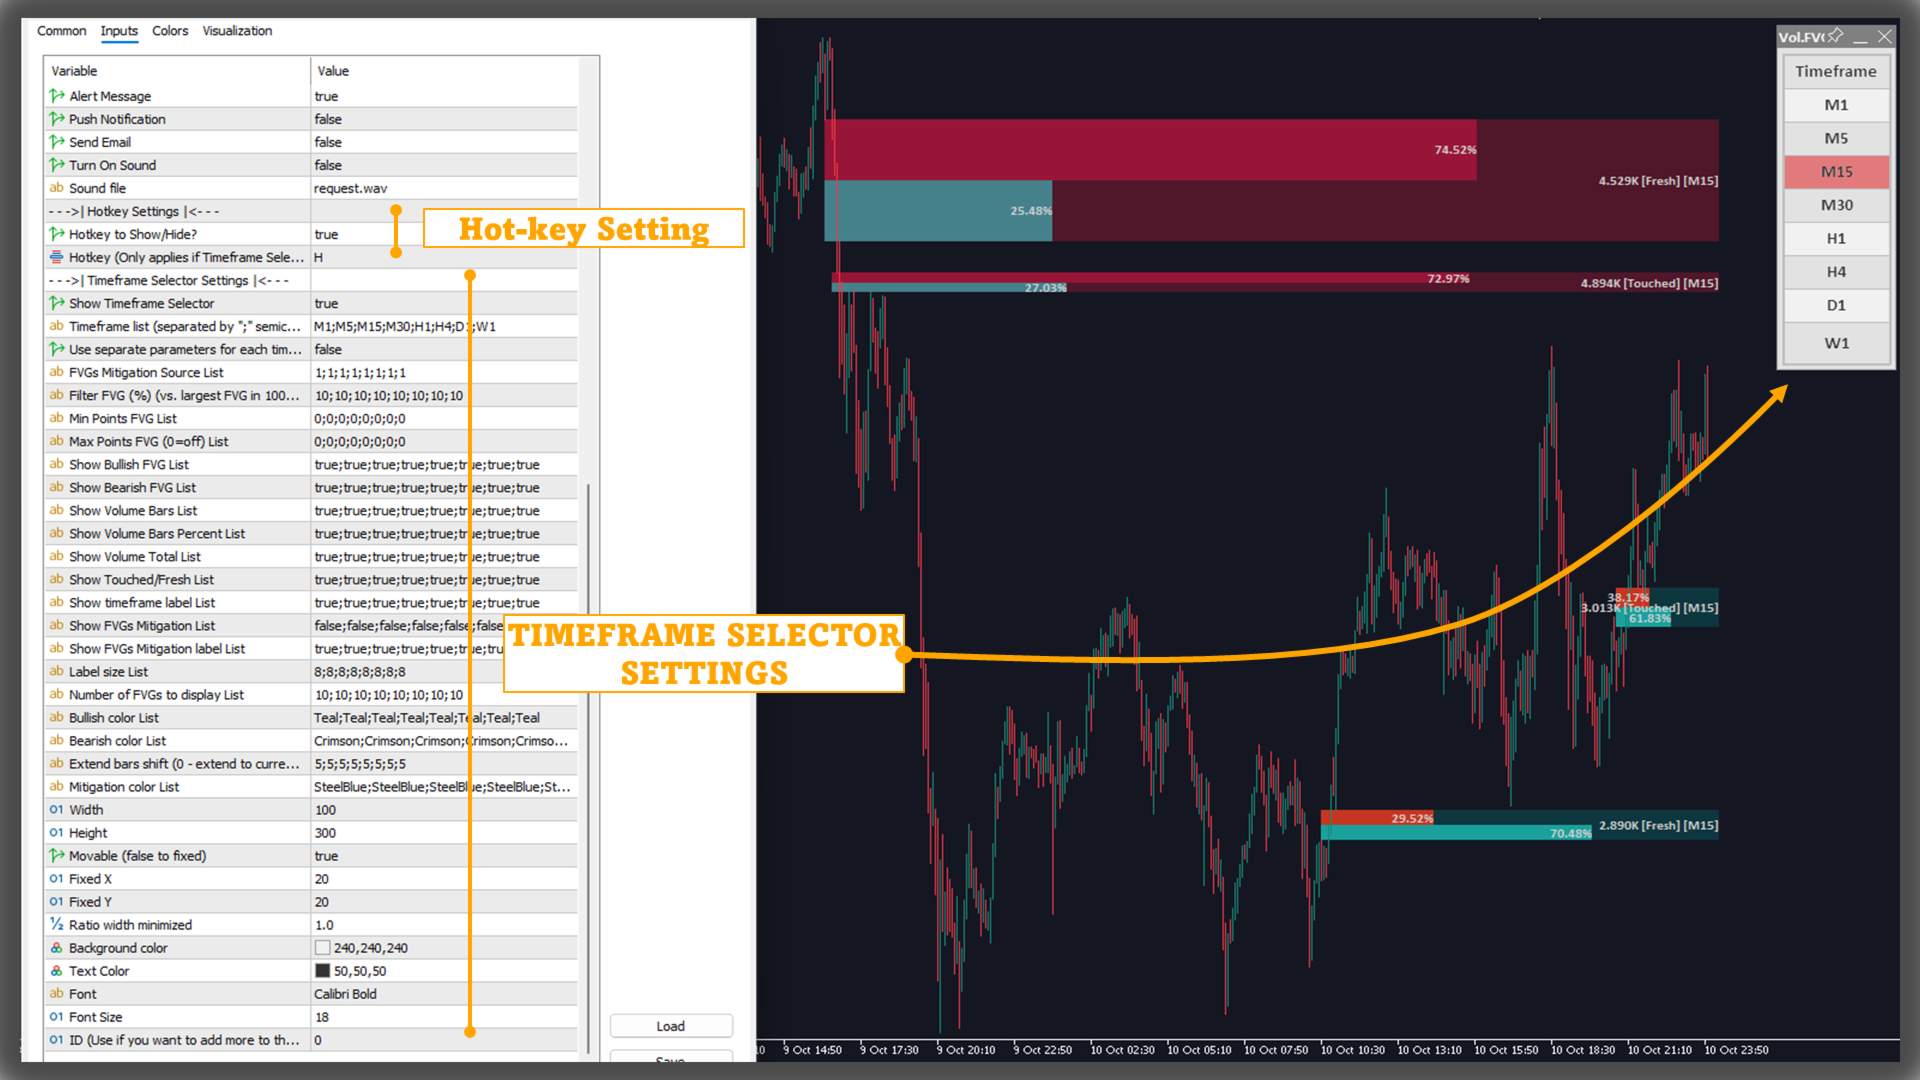
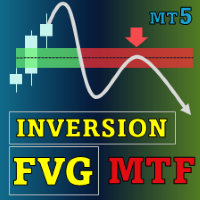
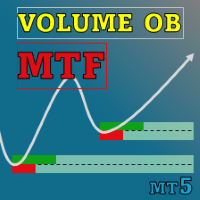
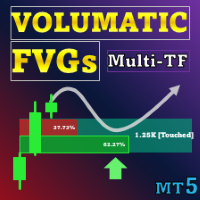
FVG definition: a three-candle imbalance where price “skips” trading; the tool plots bullish/bearish gaps and auto-extends them rightward until mitigation.
-
Size filtering: retains notable gaps via relative size percentile; optional minimum/maximum point thresholds adapt to symbol and timeframe characteristics.
-
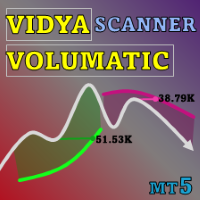
Volume breakdown: aggregates lower-TF volume inside each gap’s span, separates Bull/Bear contributions, and shows two inline % bars (sum = 100%) plus the gap’s total volume.
-
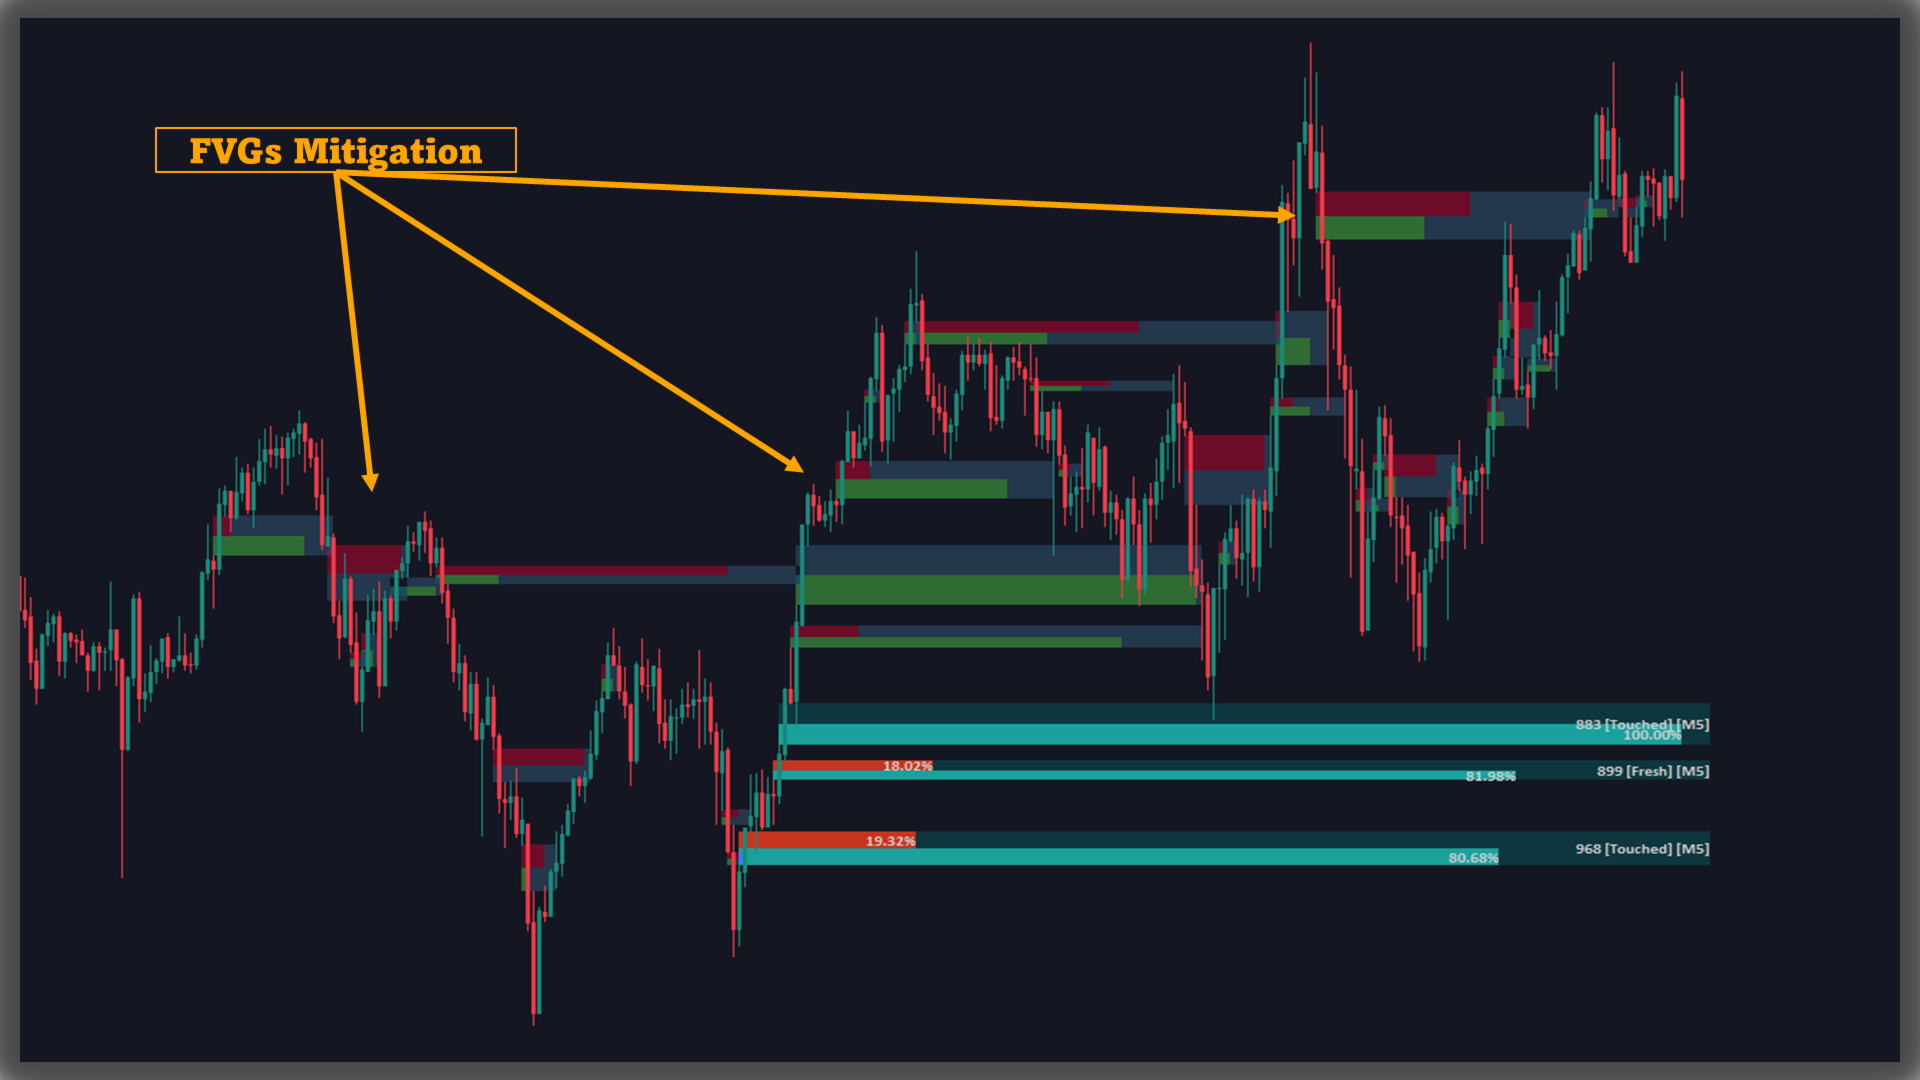
Mitigation: removal by closing price through the boundary or by wick touch, as configured.
-
Scan depth: limit how far back to evaluate historical bars (0 = full history).
-
Volume source timeframe: lower timeframe input (default M1).
-
Gap types: independently enable bullish and bearish FVGs.
-
Volume visuals: toggle the percentage bars and the total volume label per gap.
-
Fresh vs. Touched: indicate whether a gap remains untouched or has been contacted by price.
-
Labels and aesthetics: configure label size, gap colors, zone transparency, mitigation color and transparency, and (optionally) a timeframe label.
-
Right-extension: set how far the gap body projects to the right (0 = extend to the current bar).
-
Capacity limits: cap the maximum number of active FVGs to preserve responsiveness.
-
Alert events: on detection, touch, and mitigation of gaps.
-
Delivery channels: on-screen message, push notification, email, and sound (selectable audio file).
-
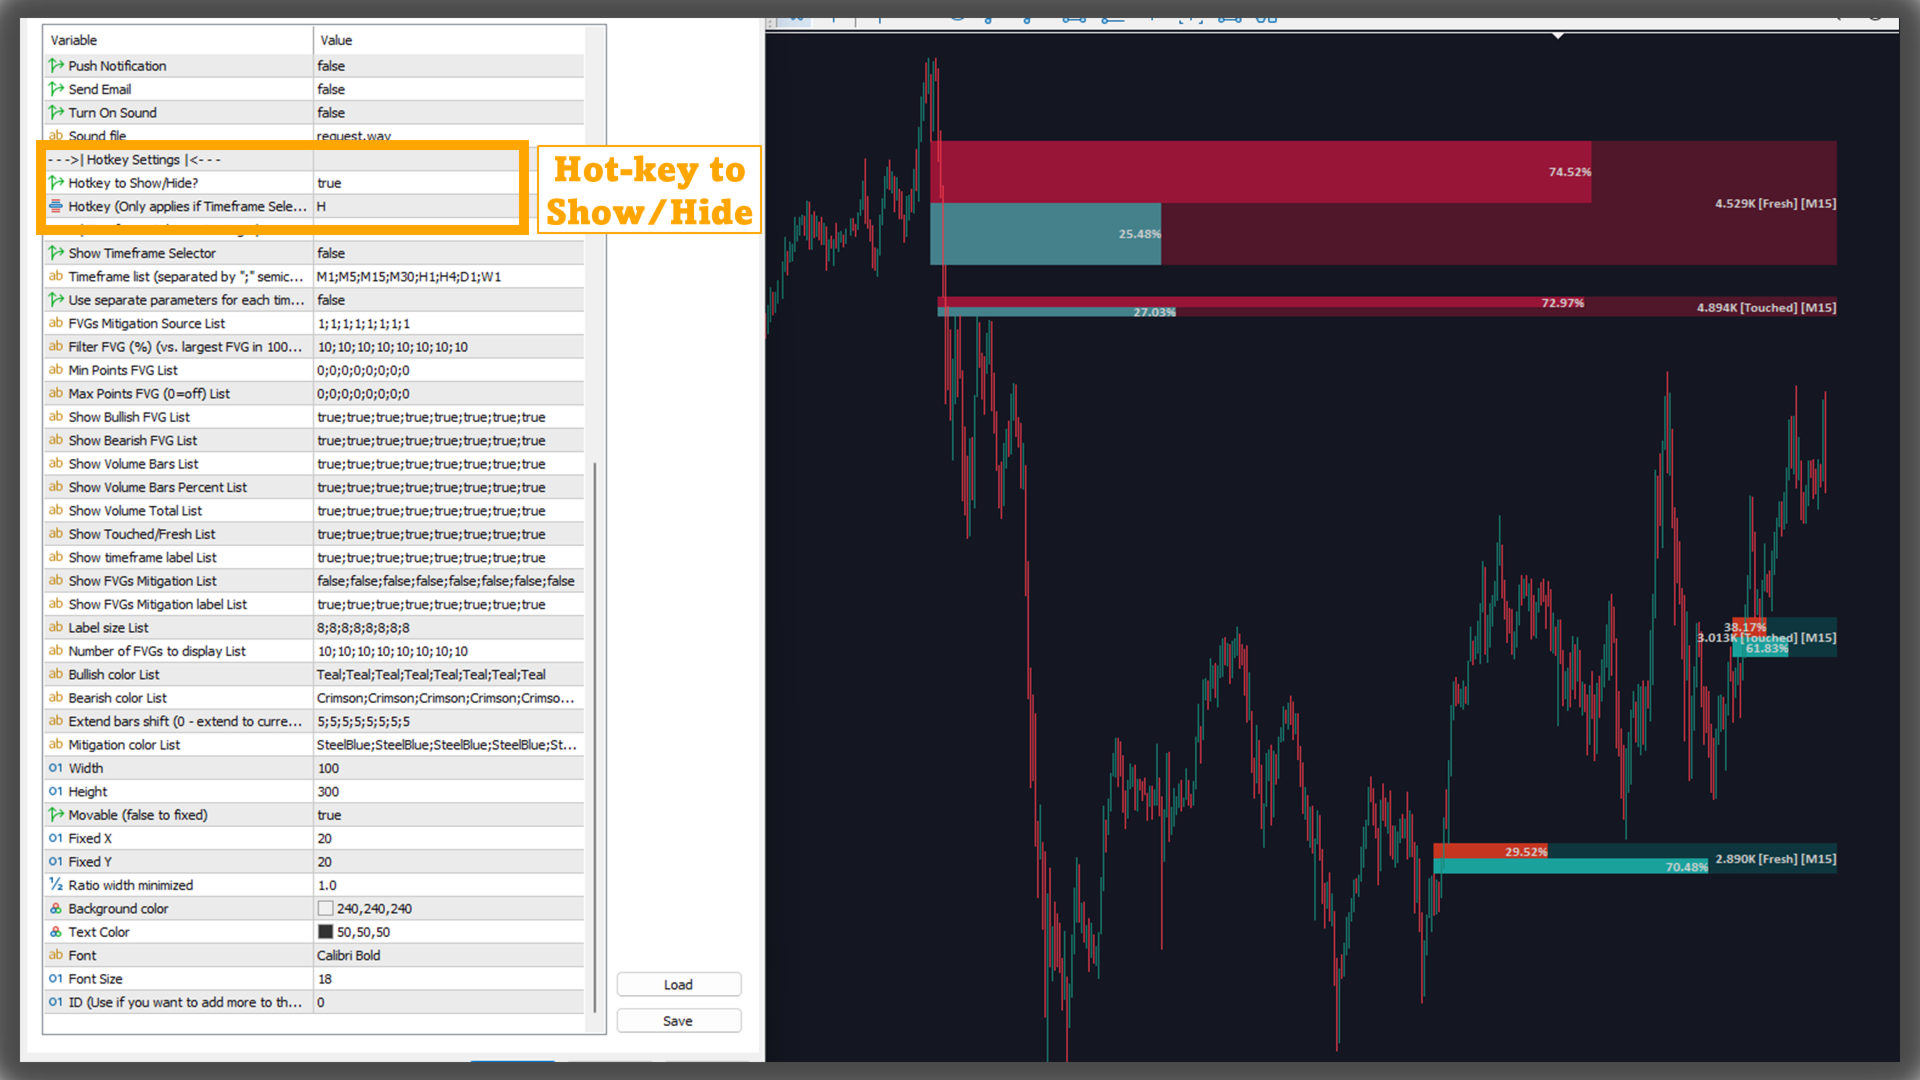
Hotkey toggle: optional keyboard shortcut to quickly show/hide FVG layers when the timeframe selector is not in use.
-
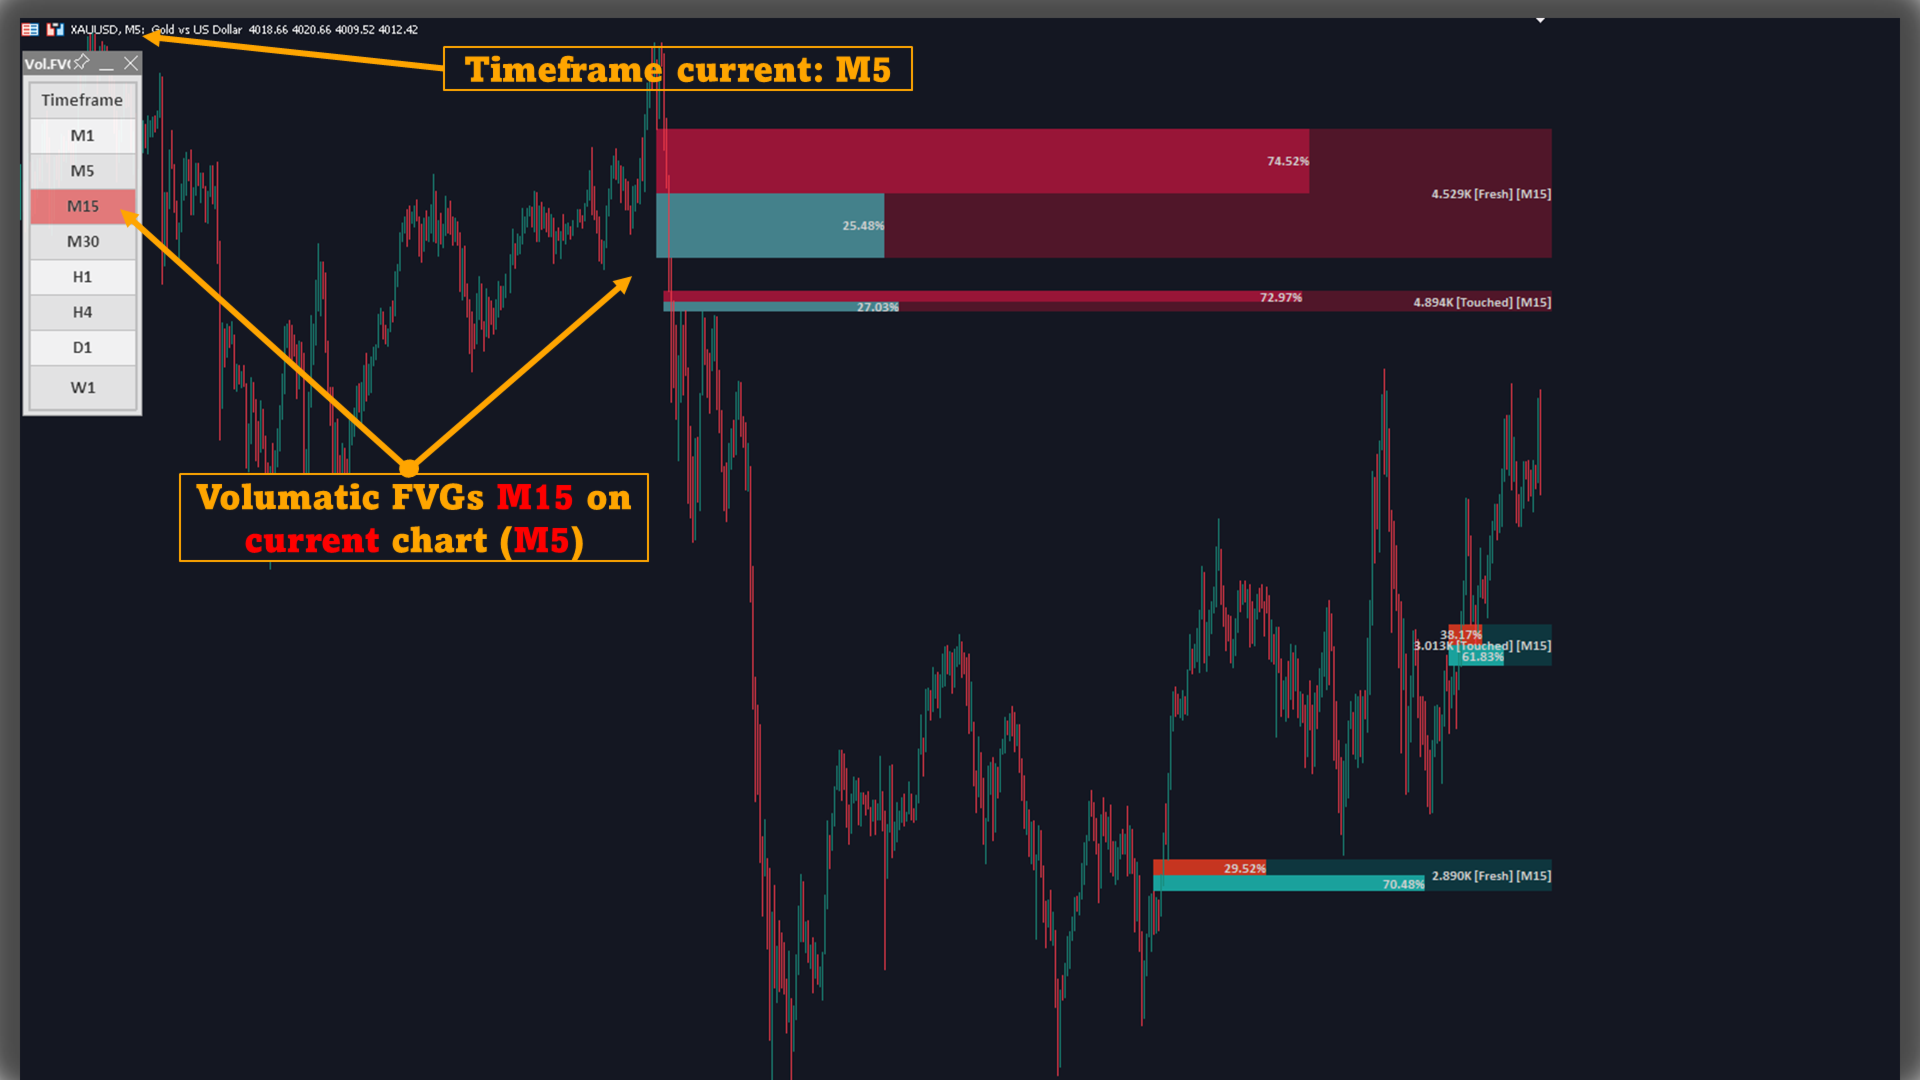
On-chart selector: show a compact panel with a predefined list of timeframes.
-
Per-timeframe presets: optionally maintain separate parameters by timeframe (size percentile, min/max points, volume visuals, Fresh/Touched, labels, capacity, colors, right-extension, mitigation options).
-
Panel layout: adjust width/height, movable vs. fixed position, background/text colors, font family and size to fit the chart layout.
-
Choose the volume source: start with M1 for detail; switch when the instrument’s liquidity/volatility suggests a different lower TF.
-
Tighten the filter: raise the relative size percentile and/or minimum points to focus on materially significant imbalances; use maximum points to exclude overly wide gaps.
-
Select mitigation mode:
-
Close-based: more conservative; removes only when a candle closes through the boundary.
-
High/low-based: more responsive; removes when a wick touches the boundary.
-
-
Read each gap’s evidence: interpret Bull/Bear % alongside the total gap volume to gauge directional participation at that imbalance.
-
Keep visuals efficient: tune transparency, right-extension, active-gap limit, and overlap control so the chart remains legible and performant.
Conclusion
The tool provides a structured framework centered on where imbalances exist and how volume participates within them. With flexible size filtering, per-gap Buy/Sell percentage bars and total volume labels, configurable mitigation, alerting options, and optional timeframe-specific presets, users can organize on-chart information consistently and adapt it to a wide range of market conditions.