Fusion Monthly Levels PinBar Marubozu

Fusion Monthly Levels + PinBar + Marubozu

📝 说明
这个独特的指标将三种强大的技术分析工具融合为一体:

  • 月度关键水平 (高点, 低点, 开盘价, 收盘价) —— 用于识别关键支撑与阻力区域。

  • PinBar 识别 —— 一种可靠的反转形态,提示价格的强力拒绝。

  • Marubozu 识别 —— 强烈的趋势型K线,显示出明显的方向性动能。

通过这种融合,您将获得一个 直观、全面且高效 的市场预测工具。

🚀 优势

  • 融合机构级别水平 + 价格行为 (Price Action)。

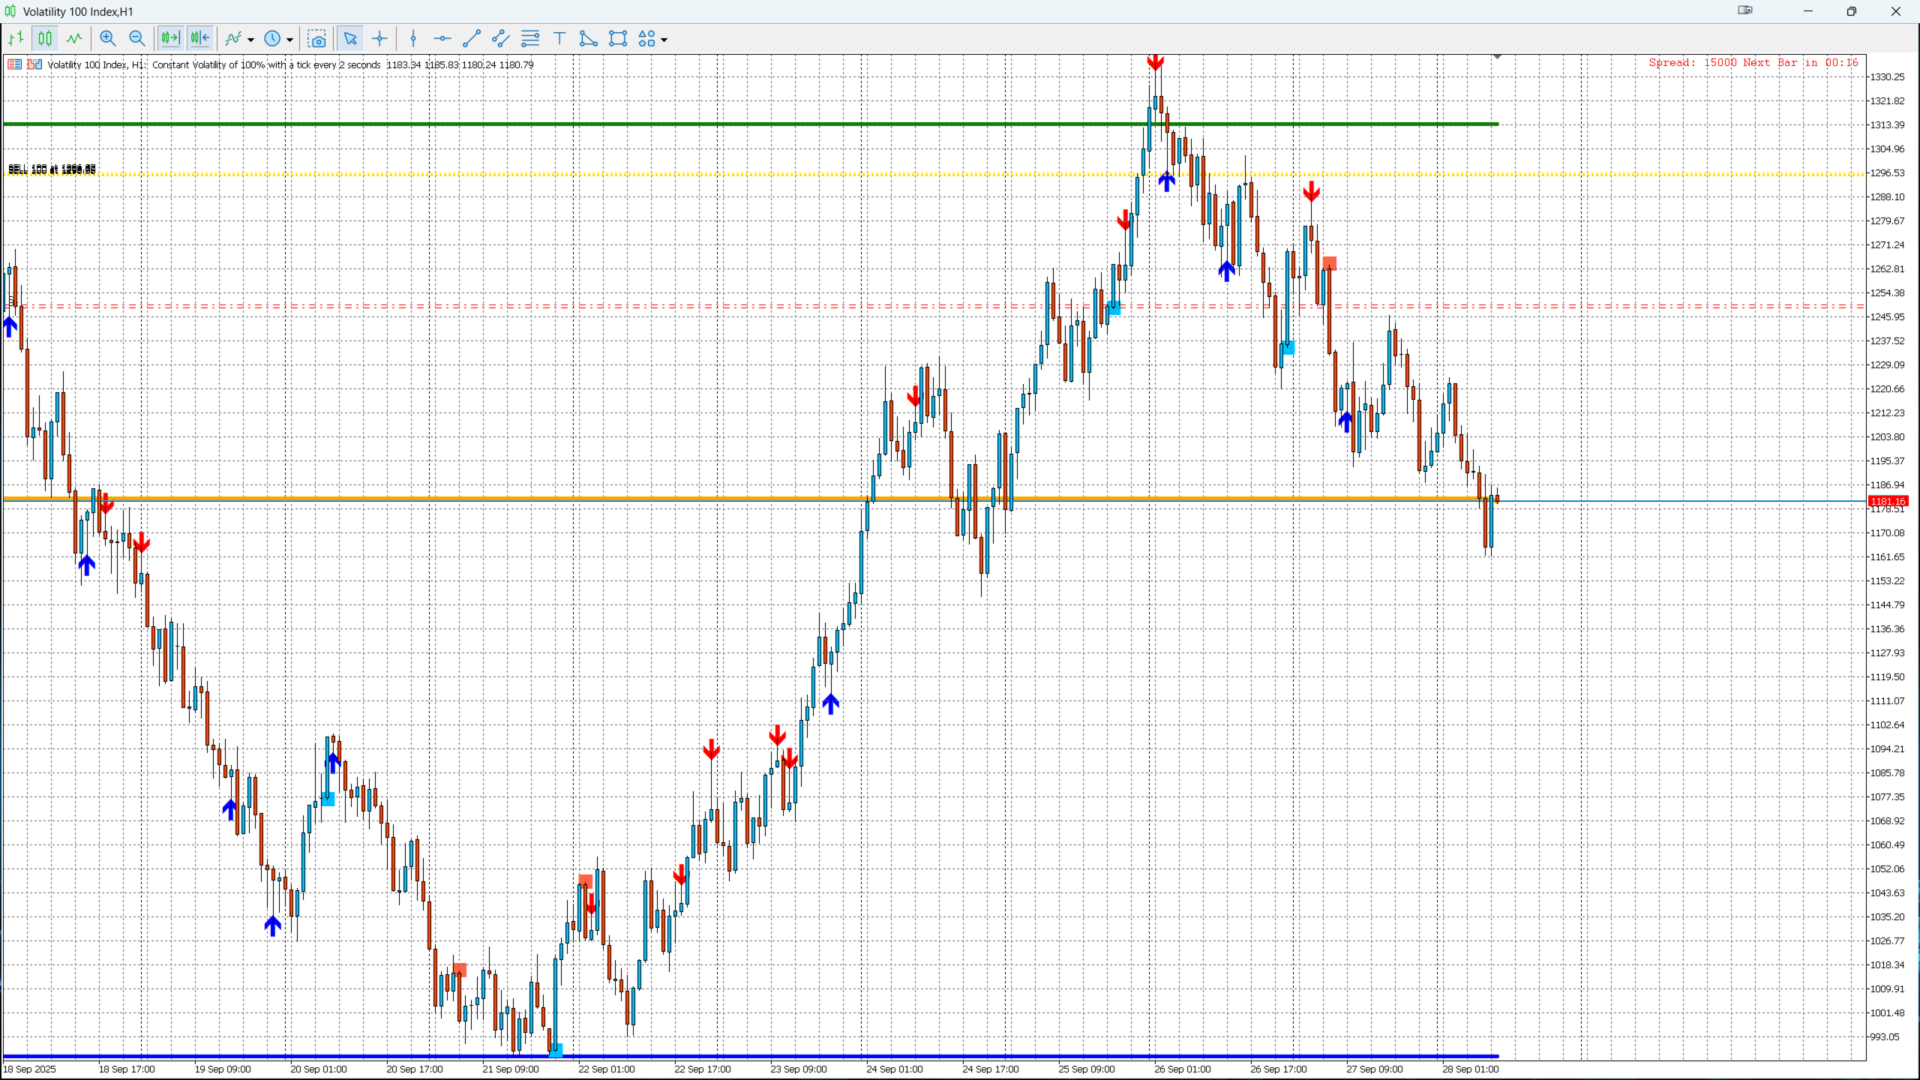
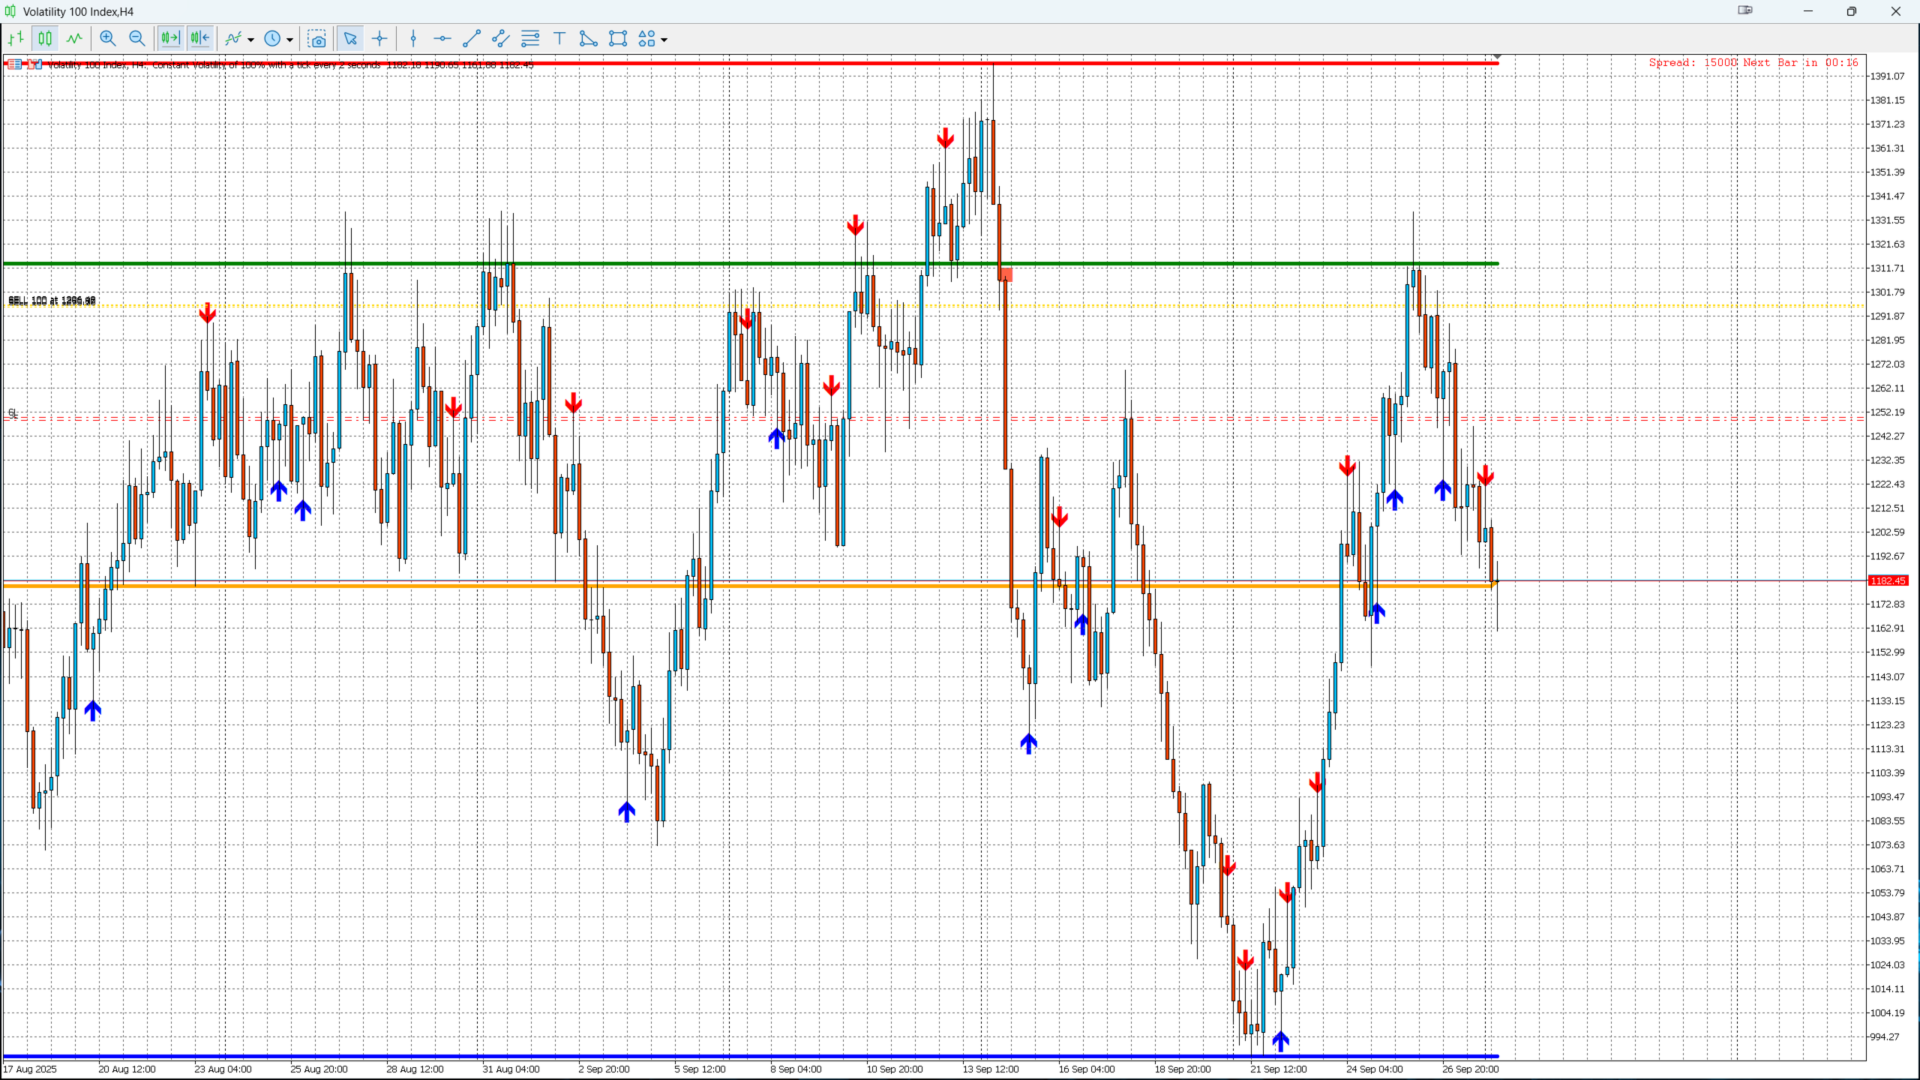
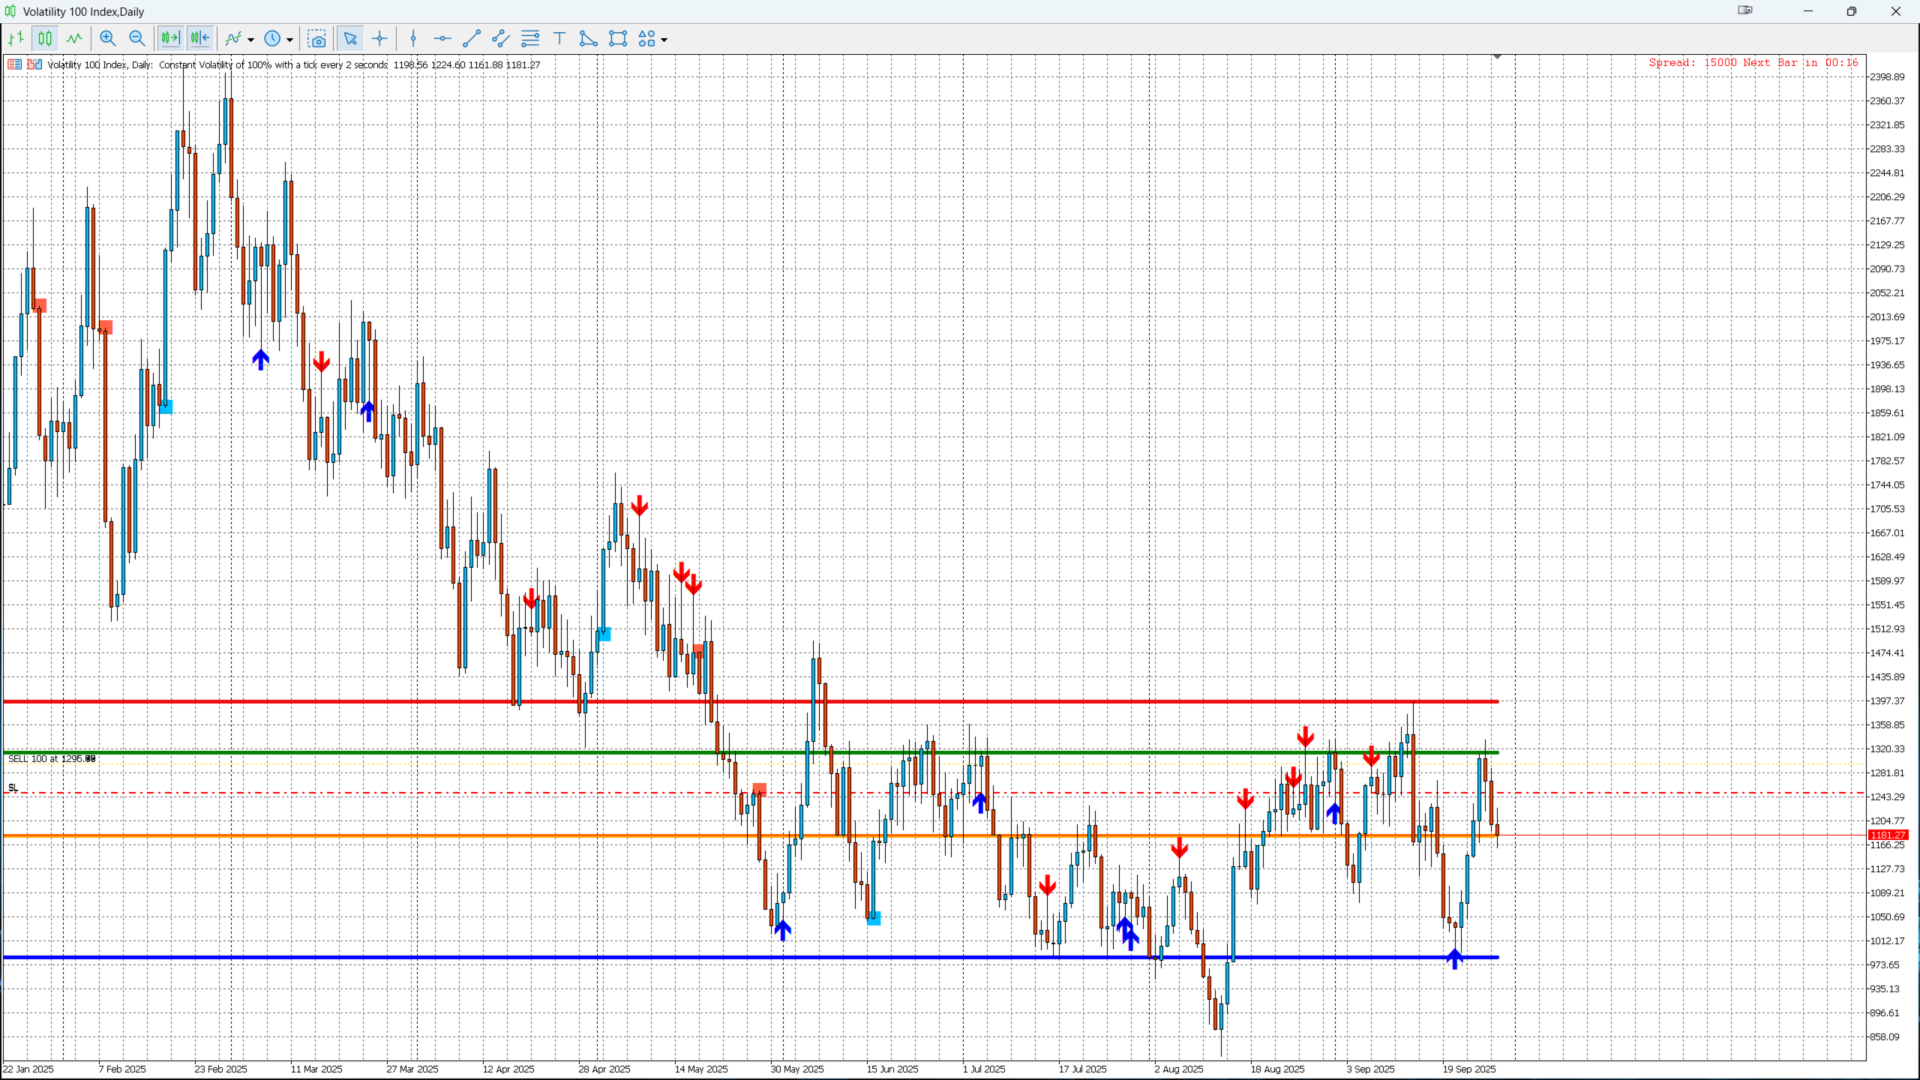
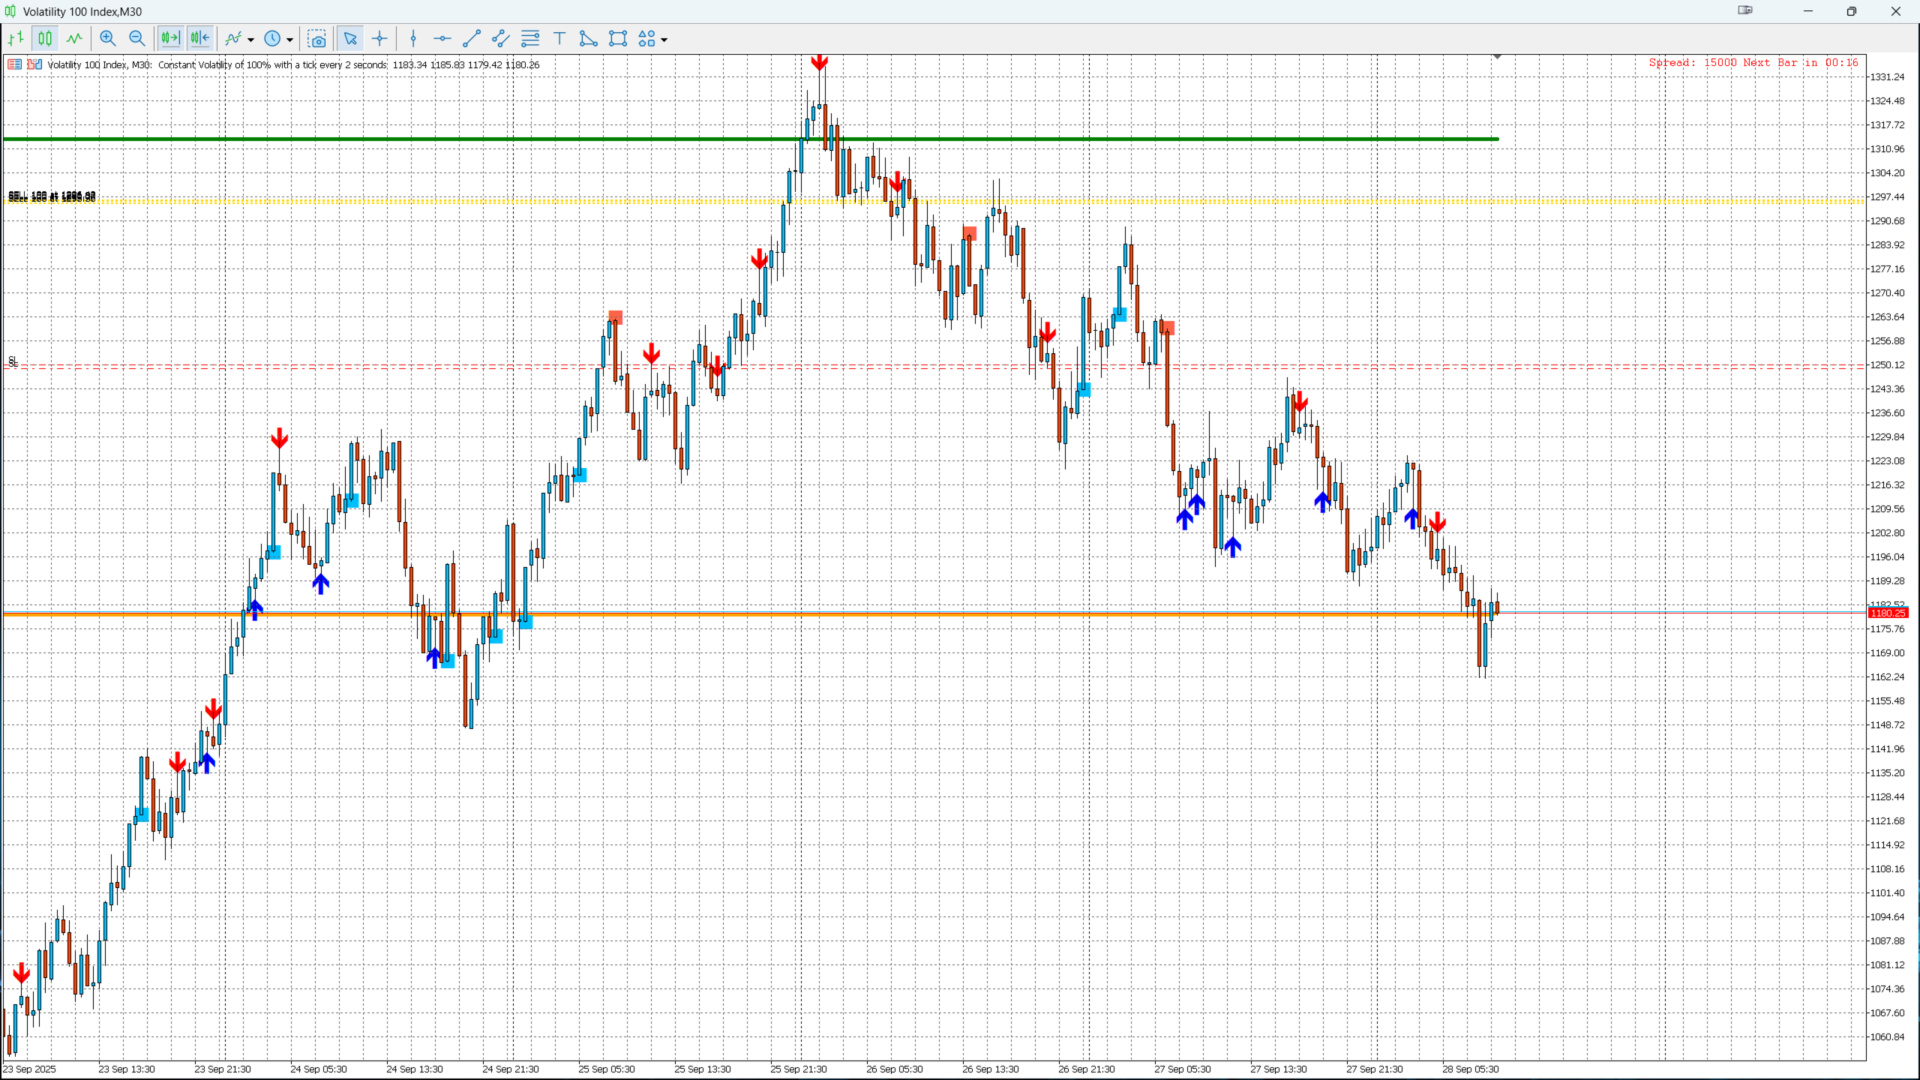
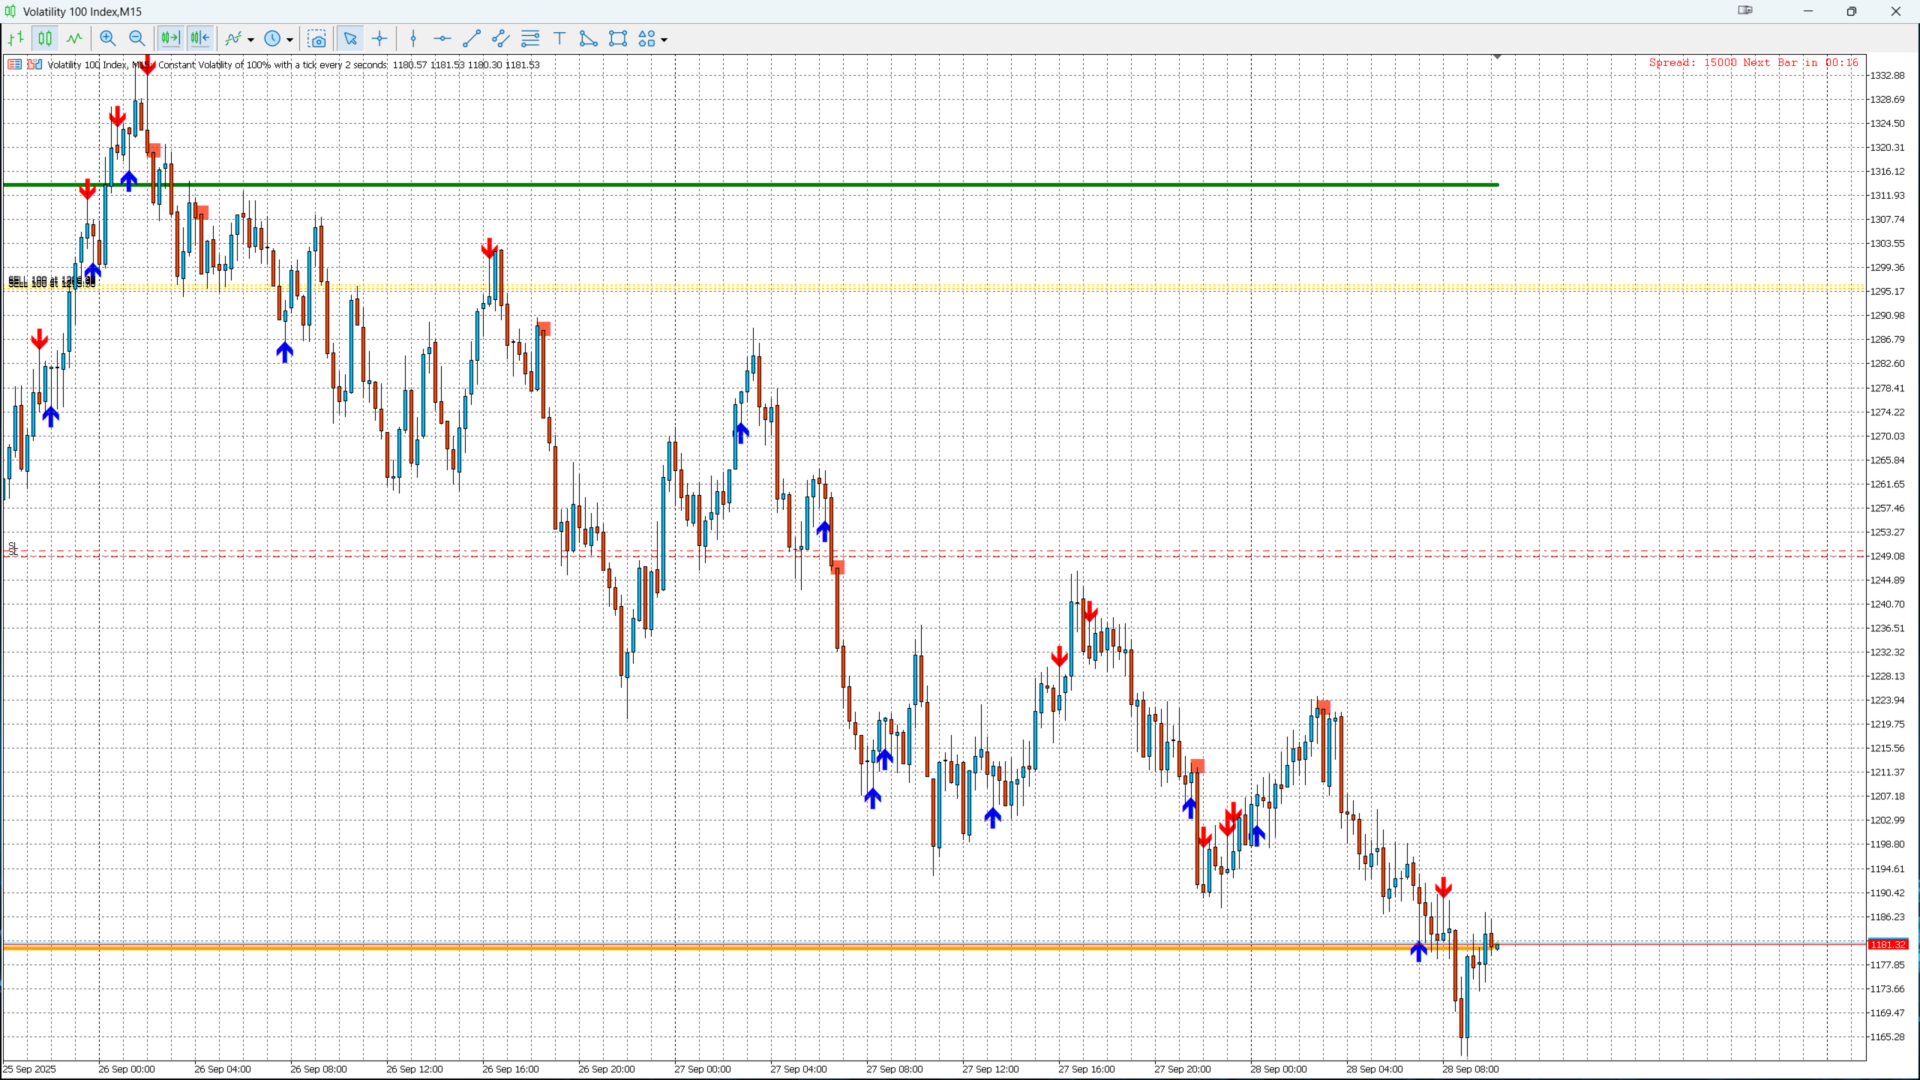
  • 清晰的视觉信号:蓝/红箭头表示 PinBar,蓝/红方块表示 Marubozu。

  • 适用于所有交易品种(外汇、指数、加密货币、大宗商品、股票)。

  • 可自定义参数(参考周期、影线大小、箭头样式)。

  • 代码优化,无延迟,即使在多个图表中使用。

  • 完全兼容 MetaTrader 5。

🔔 信号说明

  • 看涨 PinBar → 蓝色箭头在K线下方。

  • 看跌 PinBar → 红色箭头在K线上方。

  • 看涨 Marubozu → 蓝色方块在K线下方。

  • 看跌 Marubozu → 红色方块在K线上方。

月度水平线:

  • 红色 = 月高点 (High)

  • 蓝色 = 月低点 (Low)

  • 绿色 = 月开盘价 (Open)

  • 橙色 = 月收盘价 (Close)

⚙️ 参数设置

  • Ref_Timeframe → 选择参考周期(默认:月线)。

  • Arrow_Offset_Pts → 箭头/方块的垂直偏移量。

  • WickMaxRatio → 验证 Marubozu 的最大影线比例。

  • Wingdings Codes → 自定义符号(箭头、方块等)。

📊 使用方法

  1. 找出关键区域(月高点/月低点)。

  2. 等待 PinBar 或 Marubozu 在这些水平附近形成。

  3. 使用其他工具(趋势、成交量、指标)进行确认。

  4. 适用于剥头皮、日内交易和波段交易。

🎯 适合人群

  • 价格行为 (Price Action) 交易者。

  • 希望使用一体化指标简化图表的交易者。

  • 想要提前预判反转与趋势延续的新手和专业交易者。


推荐产品
Owl Smart Levels MT5
Sergey Ermolov
4.03 (32)
MT4版本  |   FAQ Owl Smart Levels Indicator 是一個完整的交易系統,包含 Bill Williams 的高級分形、構建正確的市場波浪結構的 Valable ZigZag 以及標記準確入場水平的斐波那契水平等流行的市場分析工具 進入市場和地方獲利。 策略的详细说明 指示灯使用说明 顾问-贸易猫头鹰助手助理 私人用户聊天 ->购买后写信给我,我会将您添加到私人聊天中,您可以在那里下载所有奖金 力量在於簡單! Owl Smart Levels 交易系統非常易於使用,因此適合專業人士和剛開始研究市場並為自己選擇交易策略的人。 策略和指標中沒有隱藏的秘密公式和計算方法,所有策略指標都是公開的。 Owl Smart Levels 允許您快速查看進入交易的信號,突出顯示下訂單的水平並向您發送有關已出現信號的通知。 優點很明顯: 清楚地顯示主要和更高時間框架的趨勢方向。 指示儀器信號的出現。 標記開單、止損設置和固定利潤的水平。 沒有多餘的,只有必要的結構! ZigZag 表示全球趨勢的方向,因此也表示貿易方向。 市場反轉點的短線清楚地表明在什麼水平上構建斐波那
Fibaction
Abdelkhalek Orabi
Indicator Name: Fibaction – price action candle Detector Description: Fibo Signal Boxes is a powerful Smart Money Concept (SMC)-inspired indicator that auto-detects price action candles. bullish hammers and shooting stars, then draws precise Fibonacci entry zones and multiple take-profit levels directly on the chart. as for the SL personally i use 40 pips rules  Key Features: Detects bullish hammer and shooting star reversal candles. Automatically draws Fibonacci entry and TP boxes. as
PZ Support Resistance MT5
PZ TRADING SLU
3.71 (7)
厌倦了绘制支撑线和阻力线? 支撑阻力 是一个多时间指标,可以自动检测并绘制图表中的支撑线和阻力线,并具有非常有趣的变化:随着时间的推移测试价格水平及其重要性的提高,线变得越来越粗。 [ 安装指南 | 更新指南 | 故障排除 | 常见问题 | 所有产品 ] 一夜之间增强您的技术分析 无需浏览图表即可检测重要的价格水平 一目了然地识别所有价格水平的相对优势 每次交易最多可节省半小时的绘图线 指标显示所有价格水平的期限 指示器不重涂 过去和现在的价格水平因接近程度而崩溃,并根据当前的市场行为进行了调整。在动作发生的地方绘制了线条,而不一定在峰值处绘制了线条。 价格水平随着时间的推移而被拒绝,变得越来越暗 定期清除不重要的价格水平以避免噪音 可自定义的时间范围选择和崩溃因子 它实现了电子邮件/声音/推送警报的突破 输入参数 指标设置:指标将从当前时间段读取价格,但您可以选择另一个。例如,您可以在H4图表中显示D1支撑线和阻力线。您还可以使用 价格水平密度 参数选择在图表上显示多少价格水平。 颜色设置:根据重要性输入所需的支撑线和阻力线颜色。 标签设置:(可选)可以在指示器中显示用于
PipFinite Exit EDGE MT5
Karlo Wilson Vendiola
4.87 (30)
Did You Have A Profitable Trade But Suddenly Reversed? In a solid strategy, exiting a trade is equally important as entering. Exit EDGE helps maximize your current trade profit and avoid turning winning trades to losers. Never Miss An Exit Signal Again Monitor all pairs and timeframes in just 1 chart www.mql5.com/en/blogs/post/726558 How To Trade You can close your open trades as soon as you receive a signal Close your Buy orders if you receive an Exit Buy Signal. Close your Sell orders if
Trend Master Chart MT5
Frederic Jacques Collomb
Trend Master Chart。 它覆盖图表并使用颜色编码来定义不同的市场趋势/走势。 它使用结合了两个移动平均线和不同振荡器的算法。 这三个元素的周期是可以修改的。 它适用于任何时间范围和任何货币对。 您一眼就能识别出上升或下降趋势以及该趋势的不同切入点。 例如,在明显的上升趋势(浅绿色)期间,该趋势中的不同市场冲动将通过深绿色蜡烛显示。 可配置的警报将使您永远不会错过这些冲动之一。 MT4版本。 输入参数: Period 1: 快速周期移动平均线。 Period 2: 慢周期移动平均线。 Oscillator period :振荡器周期。 Sell/Buy alert: 市场冲动警报、趋势切入点。 Bullish/Bearish: 趋势变化时发出警报。 可以通过弹出/邮件和推送通知方式发出警报。 完全可配置的警报文本。 想要查看其他免费 SPARTACUS 指标, 请点击此处 SPARTACUS2024
Precision Breakout Pro
James Patrick D Artanion Grieves
范围突破警报指标 - 用户指南 该指标的作用 区间突破预警指标能够识别特定时间段内的价格区间,并在价格突破这些区间时发出交易信号。该指标专为希望利用突破走势或均值回归机会的交易者而设计。 工作原理 1. 范围检测 基于时间的范围 :设置一个特定的时间窗口(例如,上午 10:00 - 下午 12:00),指标在该时间窗口内跟踪价格走势 范围边界 :在此期间,最高点和最低点将成为你的范围限制 视觉显示 :蓝线显示范围边界,垂直线标记开始/结束时间 2. 信号生成 该指标提供两种不同的交易策略: 趋势模式     (   InpMeanReversion = false   ) 高突破 :     柠檬绿向上箭头     → 买入信号(价格突破范围) 低突破 :     红色向下箭头     → 卖出信号(价格跌破范围) 策略 :跟随突破方向——动量交易 均值回归模式     (   InpMeanReversion = true   ) 高突破 :     橙色向下箭头     → 卖出信号(预期价格回升) 低突破 :     深天蓝色向上箭头     → 买入信号(预期价格回升) 策略
Double HMA MTF for MT5
Pavel Zamoshnikov
4 (4)
This is an advanced multi-timeframe version of the popular Hull Moving Average (HMA) Features Two lines of the Hull indicator of different timeframes on the same chart. The HMA line of the higher timeframe defines the trend, and the HMA line of the current timeframe defines the short-term price movements. A graphical panel with HMA indicator data from all timeframes at the same time . If the HMA switched its direction on any timeframe, the panel displays a question or exclamation mark with a tex
This indicator will help traders quickly identify inside bars, which are often used in price action trading strategies as potential consolidation or continuation patterns. An inside bar formation is a counter trend candle on both sides as it didn't break the previous candle high or low. Key feature: Identify inside bars in real-time. Colours inside bars while keeping normal bars. Configurable history bars. Optional pop-up alerts and phone notifications with symbol name and time of detection. W
Wave Trend MT5
Diego Arribas Lopez
MT4 Version Wave Trend MT5 Wave Trend is an oscillator, which helps identifing in a extremely accurate manner market reversals. The Oscillator being obove the overbought level and a cross down of the fast into the slow MA usually indicates a good SELL signal. If the oscillators is below the oversold level and the fast MA crosses over the slower MA usually highlights a good BUY signal. The Wave Trend indicator can be also used when divergences appear against the price, indicating the current move
Auto Optimized RSI   是一款智能且易于使用的箭头指标,旨在实现精准交易。它利用基于历史数据的模拟,自动识别当前品种和时间周期中最有效的 RSI 买入和卖出水平。 该指标既可以作为独立的交易系统使用,也可以结合您的其他交易策略一起使用。尤其适合日内交易者使用。 与传统 RSI 指标使用固定的 70/30 水平不同, Auto Optimized RSI   会根据真实的价格行为和回测结果动态调整水平。它会跟踪胜率、回撤和平均盈亏等关键指标,从而适应市场当前的走势,并基于“实际有效”的逻辑发出信号。 当 RSI 穿越经过优化的关键区域时,指标会在图表上显示 Buy 和 Sell 箭头,帮助交易者找到成功率更高的进场机会。 购买后请务必联系我,以获取额外赠送的工具和专属交易建议! 祝您交易顺利,稳步盈利!
MSnR Lines
Pierre Paul Amoussou
MSnR Lines 是一个自定义指标,旨在在图表上显示支撑和阻力水平。这些水平基于马来西亚支撑和阻力理论,该理论将水平定义为特定的价格水平,而不是区域,这些价格水平是从线图的峰值和谷值中派生出来的。 特点: 三种类型的水平:A-Level,V-Level和间隙水平。 水平的新鲜度指示:新鲜水平比非新鲜水平更重要。新鲜水平指尚未被测试或已经被交易。 可自定义新鲜水平和非新鲜水平的颜色和样式。 仅显示新鲜水平或所有水平的选项。 可调整的回溯期和当前价格上下方水平的数量。 支持多时间框架。 用途: 交易者可以使用MSnR Lines来识别潜在的支撑和阻力水平以做出交易决策。新鲜水平被认为更为重要,并且可能提供更好的交易机会。此外,交易者还可以根据不同时间框架上的水平来进行多时间框架分析,以提高交易决策的准确性和可靠性。
ParitySnap
Kazutaka Yamamoto
ParitySnap — Triad Z-Score Reversion Non-Repaint / Hedge-Fund-Inspired Mean Reversion / NY-Close Pivot-SL Holiday Promo (until Dec 25, JST): Lifetime $199 / Rental $30 - Standard after promo: Lifetime $209- / Rental $40 - WHAT IT DOES ParitySnap detects tri-currency parity distortions (e.g., GOLD: XAUUSD–AUDUSD–XAUAUD ) and prints non-repainting entries on the just-closed bar when a Z-score mean-reversion edge is present. Built for traders who value transparency and statistical rigor , it bring
EmoSandR
Clever Emoghene
EmoSupportandResistance Indicator EmoSupportandResistance is an indicator for MetaTrader that automatically highlights important support and resistance zones. These zones represent price levels where the market has previously reacted, making them useful reference points for technical analysis. The indicator updates zones in real time as new price data becomes available and plots them clearly on the chart. Main Features Automatic identification of support and resistance levels Real-time updating
Ultimate Supply Demand MT5
Ramon Sobrevals Arce
5 (4)
After working during many months, with the help of Neural Networks, we have perfected the ultimate tool you are going to need for identifying key price levels (Supports and Resistances) and Supply and Demand zones. Perfectly suitable to trigger your trades, set up your future actions, decide your Take Profit and Stop Loss levels, and confirm the market direction. Price will always move between those levels, bouncing or breaking; from one zone to another, all the remaining movements are just mark
SMC Venom 模型 BPR 指標是針對在智慧貨幣 (SMC) 概念內工作的交易者的專業工具。它會自動辨識價格圖表上的兩種關鍵模式: FVG (公平價值缺口)是三根蠟燭的組合,其中第一根和第三根蠟燭之間存在缺口。它在水平之間形成一個沒有成交量支撐的區域,這通常會導致價格調整。 BPR (平衡價格區間)是兩種 FVG 模式的組合,形成一個「橋樑」 - 當價格以低成交量活動移動時,突破並返回到水平的區域,從而在蠟燭之間產生間隙。 這些模式可協助交易者透過分析圖表上的交易量和價格動態(大型市場參與者和普通參與者之間的互動)來識別關鍵的支撐/阻力位、突破區域和切入點。 此指標以矩形和箭頭的形式可視化模式,也支援靈活的警報設定。 主要特點: 模式顯示模式:選擇顯示 BPR 模式(看漲和看跌)或 FVG 模式(看漲和看跌)。 可以隱藏所有圖表分析模式。 以條數過濾:BPR 結構中 FVG 之間的最小/最大距離。 訊號的附加視覺化: 箭頭有 9 種類型可供選擇(標準、細、分形等)或手動輸入 Wingdings 代碼,其表格可以選擇性地顯示在圖表上。 設定顏色、尺寸及其縮放時相對於價格的動態
Noize Absorption Index
Ekaterina Saltykova
Noize Absorption Index - is the manual trading system that measures the difference of pressure between bears forces and bulls forces. Green line - is a noize free index that showing curent situation. Zero value of index shows totally choppy/flat market.Values above zero level shows how powerfull bullish wave is and values below zero measures bearish forces.Up arrow appears on bearish market when it's ready to reverse, dn arrow appears on weak bullish market, as a result of reverse expectation.
Better RSI MT5
KO PARTNERS LTD
This Indicator enhances the default Relative Strength Index (RSI) by introducing several improvements. First, it visually highlights overbought and oversold regions by changing the RSI color from white to red. Second, it includes additional reference lines at 20, 40, 50, 60, and 80, providing a clearer framework for assessing RSI values. The most notable feature is the use of the middle 50-line to indicate the current market cycle. The color of the 50-line dynamically reflects the cycle: green f
PipFinite Trend PRO MT5
Karlo Wilson Vendiola
4.84 (556)
Breakthrough Solution For Trend Trading And Filtering With All Important Features Built Inside One Tool! Trend PRO's smart algorithm detects the trend, filters out market noise and gives entry signals with exit levels. The new features with enhanced rules for statistical calculation improved the overall performance of this indicator. Important Information Revealed Maximize the potential of Trend Pro, please visit www.mql5.com/en/blogs/post/713938 The Powerful Expert Advisor Version Automatin
可以说,这是您可以为MetaTrader平台找到的最完整的谐波价格形成自动识别指标。它检测19种不同的模式,像您一样认真对待斐波那契投影,显示潜在的反转区域(PRZ),并找到合适的止损和获利水平。 [ 安装指南 | 更新指南 | 故障排除 | 常见问题 | 所有产品 ] 它检测19种不同的谐波价格形态 它绘制了主要,衍生和互补的斐波那契投影(PRZ) 它评估过去的价格走势并显示每个过去的形态 该指标分析其自身的质量和性能 它显示合适的止损和获利水平 它使用突破来表明合适的交易 它在图表上绘制所有样式比率 它实现了电子邮件/声音/视觉警报 受斯科特·M·卡尼(Scott M. Carney)的书的启发,该指标旨在满足最纯粹和最熟练的交易者的需求。但是,它采取了一种使交易更容易的方式:在向交易发出信号之前,它会等待Donchian朝正确方向突破,从而使交易信号非常可靠。 斐波那契投影与向量无关 它实现了电子邮件/声音/推送警报 它绘制了ABCD投影 重要提示: 为了符合 Scott M. Carney先生 的商标申诉,某些图案名称已重命名为不言自明的替代方式, Scott M.
MT5 Support and Resistance Indicator Automatic Drawing of Multiple Supports and Resistances with levels.  Supports As follow 1.       Weak Support 2.       Untested Support 3.       Verified Support 4.       Proven Support 5.       Turncoat Support Resistances As follow 1.       Weak Resistance 2.       Untested Resistance 3.       Verified Resistance 4.       Proven Resistance 5.       Turncoat Resistance Best Strategy to use 1.       Identify Trend Direction on Daily Time Frame, Example Gold =
支撑和阻力指标是改编自标准的比尔威廉姆斯的分形指标。 该指标可工作于任何时间帧。它在图表上显示支撑和阻力位,并允许设置止损和止盈级别 (您可以通过鼠标覆盖级别来检查其精确值)。 蓝色点划线是支撑位。 红色点划线是阻力位。 如果您愿意, 您可以改变这些线的样式和颜色。 如果价格接近支撑位,卖方的活跃度降低,买方的活跃度增加。如果价格接近阻力位,买方的活跃度降低,卖方的活跃度增加。 注, 当价格突破支撑位, 它变为阻力位; 同样当价格突破阻力位, 它变为支撑位。
和谐图案最适合预测市场转折点。和谐图案为您提供高胜率和一天内的高交易机会。 该指标识别了最受欢迎的和谐图案,这些图案预测市场反转点。 基于和谐交易书籍。 重要说明: 该指标不会重绘或滞后(它在D点检测到模式);它不会重新绘制(模式要么有效,要么取消)。 使用方法: 将指标拖放到您的MT5图表上。 将模式检测设置为TRUE(ABCD; Gartley)。 根据您的喜好调整偏差(较大的偏差=更多的模式;较小的偏差=更少的模式)。 根据您的喜好自定义颜色。 根据需要启用或禁用关于入场点、TP和SL的警报。 检测到模式时: 该算法在D点检测到模式。 如果启用了警报,它将通知您检测到的模式。 如果模式无效,则触发一个带有“模式已取消”消息的警报。 成功的模式在蜡烛关闭时触发“入场警报”。 如果价格达到TP1、TP2、TP3、TP4或SL,则会发出带有终端消息的警报。 价格现在为40美元,仅剩下几份副本,最终价格将为70美元。 发展计划: 该指标的当前版本(1.1)将检测Gartley和ABCD模式。 版本1.1将包括Butterfly、Bat和Crab模式。 未来版本将包括其他模式、潜在PRZ检
Candle Pattern Finder MT5
Pavel Zamoshnikov
4.2 (5)
This indicator searches for candlestick patterns. Its operation principle is based on Candlestick Charting Explained: Timeless Techniques for Trading Stocks and Futures by Gregory L. Morris. If a pattern is detected, the indicator displays a message at a bar closure. If you trade using the MetaTrader 4 terminal, then you can download the full analogue of the " Candle Pattern Finder for MT4 " indicator It recognizes the following patterns: Bullish/Bearish (possible settings in brackets) : Hammer
Naturu
Ivan Stefanov
5 (1)
“Naturu” 是一个使用大自然对称性作为算法的手动指标。 用简单策略和隐藏智慧,掌控市场! 加载指标后,您会看到两条线——上线(Top)和下线(Bottom)。 单击一次即可激活某条线。要移动,只需点击您想放置该线的那根K线。 您设定一个高点和一个低点,指标会自动计算: 洋红色区域,显示多空双方兴趣最接近之处,也就是最有可能成为支撑/阻力的区域。 灰色区域,标示下一层次的关注区。 青绿色线条,表示多方的目标价位。 金色线条,表示空方的目标价位。 手动指标赋予您完全的控制和灵活性,让您根据实时市场环境和个人直觉调整级别。它们迫使您更深入地亲自分析价格走势,帮助您真正理解支撑、阻力和形态是如何形成的。依靠人工判断,可以过滤掉自动系统常常误判的大量“噪音”,减少错误信号。而且,因您亲自设定每个级别,可在突发新闻或极端行情时立即调整,无需等候代码更新。 隐藏于简单游戏背后的神圣力量!
RM Divergence Pro
Mohammadreza Mahdi Mavaddat
RM Divergence Pro is a professional, non-repainting RSI divergence indicator designed for traders who want real structural insight beyond classic divergence tools. It accurately detects Regular Divergence (RD), Hidden Divergence (HD), Inability (IA), and Potential Divergence (P-DVG) using stable swing-based logic. Built for clarity, precision, and clean market structure analysis. -------------------------------------------------- OVERVIEW RM Divergence Pro is an advanced RSI-based divergence
首先,值得强调的是,这个交易工具是非重绘、非重画和非滞后的指标,非常适合专业交易。 在线课程,用户手册和演示。 智能价格行动概念指标是一个非常强大的工具,既适用于新手,也适用于经验丰富的交易者。它将超过20个有用的指标合并到一个指标中,结合了高级交易思想,如内圈交易员分析和智能资金概念交易策略。该指标侧重于智能资金概念,提供有关大型机构交易方式的见解,帮助预测它们的动向。 它在流动性分析方面尤其擅长,有助于理解机构的交易方式。它擅长预测市场趋势,并仔细分析价格波动。通过将您的交易与机构策略对齐,您可以更准确地预测市场走向。该指标多才多艺,擅长分析市场结构,识别重要的订单区块,并识别各种模式。 它擅长识别BOS和CHoCH等模式,理解动量的转变,并突出显示供需强劲的关键区域。它还擅长发现强大的不平衡,并分析价格创造更高高点或更低低点的模式。如果您使用斐波那契回撤工具,该指标可以满足您的需求。它还可以识别相等的高点和低点,分析不同的时间框架,并通过仪表板显示数据。 对于使用更高级策略的交易者,该指标提供了工具,如公平价值差指标和优惠和折扣区域的识别。它特别关注高时间框架订单区块,并
Overview The Market Perspective Structure Indicator is a comprehensive MetaTrader indicator designed to provide traders with a detailed analysis of market structure across multiple timeframes. It identifies and visualizes key price action elements, including swing highs and lows, Break of Structure (BOS), Change of Character (CHOCH), internal structures, equal highs/lows, premium/discount levels, previous levels from higher timeframes, and trading session zones. With extensive customization opt
Gold EA: Proven Power for 1-Minute Gold Trading Transform your trading with our Gold EA, meticulously crafted for 1-minute charts and delivering over 2000% growth in 5 years from just $100-$1000 . No Martingale, No AI Gimmicks : Pure, time-tested strategies with robust money management, stop loss, and take profit for reliable performance across multiple charts. Flexible Trading Modes : Choose Fixed Balance for safe profits, Mark IV for bold growth, or %Balance for high rewards—combine Mark IV an
该产品的买家也购买
SynaptixQuant Dominance Matrix
Devie Arevalo Montemayor
5 (1)
SynaptixQuant Dominance Matrix: Institutional-Grade Market State Extraction Engineered for traders who require a data-driven view of market behaviour beyond surface-level indicators. The Synaptix Quant (SQ) Dominance Matrix is not a conventional currency strength display. Behind its intentionally streamlined interface runs a sophisticated analytical architecture designed to quantify market conditions with precision. Every output is generated through layered signal processing built to identify d
RelicusRoad Pro MT5
Relicus LLC
5 (24)
您购买了多少次交易指标,它们拥有 出色的回测, 真实账户表现证明 拥有惊人的数字和 各种统计数据, 但使用后您却 账户爆仓? 您不应该只相信一个信号本身,您需要知道它最初出现的原因,这正是 RelicusRoad Pro 的最佳之处! 用户手册 + 策略 + 培训视频 + 带 VIP 访问权限的私人群组 + 提供移动版本 观察市场的新方式 RelicusRoad 是 全球最强大、最好的交易指标 ,适用于外汇、期货、加密货币、股票和指数,为交易者提供发展账户所需的所有信息和工具。我们提供 技术分析 和 交易计划 ,帮助 每位交易者取得成功 ,无论是 初学者 还是 高级交易者 。 它是一个 关键交易指标 ,提供足够的信息来 预测 未来市场。我们相信一个 完整的解决方案 ,而不是图表上几个没有意义的不同指标。这是一个 一体化指标 ,显示 信号 、 箭头 + 价格行为 信息,这是 无与伦比 且 非常准确的 。   RelicusRoad 利用机器学习 (AI) 技术,为交易者提供必要的信息和工具,帮助他们成为成功的、知情的交易者。   通过领先指标预测未来价格 几乎 所有技术指标都滞后 ,
AriX
Temirlan Kdyrkhan
1 (4)
AriX Indicator for MT5 A powerful trend-following and signal-evaluation tool AriX is a custom MT5 indicator that combines Moving Averages and ATR-based risk/reward logic to generate clear buy/sell signals. It visualizes dynamic SL/TP levels, evaluates past trade outcomes, and displays win/loss statistics in a clean on-chart panel. Key features include: Buy/Sell signals based on MA crossovers ATR-based SL/TP1/TP2/TP3 levels with visual lines and labels Signal outcome tracking with real-time stat
ARICoins
Temirlan Kdyrkhan
ARICoin is a powerful trading companion designed to generate high-probability entry signals with dynamic TP/SL/DP levels based on volatility. Built-in performance tracking shows win/loss stats, PP1/PP2 hits, and success rates all updated live. Key Features: Buy/Sell signals with adaptive volatility bands Real-time TP/SL/DP levels based on ATR Built-in MA Filter with optional ATR/StdDev volatility Performance stats panel (Success, Profit/Loss, PP1/PP2) Alerts via popup, sound, push, or email Cust
This indicator uses support and resistance, volume and some special formula to calculate the volume to filter the candles. If the volume reaches a specific value, And at the same time, Candle breaks the support/resistance line, There would be a signal and we can enter the market. Signals appear when the current candle closes. then you can enter the trade when a new candle appears. Please don't forget to follow your money management plan. MT4 Version Support/Resistance Breakout MT4 :   https:/
Super Signal – Skyblade Edition 專業級無重繪 / 無延遲趨勢信號系統,擁有卓越勝率 | 適用於 MT4 / MT5 核心特色: Super Signal – Skyblade Edition 是一套專為趨勢交易設計的智能信號系統。 其採用多重濾波邏輯,僅篩選出具有明確方向性、動能強勁且波動結構健康的走勢進場點。 本系統 不預測高點或低點 ,只有在同時滿足以下三項條件時才會觸發交易信號: 趨勢方向明確 動能持續增強 波動率結構穩定 此外,系統還結合市場流動性分析,以進一步提升信號的準確性與觸發時機。 信號特性: 所有箭頭信號皆為 100% 無重繪,無延遲 信號一旦出現即固定於圖表,不會閃爍或消失 提供圖表箭頭、資訊面板、彈出通知、聲音提示及推播訊息 支援 EA 呼叫(Buffer 輸出),可整合至自動化交易或信號跟單系統 提供預設參數模板,免調整即可使用,適合新手快速上手 所有數據皆採用「嚴格回測標準」——每筆交易訊號在觸發後的 60 根 K 線內, EURUSD 與 USDJPY 至少須達成 +50 點獲利,黃金(XAUUSD)則須達成 +100 點
TrendMaestro5
Stefano Frisetti
note: this indicator is for METATRADER4, if you want the version for METATRADER5 this is the link:  https://www.mql5.com/it/market/product/108106 TRENDMAESTRO ver 2.5 TRENDMAESTRO recognizes a new TREND from the start, he never makes mistakes. The certainty of identifying a new TREND is priceless. DESCRIPTION TRENDMAESTRO identifies a new TREND in the bud, this indicator examines the volatility, volumes and momentum to identify the moment in which there is an explosion of one or more of these da
“ Dynamic Scalper System MT5 ”指标专为在趋势波内进行剥头皮交易而设计。 已在主要货币对和黄金上进行测试,并可与其他交易工具兼容。 提供顺势短线建仓信号,并提供额外的价格变动支持。 指标原理: 大箭头决定趋势方向。 在趋势波内,我们采用一种生成小箭头形式的剥头皮交易信号的算法。 红色箭头代表看涨方向,蓝色箭头代表看跌方向。 敏感的价格变动线会沿着趋势方向绘制,并与小箭头信号协同作用。 信号运作方式如下:当线在适当时刻出现时,将形成入场信号;在出现线时,持仓;线完成后,平仓。 建议的操作时间范围为M1 - H4。 箭头在当前K线上方形成,如果下一根K线已开仓,则不会重新绘制上一根K线上方的箭头。 输入参数 Trend Wave Period - 趋势方向(大箭头)的周期,改变趋势波的时间间隔。值 1 表示趋势方向的最长持续时间,参数值越大,持续时间越短。 Scalper Arrows Period - 信号箭头(小箭头)的计算周期,改变入场信号的生成频率。值 3 表示最频繁的生成频率,参数值越大,箭头频率越低,准确度越高。 这些参数可以根据不同
##   ONLY GOLD ##   Тiльки Золото ## **Mercaria Professional Trading Zones - Complete Guide** ## **Mercaria Professional Trading Zones - Повний посібник** ### **How Mercaria Zones Work / Як працюють зони Mercaria** **English:** Mercaria Zones is an advanced trading indicator that identifies high-probability support and resistance areas using ZigZag extremes combined with mathematical zone calculations. The indicator works on multiple timeframes simultaneously, providing a comprehensive view
获取 免费 AUX 指标和 EA 支持   直接下载 — 点击这里 [ D.I.C.E ] The DICE Indicator   Divergence in Chaos Environment 是一款专为使用艾略特波浪理论并结合混沌交易技术的交易者设计的 MT5 专用工具。它识别价格行为中的隐藏和常规背离,并与比尔·威廉姆斯所描述的混沌市场环境同步。 主要特征 艾略特波浪背离检测:检测符合波浪结构的看涨和看跌背离,以提高波浪计数精度。 混沌技术集成:与混沌交易策略相结合,确保信号与 AO 指标和市场结构一致。 多时间框架扫描:跨不同时间框架分析背离以确认动能变化和趋势耗尽。 可视化警报和对象:图表中清晰的箭头、线条和标记,便于快速识别。 自适应市场读取:自动适应混沌市场条件,过滤噪音并保留有效信号。 突破回调入场技术:使用简单的斐波那契回撤和枢轴点的常见交易方法。 优势 结合背离信号与波浪进程,提高入场精度。 利用 AO 混沌背离逻辑确认可能的第 3–5 波完成。 提前识别反转或延续区域,降低风险。 实时自动发现修正区,低风险高回报。 通过清晰的视觉确认增强交易信心。
+++++++++++++++++++++++++++++++++++++++++++++++++++++++++++++++++++++++++++++++++++++++++++++++++ +++ Link to EURUSD Only Free Version -->  https://www.mql5.com/en/market/product/156904?source=Unknown +++++++++++++++++++++++++++++++++++++++++++++++++++++++++++++++++++++++++++++++++++++++++++++++++ Hallo Trader, This is a traditional GANN & FIBONACCI strategy based on detection of an impulsive move in the opposite direction. This is called a Breakout. At the moment of Breakout, the indicator draw
Frontier Pivots
Nestor Jose Mendez Boza
FRONTIER PIVOTS - Geometric Levels Indicator This indicator plots support and resistance levels/ranges on the chart using mathematical calculations. It helps traders identify potential price reaction zones based on geometric patterns. Main Features: Automatically calculates and displays key price levels Plots both support and resistance lines Uses daily price data for level calculation Clean visual presentation with different colors for different level types No repainting - levels remain static
Introduction to X3 Chart Pattern Scanner X3 Cherart Pattern Scanner is the non-repainting and non-lagging indicator detecting X3 chart patterns including Harmonic pattern, Elliott Wave pattern, X3 patterns, and Japanese Candlestick patterns. Historical patterns match with signal patterns. Hence, you can readily develop the solid trading strategy in your chart. More importantly, this superb pattern scanner can detect the optimal pattern of its kind. In addition, you can switch on and off individu
Pantera Indicator
Temirlan Kdyrkhan
5 (1)
A tool for on-chart strategy backtesting and performance analysis. A utility for developing, debugging, and testing custom trading ideas and indicator functions. An indicator designed to quickly test trading concepts and visualize the effectiveness of different input parameters. An all-in-one sandbox for testing everything from simple crossovers to complex, multi-condition trading systems.
获取免费的 AUX 指标、EA 支持和完整指南,请访问 – https://www.mql5.com/en/blogs/post/763955 发现趋势。读取模式。把握入场时机。 三步只需30秒!轻松交易 — 无需分析,您的智能助手已准备好简化您的工作流程 不再因图表信息过载而困扰。 通过智能趋势偏向检测自信交易。 兼容所有货币、加密货币、股票、贵金属、指数及任意时间框架。 只需点击并执行 — 就这么简单。 非常适合希望快速清晰交易的忙碌交易者。 TPTSyncX 是一款强大的全能 MetaTrader 5 指标,可无缝同步 趋势、图形模式 与 K线触发 分析,并以清晰智能的可视化系统呈现。专为追求清晰度、精确性和速度的交易者设计,它通过结合价格行为、结构模式和市场时机工具,帮助识别高概率交易机会。 主要功能: 智能可视化显示: 自动绘制价格结构模式,并清晰标注高点高 (HH)、低点高 (HL)、高点低 (LH) 与低点低 (LL) 于图表上 — 实时展现市场结构变化与潜在反转区域,对识别趋势转换与价格突破至关重要。 动态移动平均线: 根据所选目标K线范围自动调整周期,适用于短线剥
Elliot Waves Analyzer Pro
Viktor Weidenthal
2.67 (3)
Elliot Waves Analyzer Pro calculates Elliot Waves to Help Identify Trend direction and Entry Levels. Mainly for Swing Trading Strategies. Usually one would open a Position in trend direction for Wave 3 or a Correction for Wave C . This Indicator draws Target Levels for the current and next wave. Most important Rules for Elliot Wave Analysis are verified by the Indicator.  The Pro version analyzes Multiple Timeframes and shows the Subwaves and Target-Levels.   For an Overview  " Elliot Waves Anal
Weis Wave with Alert MT5
Trade The Volume Waves Single Member P.C.
4.94 (17)
Rental/Lifetime Package Options and Privileges  Rent Monthly Six Months   Yearly/Lifetime Weis Wave with Speed with Alert+Speed Index x x x Manual  x x x Quick Set up Video x x x Blog x x x Lifetime Updates x x x Setup and Training Material x x Discord Access Channel "The SI traders"          x Rectangle Break Alert Tool      x How to trade with it:    http://www.tradethevolumewaves.com   ** If you purchase please contact me to setup your  : Training Room and  complete manual access.  Wei
The iChannels
BeeXXI Corporation
5 (2)
Ultra-fast recognition of parabolic channels (as well as linear, horizontal and wavy channels) throughout the depth of history, creating a hierarchy of channels. Required setting: Max bars in chart: Unlimited This indicator is designed primarily for algorithmic trading, but can also be used for manual trading.  This indicator will have a very active evolution in the near future and detailed descriptions on how to apply to create robots
TREND HARMONY MT5 – Multi Timeframe Trend and Phase and Pullback Level Visualizer indicator for Metatrader5 The TREND HARMONY indicator automates deep trend analysis and generates visualizations for you. Take control of your trades by eliminating uncertainty! Revolutionize your trading experience with precision and insight through the TREND HARMONY Multi Timeframe indicator – your ultimate MT5 trend visualization indicator. [  Features and Manual   | MT4 version |   All Products   ] Are you tir
[ MT4 Version ]  [ Kill Zones ]  [ SMT Divergences ] How to trade using Order Blocks:  Click here User Interface Performance:  During testing in the strategy tester, the UI may experience lag. Rest assured, this issue is specific to the testing environment and does not affect the indicator's performance in live trading. Elevate your trading strategy with the  Order Blocks ICT Multi TF  indicator, a cutting-edge tool designed to enhance your trading decisions through advanced order block analysis
Key level wedge pro MT5
Presley Annais Tatenda Meck
Its our anniversary! To give back enjoy this 60% discount for the next week (original price $239) We have combined all of our beloved indicators the likes of: Key level order block ,   Key level supply and demand ,   Key level liquidity grab   and   Key level wedge   into one single indicator and dashboard. Whats new Dashboard : There is an easy access dashboard for all your needs. Multi-timeframe button : There is now a multi-timeframe option for Order Blocks and Supply and demand zones, maki
WVAP Scalping
Domantas Juodenis
VWAP Scalping Pro – Advanced VWAP & Market Profile System Professional-Grade VWAP + Market Profile Technology for Precision Trading VWAP Scalping Pro is an advanced analytical tool that integrates Volume-Weighted Average Price (VWAP) analysis with professional Market Profile visualization. It provides traders with institutional-style insights into price structure, volume distribution, and session dynamics — ideal for scalping, intraday, and swing trading strategies. Key Features Triple VWAP St
Hello I Want to introduce The Forex Buy Sell Arrow Premium MT5 i recently release this premium indicator! its 1000% Non Repaint Indicator, It Work Perfectly Well,, i tested it day by day, Just mind blowing Result,  Including Powerful trend Algorithm! How It Work? well, it work market trend formula, when trend Bullish Or when trend Bearish,  Recommend Timeframe M30, H1 it work all timeframe, and all currency pair, 100% non repaint, How to take signal From Forex Buy Sell Arrow Premium Ind
Chanlun
Xiaonong Yu
缠师在新浪博客中以 108 篇博文详细地解释了缠论这一个精妙的数学模型。  “ 缠论 ” 是基于形态学,几何学的一种技术分析理论。这一理论似乎适用于一切具有波动走势的投资市场,比如股票、权证和期货等   。 然而,要应用缠论做交易就必须有足够的时间去正确地画 “ 笔 ” 。可是画 “ 笔 ” 又是一项耗费时间且极易出错误的工作,令众多缠论爱好者痛苦不堪。 本指标依据缠师的缠论原作实现,能够自动且精确地在图表中画出笔、中枢和线段,帮助交易者解决了画笔和线段的烦恼,使得交易者可以直接分析和预测市场走向。 本指标中添加了中枢和线段的选项,可以完整的帮助用户画出缠论中的所有基本构件。 本指标中笔、中枢和线段的颜色、透明度与线宽等,均可由用户自行设定。
Big Player Range
Thalles Nascimento De Carvalho
5 (3)
BigPlayerRange — 适用于沪深300和美元人民币的最佳MT5指标 探索 BigPlayerRange 的强大功能,它被认为是用于 沪深300、上证指数、USD/CNH 等资产的 MetaTrader 5 最佳指标 。该工具能精准识别机构主力的关键区域,帮助交易者进行高精度的技术分析。 指标工作原理: BigPlayerRange 绘制两个水平区域,通过成交量分析反映市场能量: 绿色区域 :买方防守位置,支撑价格。 红色区域 :卖方压制位置,形成阻力。 使用策略: 收盘价突破绿色区域上方 :可能开启上涨趋势,目标为上方区间。 收盘价跌破红色区域下方 :暗示下跌压力增强,目标为下方支撑。 价格停留在区间内 :行情震荡,等待突破信号。 核心优势: 机构活动区域识别 :提前发现主力进出场信号。 自动计算的目标价格 :提供两个明确的止盈位置。 回调概率分析 :优化风险控制,提升稳定性。 参数个性化设置: 自定义交易时间与成交量类型(Tick或真实成交量)。 使用机构逻辑提升日内交易效率。 推荐搭配
Support Resistance Catcher Indicator Features and Explanation Overview: The Support Resistance Catcher is a custom MT5 indicator designed to identify and visualize supply (resistance) and demand (support) zones based on candlestick price action. It detects zones where price has reversed after rallies or drops, using wick rejections and clustering. The indicator draws horizontal rectangles for active and historical zones, with customizable colors, labels, and alerts. Key Features: 1. Zone Det
Enigma 112
issam rahhal sabour
Enigma 112 Indicator - User Manual Enigma 112 Indicator Complete User Manual - Ultimate Trading Solution Introduction The Enigma 112 is a comprehensive multi-timeframe trading indicator that combines advanced technical analysis concepts including Tesla 3-6-9 Gates, Huddleston Theory, PO3 Dealing Ranges, and sophisticated risk management systems. Tesla 3-6-9 Gates Based on Nikola Tesla's vortex mathematics for precise support and resistance levels Huddleston Theory Volume-based market
VTrende Pro
Andrii Diachenko
5 (1)
VTrende Pro - MTF indicator for trend trading with a display panel for MT5 *** Videos can be translated into any language using subtitles (video language - Russian) Although the signals of the VTrende Pro indicator can be used as signals of a full-fledged trading system, it is recommended to use them in conjunction with the Bill Williams TS. VTrende Pro is an extended version of the VTrende indicator. Difference between Pro version and VTrende: - Time zones - Signal V - signal 1-2 waves -    S
Meravith MT5
Ivan Stefanov
该指标可从任意点分析成交量,并计算该成交量的市场衰竭水平。 Meravith 主线: 多头成交量衰竭线 – 用作目标。 空头成交量衰竭线 – 用作目标。 趋势线 – 指示市场趋势。颜色会根据市场是多头还是空头而变化,并作为趋势支撑。 使用方法: 双击紫色竖线,将其移动到所需位置。 您可以分析任何内容——趋势或修正。将指标移动到市场顶部、底部或您认为重要的任意位置。一个好的方法是将 Meravith 设置在市场位于衰竭线之间的位置;这样您将拥有明确的目标可追踪。 如果初始衰竭线被突破,将会出现新的衰竭线,形成额外的可交易通道。 当达到衰竭时,您可以重新定位指标或切换到不同的时间框架,以寻找新的衰竭水平。 趋势线与某一条成交量衰竭线之间的距离越大,该方向上的成交量就越高。趋势线可作为开仓位置,而衰竭线可用于获利了结。 Meravith 包含图表按钮,使操作更加简单快捷——所有核心功能都可以直接从图表中切换。每个按钮的功能如下: DEV – 显示相对于支撑线的双倍偏差,如果趋势内部成交量较高,它可以作为额外的支撑位。 95% – 绘制覆盖最近 20 根K线 95% 区间的曲线。如果价格突破该
SYSTEM INTRODUCTION:   The Binary Options Conqueror System Is Specifically Designed For Binary Options Trading. Unlike Other Systems And Indicators That Were Adopted From Other Trading Environments For Binary Options. Little Wonder Why Many Of Such Systems Fail To Make Money . Many End Up Loosing Money For Their Users.     Forward Testing Of The System Has Shown Remarkable Results . The Results Of Forward Testing On Live Trading Account Is Consistent With The Results Obtained By Back Testing .
作者的更多信息
Canal H Pro
N'da Lemissa Kouame
NuageTrend Pro
N'da Lemissa Kouame
Nuage Trend Pro – 趋势跟踪与Kijun信号 Nuage Trend Pro 是一款针对 MetaTrader 5 的高级指标,能够快速识别 强势市场趋势 ,并通过 Kijun 交叉点找到 最佳入场点 。将您的图表转化为 清晰直观的视觉地图 ,让交易更加 精准且自信 。 主要功能 自动Kijun交叉检测 :即时标出价格穿越基准线的关键时刻。 动态趋势云 :图表颜色随市场方向变化——上涨为绿色,下跌为红色。 清晰的买卖信号 :快速捕捉买入和卖出机会。 可自定义设置 :调整 Kijun 周期、趋势云颜色及显示样式,满足您的策略需求。 为什么选择 Nuage Trend Pro? 简单直观的趋势可视化 ,一目了然。 多功能适用 :适用于所有时间周期及交易品种(外汇、指数、商品)。 适合 初学者 和 资深交易者 优化入场和出场策略。 易于与其他指标或交易策略结合 使用。
Weekly Levels Pro
N'da Lemissa Kouame
中文 (Chinois) – Weekly Levels Pro Weekly Levels Pro – 每周关键水平 是一个简单而强大的 MetaTrader 5 指标,专为自动显示每周最重要的四个交易水平而设计: 本周最高价 (Weekly High) → 自然阻力位 本周最低价 (Weekly Low) → 自然支撑位 本周开盘价 (Weekly Open) → 趋势参考点 本周收盘价 (Weekly Close) → 多空强弱指标 主要特点: 每周自动更新,无需手动操作 图表上清晰可见,直观易读 快速识别主要支撑位和阻力位 适用于外汇、指数、大宗商品和加密货币 简单参数,无复杂设置 为什么选择 Weekly Levels Pro? 周线水平被专业和机构交易者广泛使用,用于识别: 突破与反转区域 战略性的进场和出场点位 趋势延续或修正的信号
Pin Bar Pro v1
N'da Lemissa Kouame
Pin Bar Pro v1.0 – MQL5 指标 描述: Pin Bar Pro 是一个专业的 MetaTrader 5 指标,可自动识别 Pin Bar(针形线) ,帮助预测市场反转。信号直接显示在图表上: 蓝色箭头 → 买入信号(看涨 Pin Bar) 红色箭头 → 卖出信号(看跌 Pin Bar) 功能: 自动识别 Pin Bar 可自定义箭头 ( Arrow_Up_Code , Arrow_Down_Code ) 可调节垂直偏移 ( Arrow_Offset_Pts ) 支持所有品种和时间周期 参数: 参数 描述 默认值 Arrow_Up_Code 买入箭头 Wingdings 代码 233 Arrow_Down_Code 卖出箭头 Wingdings 代码 234 Arrow_Offset_Pts 垂直偏移(点数) 10 作者: KOUAME N’DA LEMISSA 版本: 1.0 – 可用于 MQL5
1. 中文 (Chinois simplifié) 指标 Monthly Levels + Pin Bar Pro 描述 Monthly Levels + Pin Bar Pro 指标结合了 月度关键水平 (高点、低点、开盘、收盘) 与 价格行为反转形态 (Pin Bar) 的自动检测。 它专为技术交易者和机构交易者设计,帮助预判市场反应区,并在图表上生成清晰直观的交易信号。 主要功能 自动绘制月度水平 :高点、低点、开盘、收盘。 实时 Pin Bar 检测 (看涨 & 看跌)。 直观的可视化显示 :水平线 (月度) + 箭头 (信号)。 ️ 可自定义参数 :时间周期、箭头样式、大小、偏移。 高效优化 :低资源消耗,适合剥头皮和波段交易。 ️ 兼容 EA :可集成到自动化交易策略中。 ️ 使用方法 将指标添加到任意时间周期的图表。 系统会自动显示 月度高点、低点、开盘价、收盘价 。 观察信号: 蓝色箭头 → 看涨 Pin Bar (接近月度支撑)。 红色箭头 → 看跌 Pin Bar (接近月度阻力)。 结合趋势、成交量等过滤条件提高准
Yearly Levels Pro
N'da Lemissa Kouame
3️⃣ 中文 (Chinese) 版本: 1.0 开发者: KOUAME N'DA LEMISSA 平台: MetaTrader 5 (MT5) 类型: 技术指标 / 年度价格水平 描述: Yearly Levels Pro v1.0,由KOUAME N'DA LEMISSA开发,是一款强大的指标,可快速识别年度关键价格水平。它自动计算指定年份的 开盘价、最高价、最低价和收盘价 ,并在图表上以彩色水平线显示。 主要功能: High(红色)、Low(蓝色)、Open(绿色)、Close(橙色) 通过 Year_Shift 选择年份 支持所有交易品种和时间周期 实时自动更新 参数: Year_Shift : 0 = 当前年,1 = 上一年,依此类推 亮点: 简单直观 帮助识别年度支撑/阻力 适合长期交易分析 使用建议: 使用High/Low线识别支撑和阻力区域 将当前价格与Open/Close比较,分析趋势 可结合K线形态或其他指标确认信号
Quarterly Levels Pro
N'da Lemissa Kouame
Chinese Version (中文) Quarterly Levels Pro v1.0 – 商业通知 产品名称: Quarterly Levels Pro v1.0 开发者: KOUAME N'DA LEMISSA 版本: 1.0 描述: Quarterly Levels Pro 由 KOUAME N'DA LEMISSA 开发,是 MetaTrader 5 的专业指标,可自动显示季度的 High, Low, Open 和 Close 水平。它可以帮助交易者清晰地在图表上查看关键支撑和阻力区,便于中期交易决策。 主要功能: 自动显示季度 High, Low, Open 和 Close 水平。 每个水平的可自定义颜色: High: 红色 Low: 蓝色 Open: 绿色 Close: 橙色 可调线宽以便视觉区分。 可通过 Quarter_Shift 参数显示 当前、上一个或更早季度 的水平。 兼容 MT5 上的所有货币对和金融工具。 参数: 参数 描述 默认值 Quarter_Shift 显示到上一个季度:0 = 当前季度, 1 = 上一季度, 等等 0 交易者优势: 快速
中文 (Chinois simplifié) 描述 Multi-Timeframe Levels Pro v1.0 自动在图表上绘制关键的 日线、月线、季度线和年线 高低开收水平。 这些水平对于识别重要的支撑位、阻力位和突破区域非常有用。 主要功能 自动显示 Daily / Monthly / Quarterly / Yearly 水平 不同颜色标记 High、Low、Open、Close 可自定义 Shift 分析历史周期 适用于所有市场: 外汇、指数、大宗商品、股票、加密货币 轻量快速,适合 Price Action、波段交易、剥头皮 参数 DailyShift → 当前或前一天 MonthlyShift → 当前或前一个月 QuarterlyShift → 当前或前一个季度 YearlyShift → 当前或前一年 使用建议 高时间框架(季度、年度)用于关键区域;低时间框架(日线、月线)适合短线交易。
Marubozu Pro MT5
N'da Lemissa Kouame
Commercial Description – Marubozu Pro (MT5) Description Marubozu Pro is a professional indicator for MetaTrader 5 that automatically detects Marubozu candles (bullish and bearish) directly on your chart. It helps traders identify strong market momentum where buyers or sellers take full control, by displaying clear visual arrows for buy and sell signals. This tool is designed to be simple, effective, and fast , perfect for manual trading or as a filter in automated strategies. Key Features
2️⃣ Version Chinois ETE Detector – 头肩形指标 (Head & Shoulders Indicator) 将图表转化为清晰可操作的交易机会! 指标介绍 ETE Detector 自动识别 头肩顶 (H&S) 和 倒置头肩 (IH&S) 图形——经典趋势反转形态。 无需手动寻找图形,您的分析将变得 快速、精准、可视化 。 功能亮点 自动检测 趋势反转图形 彩色箭头 :绿色 表示买入(倒置头肩),红色 表示卖出(头肩顶) 自动绘制 颈线 ,显示突破区域 “”标签 标记肩部和头部,直观显示图形 图表上直接显示 文字说明 : "H&S – 卖出" 或 "倒置H&S – 买入" 交易者优势 节省时间 :无需手动寻找图形 决策更可靠 :提前发现趋势反转 清晰可视化 :完整图形一目了然 适用于 所有市场和时间周期 易于自定义 ,适应个人交易风格 ️ 可调参数 参数 描述 默认值 LookBack 分析的蜡烛数量 300 MinDistance 肩与头之间的最小距离 5 Tolerance 肩部对称公差 (%) 2% BuyColor
ABCD Lemissa + 月线水平 + PinBar + Marubozu 指标 描述 该指标 整合了多种强大工具 ,为市场提供完整的概览: ABCD Lemissa – 自动识别 ABCD 结构 ,标记 A、B、C、D 点、支撑/阻力区域,并显示买入/卖出箭头。 Monthly Levels(月线水平) – 显示月线蜡烛的 High、Low、Open、Close 水平,用于识别关键区域。 PinBar & Marubozu – 自动识别 PinBar 蜡烛 (反转信号)和 Marubozu 蜡烛 (强趋势蜡烛),支持自定义箭头和符号显示。 该指标完全 可视化 ,结合了线条、箭头和矩形,便于分析市场和做出交易决策。 主要功能 ABCD Lemissa 自动识别 A、B、C、D 点 显示 BUY 和 SELL 信号箭头 使用 X1 / X2 矩形高亮支撑和阻力区域 Monthly Levels(月线水平) 显示月线蜡烛的 High、Low、Open 和 Close 每根新蜡烛动态更新 PinBar & Marubozu 自动识别反转蜡烛和强趋势蜡烛 可自定义箭头显示交易信
Order Block Pro MT5
N'da Lemissa Kouame
Order Block Pro (MQL5) – 版本 1.0 作者: KOUAME N'DA LEMISSA 平台: MetaTrader 5 描述: Order Block Pro 是一个高级指标,可自动识别图表上的 多头和空头订单块 (Order Blocks) 。通过分析盘整蜡烛及随后强势的冲击蜡烛,该指标帮助交易者识别价格可能加速的关键区域。 适合希望以下目标的交易者: 精准确定进出场点。 发现动态支撑和阻力区域。 提升风险管理和交易策略。 主要功能: 多头订单块检测: 在盘整蜡烛之后的强势上涨蜡烛处显示绿色箭头。 空头订单块检测: 在盘整蜡烛之后的强势下跌蜡烛处显示红色箭头。 完全可自定义: 最大蜡烛实体比例 ( BodyMaxRatio ) 下一根蜡烛最小比例以确认走势 ( NextCandleMinPct ) 箭头偏移量 ( Arrow_Offset_Pts ) Marketplace 准备就绪: 优化且干净的代码,符合 MQL5 Marketplace 标准。 输入参数: 参数 描述 Arrow_Up_Code Wingdings 上箭头代码 (默认: 233
ETE Detector v4.0 (Head & Shoulders) Author: KOUAME N’DA LEMISSA Version: 4.0 Platform: MetaTrader 5 Indicator Type: Chart / Visual Trading Signals Overview The ETE Detector v4.0 is a technical indicator designed to automatically detect classic and inverse Head & Shoulders patterns (H&S) on MT5 charts. These patterns are widely used to anticipate trend reversals. With this tool, traders can: Detect sell signals (classic H&S) and buy signals (inverse H&S) with accuracy. Easily visualize patterns
ETE Detector puissant
N'da Lemissa Kouame
中文 – 商业说明 Logiciel – ETE DETECTOR POWER v5.0 自动识别“头肩形态” PUISSANCE DU DÉTECTEUR ETE v5.0 是专业交易工具,帮助交易者 提前捕捉市场重要反转 ,利用最强大的图表形态之一: 头肩形态(H&S)及其反转形态 。 Fonctionnalités MaxObjects ,即使在繁忙图表或多时间框架下,指标仍然保持流畅和清晰。 主要功能 实时自动识别 经典 H&S (卖出) et H &S (买入) 清晰显示 肩部、头部和颈线 自动绘制 反转区域 (红色 = 卖出,绿色 = 买入) ACHETER/VENDRE 箭头 即时显示交易机会 智能循环对象管理,避免图表拥堵 完全可自定义参数:分析蜡烛数量、肩头最小距离、对称容差、最大图形数量、矩形样式、标记大小和颜色 交易者优势 节省时间:自动分析市场 高精度:可调容差确保仅识别可靠形态 可视性最佳:彩色区域、箭头、标签和颈线 兼容所有策略:波段、日内、剥头皮 Version :不会拖慢 MT5
Dynamique mensuelle des plages hautes et basses v1.0 Auteur : KOUAME N'DA LEMISSA Description : L' indicateur dynamique mensuel de fourchette haute et basse affiche les niveaux mensuels clés sur votre graphique grâce à des fonctionnalités avancées de suivi dynamique. Il permet aux traders de visualiser facilement les zones de support et de résistance mensuelles, ainsi que les zones où le prix tend à dépasser ou à tester ces niveaux, offrant ainsi des opportunités de trading précises. P
每月高低动态范围 + 流动性区域 v1.2 作者: KOUAME N'DA LEMISSA 描述: 使用此强大的指标提升您的市场分析能力,它结合了: 关键月度水平: 高点(High)、低点(Low)、开盘(Open)和收盘(Close),用于识别最重要的支撑和阻力区域。 动态高低范围: 自动追踪极端价格波动,检测重要市场变动。 流动性区域: 可视化矩形显示流动性集中区(买/卖)。这些区域的厚度和颜色可完全自定义,以确保图表上最佳可见性。 适用于所有交易品种和经纪商: 可在外汇、股票、指数和加密货币中完美运行。 主要功能: 自动检测月度 High、Low、Open 和 Close 水平。 显示动态高低范围以追踪极端波动。 可视化流动性区域,可自定义边框厚度和颜色。 支持所有时间周期。 完全可配置的参数,可根据您的交易风格进行调整。 指标设置: Ref_Timeframe: 用于计算水平的参考时间周期(默认:Monthly)。 Ref_Shift: 参考K线(0 = 最新已完成的K线)。 LiquidityBuyColor / LiquiditySellColor: 买入/卖出流动性区
Booster Trading Pro V
N'da Lemissa Kouame
Chinois (Chinois / 中文) Booster Trading Pro pour KOUAME N'DA LEMISSA : MetaTrader 5 描述 Le produit Booster Trading Pro est le suivant : 月度关键水平: 高点、低点、开盘和收盘,快速识别支撑和阻力区域。 动态高低范围: 跟踪价格在月度水平上下的极端波动。 动态开盘范围: 相对于月开盘检测关键价格水平。 自动流动性区域: 使用动态彩色矩形可视化潜在买卖区域。 主要特点 兼容所有交易品种和时间周期。 实时更新动态水平。 可自定义颜色和厚度,灵活调整区域显示。 清晰显示月度水平和动态范围,便于快速阅读图表。 Il s'agit d'une application MetaTrader 5. 交易者优势 快速决策: 快速识别关键区域,无需浪费时间。 清晰可视化: 流动性区域和动态范围简化图表分析。 多功能性: 适用于剥头皮、日内交易或波段交易。 节省时间: 所有关键工具集中在一个指标中。 可自定义参数 Ref_Timeframe: 用于计算月度水平的参考周期
Structure de fusionBlocsAuto + MensuelOU 结构力量与月度精度结合 产品说明 Fusion StructureBlocksAuto + MonthlyOR 是一个集成的高级指标,将 市场结构分析 (自动检测 swing 高点/低点 与结构区块)与 月度开盘区间 (Plage ouverte mensuelle, MOR ) 键的月度水平,帮助你实时识别高概率交易区和市场动力的变化。 使用此工具你可以 : 自动识别 支撑/阻力结构区块 balançoire 通过自动连接 swing 显示月度的:开盘价、高点、低点和收盘价水平 检测 Monthly Open Range 的突破水平 将 市场结构 + 月度背景 结合起来以获取更强的确认 主要功能 支持与阻力结构区块的自动检测 动态绘制月度开盘、最高、最低、收盘水平 在主要 swing点间绘制趋势线 提供 Open Range 高点与低点视图以追踪初始动能 区块半透明显示,图形渲染平滑 优化设计,实现最小滞后与重算 适用于所有时间周期与交易品种 (外汇、
Channel Ultima
N'da Lemissa Kouame
Channel Ultima – 动态多级通道指标 简短描述 Canal Ultima s'en charge . ​晰显示 支撑位、阻力位及平衡区 ,非常适合技术型和结构化交易者。 详细介绍 Channel Ultima s'appelle Channel Ultima . ​ 短期通道 :快速市场波动 中期通道 :中等趋势 长期通道 :整体市场结构 算法自动识别 重要高低点 ,计算 上/中/下线 ,并 动态延伸 以实时跟踪市场走势。 目的与优势 可视化 多层次市场结构 识别 流动性区和反转区 指导 突破或反弹的入场和出场 可与其他指标配合确认信号(Kijun, Donchian, FZG) Channel Ultima 提供 市场视觉指南针 ,对结构化交易策略至关重要。 主要特点 三个独立通道(短期、中期、长期) 自动识别 枢轴高低点 动态 上/中/下线 自动延伸至最新蜡烛 颜色区分明显, 一目了然 适用于 所有资产和时间框架 轻量快速,实时计算 ️ 可自定义参数 参数 描述 LookbackBars 用于枢轴检测的蜡烛数量 Swi
nstitutional Liquidity Map Pro — votre compas pour tous les aspects institutionnels de votre économie ! Institutional Liquidity Map Pro — 专业流动性地图指标 Carte de liquidité institutionnelle Pro 是一款为专业交易者打造的强大工具,帮助您实时识别市场中的 流动性区域 与 机构资金行为 。 主要功能 : 自动识别 流动性区域 (高点/低点、假突破、吸流动作) 支持所有周期(M1 et MN1) Blocs de commande ) ​ ​ 提供 流动性突破提醒 和 价格反应提示 与任何指标或策略兼容 ️ 优势: 直观展示市场结构,揭示"聪明资金"位置 适用于外汇、指数、加密货币、黄金等多种市场 图形化展示清晰易懂,新手也能快速上手 专为 Smart Money Concepts (SMC) 与 ICT交易理念 设计 Institutional Liquidity Map Pro ——
筛选:
无评论
回复评论