Dynamic Linear Regression Channel
- Indicators
- Quang Huy Quach
- Version: 3.0
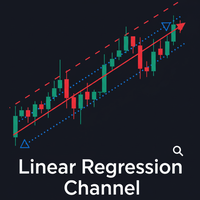
The Linear Regression Channel is a powerful technical analysis tool that helps visually identify the prevailing trend and potential price zones.
Essentially, the indicator performs two main functions:
- It draws a trendline through the center of price action over a specified period. This line is calculated using the linear regression method, which results in the best possible "line of best fit" for the price data.
- From this center line, the indicator plots two parallel lines above and below, creating a price "channel." These lines are placed at a set number of standard deviations away from the center line.
The result is a dynamic channel that automatically updates with market movements, helping you to easily identify the trend and dynamic support/resistance levels.
Indicator Components
The indicator displays the following visual components on the chart:
-
Live Channel (Green/Red):
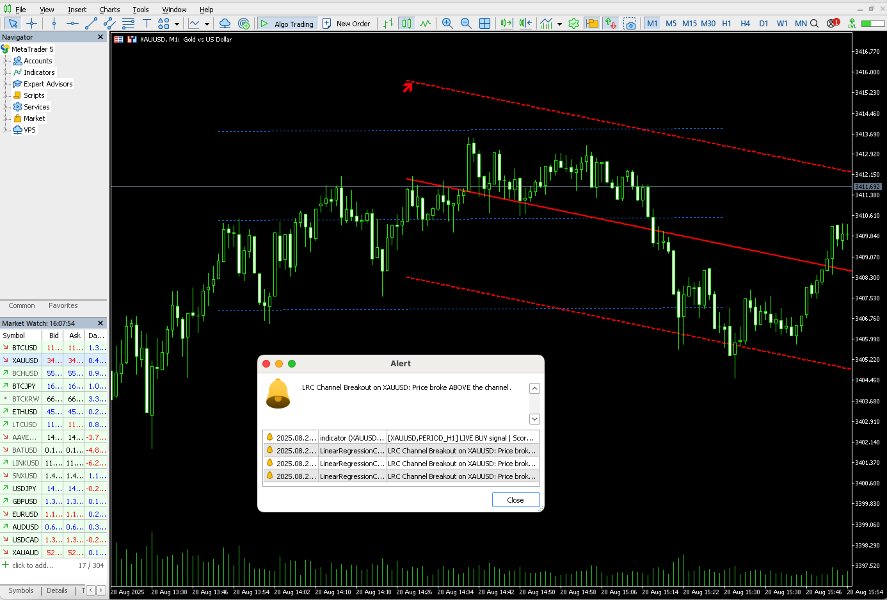
- Center Line (Solid): This is the linear regression line, representing the "fair value" of the current trend.
- Upper & Lower Channels (Dashed): These act as dynamic resistance (upper) and support (lower) levels. The price tends to oscillate within these two lines during a sustained trend.
-
Broken Channel (Blue, Dotted):
- When a trend ends and reverses, the indicator "stamps" the old price channel onto the chart.
- Purpose: This helps you visualize the structure of the previous trend, identifying past support/resistance zones that the price may react to in the future.
-
Trend Status Label (Arrow):
- A small arrow at the beginning of the live channel indicates the status of the current trend.
- Vertical Arrow (Up/Down): The trend is strengthening (accelerating).
- Diagonal Arrow (Up/Down): The trend is weakening (decelerating).
- Horizontal Arrow: The market is ranging (no clear trend).
How to Apply in Trading
This is a versatile indicator that can be used in several ways:
a. Trend Following
This is the most basic and safest method.
- Identify the Trend: If the channel is sloping upwards, you should only look for BUY opportunities. If the channel is sloping downwards, you should only look for SELL opportunities.
- Find Entry Points:
- In an uptrend (upward sloping channel), wait for the price to pull back to the center line or the lower channel line. These are potential buying zones.
- In a downtrend (downward sloping channel), wait for the price to rally to the center line or the upper channel line. These are potential selling zones.
b. Short-Term Mean Reversion
This strategy is riskier and requires more experience.
- When the price touches or exceeds the upper channel, it can be considered "overbought." You might look for a short-term SELL order with the expectation that the price will revert to the mean (the center line).
- When the price touches or falls below the lower channel, it can be considered "oversold." You might look for a short-term BUY order with the expectation that the price will bounce back towards the center of the channel.
c. Spotting Trend Changes
- "Broken Channel" Event: The appearance of a blue, dotted channel is a very clear visual cue that the previous trend has ended. This is a time to be cautious with existing trades and prepare for a new trend.
- "Trend Flip" Alert: Enable alerts to get an immediate notification when the channel's slope changes direction.
- Channel Breakout: When the price closes decisively outside the live channel, it can be an early sign that the current trend is ending and a new, stronger trend may be starting in the direction of the breakout. Use the "Channel Breakout" alert for this.
Explanation of Input Parameters
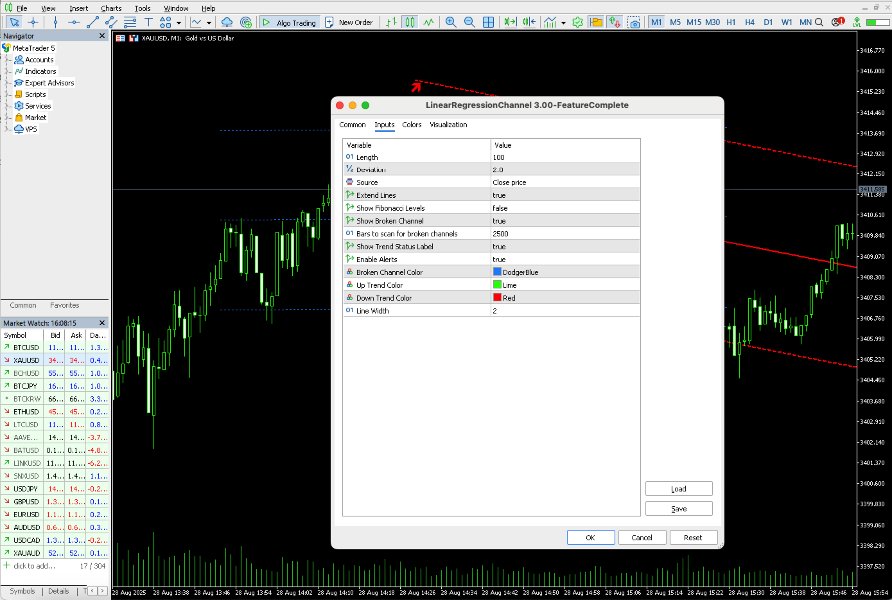
- InpLength : The number of bars used to calculate the channel.
- A higher value (e.g., 200) creates a more stable channel, suitable for higher timeframes and long-term trends.
- A lower value (e.g., 50) creates a more responsive channel that follows the price more closely but can be "noisier."
- InpDeviation : The width of the channel, measured in standard deviations.
- 2.0 is a standard value that contains about 95% of the price data.
- Increase this value for a wider channel, or decrease it for a narrower one.
- BrokenChannelScan : IMPORTANT! This is the number of past bars the indicator will scan for broken channels on startup.
- The default of 2500 is a good balance between performance and detail.
- For the fastest possible performance, set this to 0 .
- If you need to see very old broken channels, you can increase this number.
- ShowTrendLabel : Toggles the trend status arrow on or off.
- EnableAlerts : Toggles all alerts (trend flips, channel breakouts) on or off.
- Other Parameters: Allow you to customize the colors and width of the lines, whether to show Fibonacci levels inside the channel, and whether to extend the lines into the future.




























Incredible design and concept, backtesting very slow have to use simulator. Best of this type indicator I have seen, quality on all products very good, great work!