Session Indicator
- Indicators
- Version: 1.0
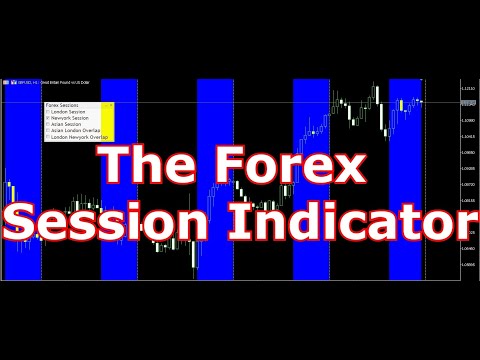
Having trouble marking where the various forex sessions start and end? Or perhaps your strategy requires you trade only in a specific session, then this is for you.
The session indicator shades the session you require in a certain color so that you can identify it easily. The sessions shown include: London session, New York session, Asian Session, Asian - London overlap and London - New York Overlap.
Difference source give varying time ranges for the various session, mostly differing by not more than an hour. In the development of this indicator, the time ranges given by Forex Factor where chosen as the source is credible and interpreting the time-zone table is straight forward.
note: Works for timeframes of H1 and below. Displaying sessions in H4 and above will result in inaccurate results.
For me free stuff visit: https://abctrading.xyz/Session_Indicator.html