Parabolic SAR Deviation BigBeluga
- Indicators
-
Aleksei Beliakov
 Hello my friend. let me perform this job for you.
My Portfolio is https://www.mql5.com/en/users/goverkms/feedbacks
Why you will choose me: - Version: 1.2
- Updated: 20 March 2025
- Activations: 5
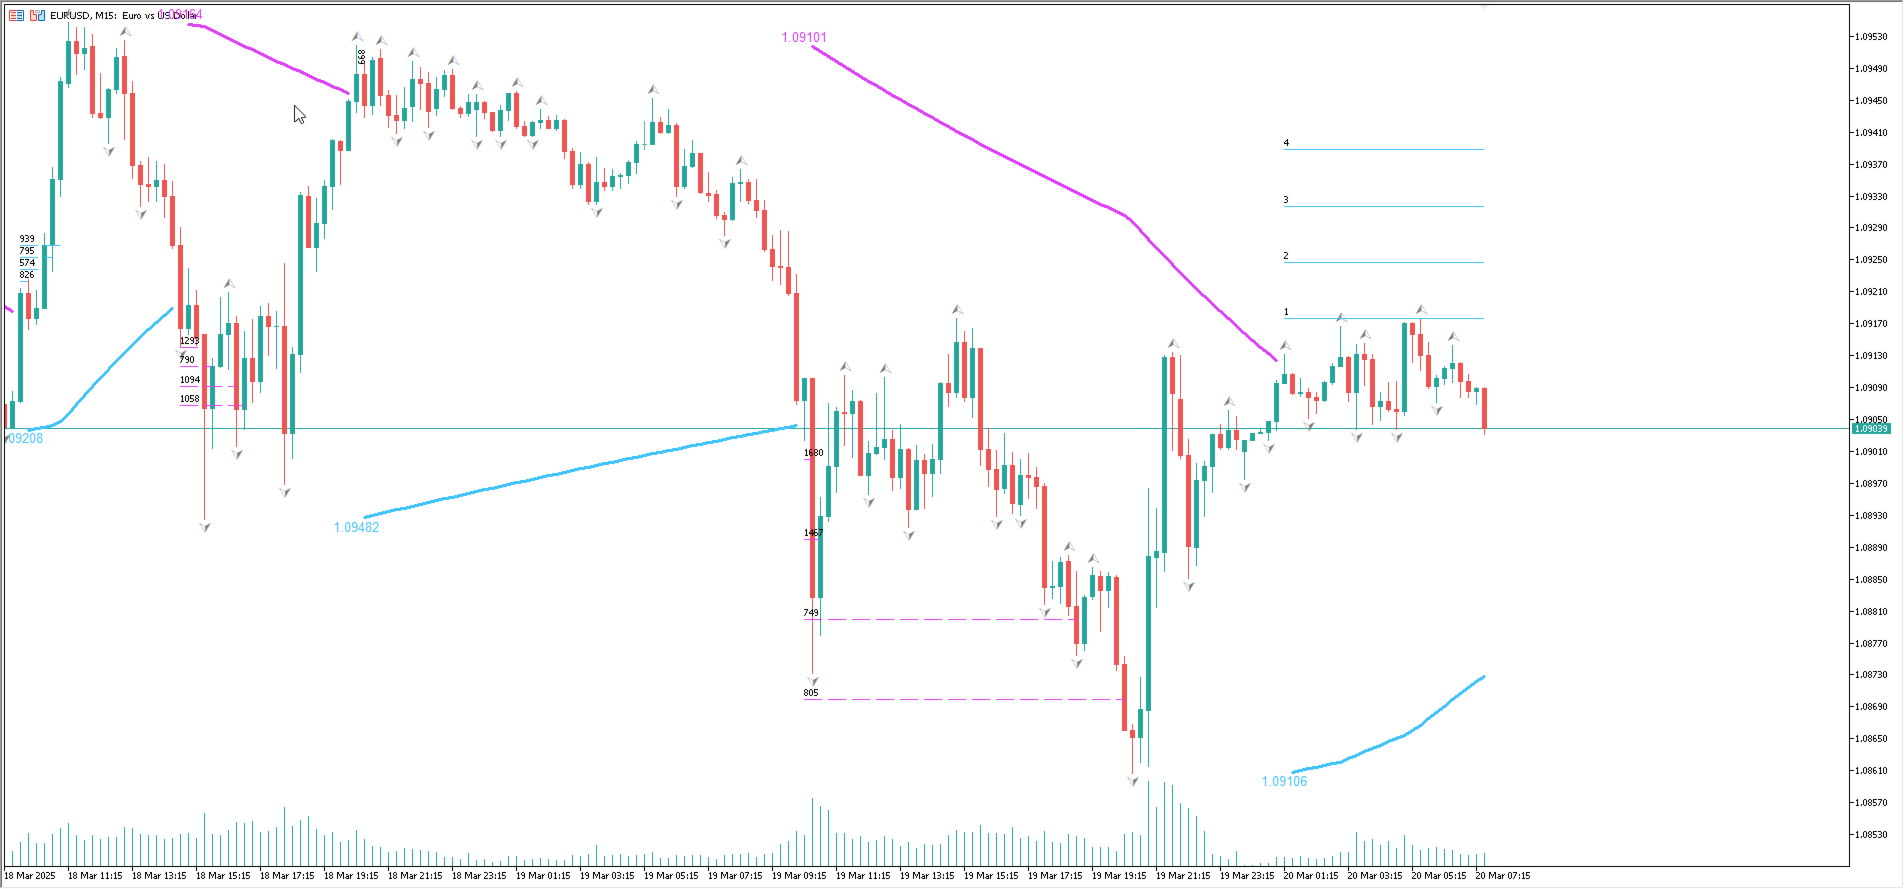
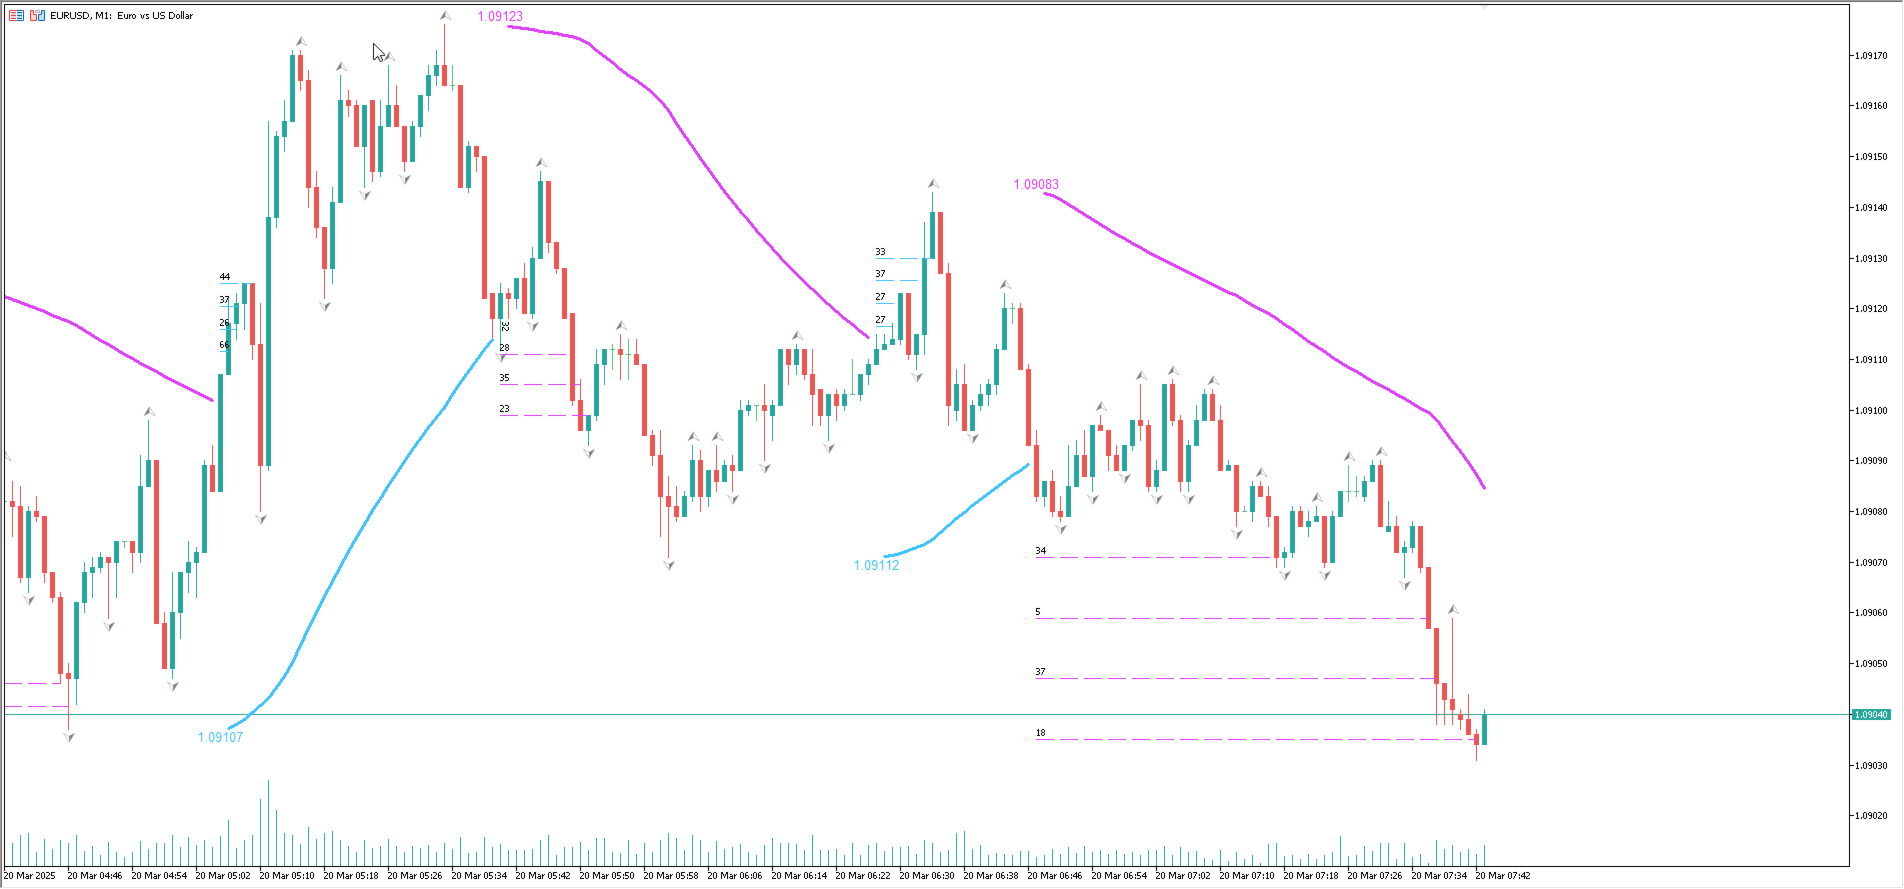
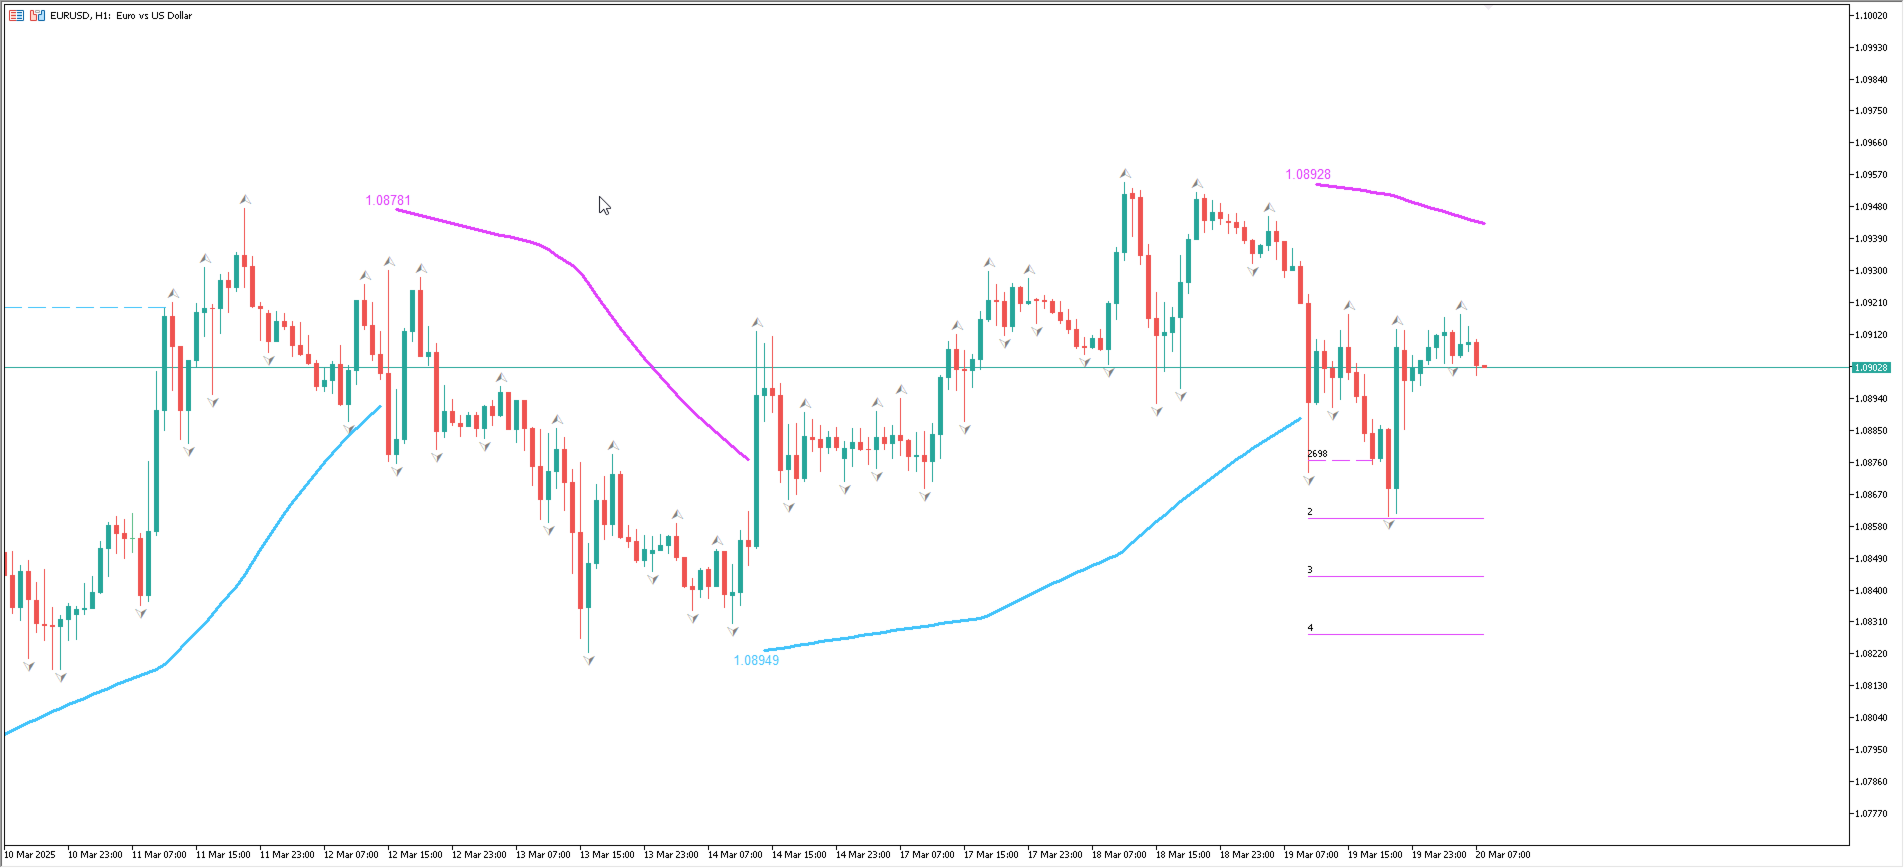
Parabolic SAR + Deviation [BigBeluga] is an enhanced Parabolic SAR indicator designed to detect trends while incorporating deviation levels and trend change markers for added depth in analyzing price movements.
🔵Key Features:
> Parabolic SAR with Optimized Settings:
- Built on the classic Parabolic SAR, this version uses predefined default settings to enhance its ability to detect and confirm trends.
- Clear trend direction is indicated by smooth trend lines, allowing traders to easily visualize market movement
Trend Change Markers:
- When a trend change occurs based on the SAR, the indicator plots "price value of the trend change" at the trend change point.
> Deviation Levels:
- Four deviation levels are automatically plotted when a trend change occurs (up or down).
- Uptrend: Deviation levels are positioned above the entry point.
- Downtrend: Deviation levels are positioned below the entry point.
- Levels are labeled with numbers 1 to 4, representing increasing degrees of deviation.
> Dynamic Level Updates:
- When the price crosses a deviation level, the level becomes dashed and its label changes to display the volume at the breakout point.
- This volume information helps traders assess the strength of the breakout and the potential for trend continuation or reversal.
- High volume at a breakout may indicate strong momentum, while low volume could signal potential exhaustion or a false breakout.
🔵Usage:
- Identify Trends: Use the trend change triangles and smooth SAR trend lines to confirm whether the market is trending up or down.
- Analyze Deviation Levels: Monitor deviation levels **1–4** to identify potential breakout points and assess the degree of price deviation from the entry point.
- Observe Trend Change Points: Utilize the triangles and price labels to quickly spot significant trend changes.
- Volume Insights: Evaluate the volume displayed at crossed levels to determine the strength of the breakout and assess the likelihood of trend continuation or reversal.
- Risk Management: Use deviation levels as potential stop-loss or take-profit zones, depending on the strength of the trend and volume conditions.
Parabolic SAR + Deviation [BigBeluga] is an essential tool for traders seeking a straightforward yet powerful method to identify trends, analyze price deviations, and gain insights into volume dynamics at critical breakout and trend change levels.