Watch the Market tutorial videos on YouTube
How to buy а trading robot or an indicator
Run your EA on
virtual hosting
virtual hosting
Test аn indicator/trading robot before buying
Want to earn in the Market?
How to present a product for a sell-through
New Technical Indicators for MetaTrader 5 - 6
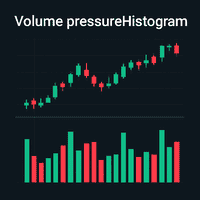
1. Overview The Volume Pressure Histogram (VPH) is a custom indicator for MetaTrader 5 (MT5) that measures buying and selling pressure based on tick or real volume. It highlights extreme buying/selling moments and provides a smoothed signal line for trend detection. 2. Indicator Components · Volume Pressure Histogram (Colored): o Green: Extreme buying pressure o Lime: Buying pressure o Red: Extreme selling pressure o Yellow: Selling pressure · Signal Li
ADX Wilder (Average Directional Movement Index by Welles Wilder) enhanced with fully customizable pop-up and push notifications. Get instant alerts directly on your platform and mobile device when: +DI crosses above –DI → Potential bullish trend start –DI crosses above +DI → Potential bearish trend start ADX crosses above your chosen strong-trend level (default 25) → Confirmation of strong trending market Features: 100% identical to the original MetaQuotes ADX Wilder calculation Clean, visible

Projected Moving Average A clean and practical moving-average tool designed for traders who want a clearer view of short-term and medium-term trend direction. The Projected Moving Average shifts a standard SMA forward by half of its period, creating a smooth projection zone that updates dynamically with each new candle.
This makes it easier to visually anticipate where the moving average is heading without repainting past values. Key Features Forward-shifted SMA (Length/2) for clearer trend

Institutional OrderFlow Insight Smart Money Concepts (SMC) Indicator for MetaTrader 5 Professional trading tool that reveals institutional order flow, market structure, and smart money activity through advanced Smart Money Concepts (SMC) analysis. SMART MONEY CONCEPTS SUITE Market Structure Analysis: Break of Structure (BOS) Detection - Identify trend continuation Change of Character (CHOCH) Recognition - Spot trend reversals Swing Point Analysis - Professional high/low detectio

Power To Move (PTM) – The Market Energy Engine
Stop guessing direction. Start measuring Power.
Trading is not just about Up or Down; it is about Energy . A market without energy is a trap. Power To Move (PTM) is a statistical "Physics Engine" for your chart. It integrates Price Action, Volume, Momentum and Range into a single Energy Vector.
Instead of lagging indicators, PTM tells you the current thermodynamic state of the market: Expansion (Green Zone): Energy is entering the sys

EUR/USD PRO — Institutional Composite Indicator
A professional-grade indicator optimized specifically for EUR/USD, integrating institutional analysis concepts into a single tool. This system combines DXY MTF analysis, session-based VWAP, ADR/ATR metrics, market structure (BOS/CHOCH), SMC (FVG/OB), cross-asset correlations, and a confluence panel with a floating signal. It features a Neumorphic UI with movable panels, pip-calculated spread display, and structured logging. Designed for universal

True B Bands Advanced Bollinger Bands with squeeze detection, volatility tracking, and real-time dashboard for comprehensive market analysis.
Key Features Three colored band plots with automatic squeeze detection and volatility analysis Professional dashboard showing market analysis and trading signals in real-time Smart configurable alerts for band touches and squeeze conditions Adaptive trend identification with oversold and overbought detection
Dashboard Display Market Analysis : Trend sta

Hi Traders, Info Panel with PnL Coloring is a compact yet powerful on-chart dashboard for MT5.
It delivers real-time insights into Buy/Sell volume, symbol-based PnL, overall account performance, margin status, and detailed candle metrics.
With dynamic color-coding and a live candle countdown, this panel helps you monitor your essential trading information and market conditions instantly so that you can make decisions with greater clarity and precision. Abbreviations (current candle information)

# Product Name: SamuraiFX Pro Volume Profile & Signals (MT5) **Stop Trading Blindly. See Where the "Smart Money" is Moving. ** Most indicators only tell you *when* price moved. **SamuraiFX Pro** reveals *where* the volume actually is. This institutional-grade tool combines **Volume Profile**, **VWAP**, and **Price Action Analysis** into one clean, non-repainting chart overlay. It automatically detects the daily market structure and provides high-probability **Buy & Sell arrows** based on institu

**Zonar Smart Analysis** is a complete "Smart Money" trading system designed for MetaTrader 5. It automates the classic **Opening Range Breakout (ORB)** strategy while filtering false signals using advanced Price Action algorithms (Wick Rejection & Swing Analysis). Stop guessing where the session is going. Let Zonar draw the zones, identify the breakout, and highlight institutional Order Blocks for maximum confluence. ### Key Features * **Automated ORB Box:** Automatically detects the Market

Product Name: SavasaLaS Tutelage | Pro Price Action Compass Stop guessing. Start trading with Confluence. SavasaLaS Tutelage is not just an indicator; it is a complete trading system designed for the serious Price Action trader. It eliminates chart noise by strictly enforcing the three pillars of institutional trading: Market Structure , Trend Direction , and Candlestick Verification . Unlike standard indicators that flood your chart with weak signals, SavasaLaS Tutelage waits for the "Perfect O
FREE
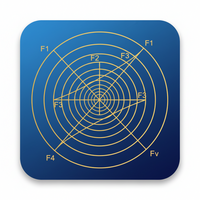
# ** Multi-Timeframe Fibonacci Levels Pro**
** Transform Your Trading with Institutional-Grade Fibonacci Analysis **
Multi-Timeframe Fibonacci Levels Pro is a revolutionary MetaTrader 5 indicator designed for day traders and scalpers. It automatically calculates and displays Fibonacci retracement levels from multiple higher timeframes directly on your 1-5 minute charts, giving you complete market structure visibility without switching between timeframes.
---
## ** Key Features**
*

OHLC & Smart Sessions
"Professional Market Structure Tool: Combine Daily OHLC Levels with Real-Time Session Analysis"
DESCRIPTION Professional trading indicator that combines Previous Day OHLC analysis with intelligent trading session tracking. Identifies key market structure levels, session highs/lows, and provides multi-channel alerts for precise trading decisions.
FULL DESCRIPTION
TRANSFORM YOUR TRADING WITH INSTITUTIONAL-GRADE ANALYSIS
Are you tired of manually drawing daily level
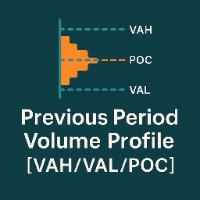
Previous Period Volume Profile [VAH/VAL/POC] — Professional Institutional-Level Reference Levels Previous Period Volume Profile gives traders instant visual access to the most important volume-based levels from the prior session: Point of Control (POC) , Value Area High (VAH) , and Value Area Low (VAL) .
These levels are widely used by professional traders to anticipate liquidity magnets, rotation zones, high-probability reversals, and continuation setups. Unlike full histogram packages that

ESTruePivot – Advanced Pivot & Fractal Noise Filter ESTruePivot is a next-generation pivot detection engine designed to identify true market turning points with exceptional precision. It removes weak fractals, filters chart noise, and highlights only the most meaningful peaks and bottoms — making it ideal for professional price-action and structural analysis. Unlike traditional fractal indicators or ZigZag tools, ESTruePivot uses an advanced smart-replacement algorithm that continuously evaluate
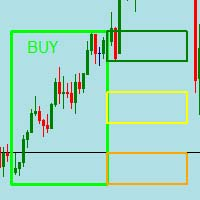
This is a simple indicator that indicates possible buy or sell trades. Apply indicator to chart and wait for retest to zones, apply with your risk management and own trend analysis and you can be profitable. This work best on the 5 minute timeframe. Apply to chart, you will then be able to change, switch times when blocks must appear on and off. You can fully customize the indicator at the input setting so make sure to take a look, you can adjust it to your preference.
when block closes ( bu
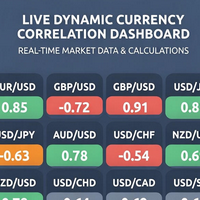
Live Dynamic Currency Correlation Dashboard Stop Trading Blind. See Live Market Correlations in Real-Time. The most advanced correlation tool for MetaTrader 5. Calculate live correlations from actual market data. Click any pair to open its chart instantly. Make smarter trading decisions with real-time insights. Why This Changes Everything Traditional correlation tools show outdated historical data. This dashboard calculates correlations live from your broker's price feed every 5 minutes. Watc

Overview:
This is a trend-following "Sell Only" scalping indicator designed for high-volatility markets (like Synthetic Indices). It identifies strong downtrends and looks for overbought spikes (exhaustion) to trigger immediate sell entries. Works best on Crash 300 Market 5M. 1. Indicator Settings: 2 0-period Exponential Moving Average (EMA) . Min bars between arrows: 1. The rest of the settings leave as default 2. Trade Management:
Stop Loss level : (Default: 20,000 points above entry).

Daily Range and Ceiling Indicator The Daily Range and Ceiling Indicator is a technical analysis tool designed for the MetaTrader 5 platform. It combines price history, statistical volatility data, and volume analysis to create a reference map for the trading day. This tool assists traders in identifying potential support and resistance levels, trend breakouts, and market exhaustion points Key Features Average Daily Range Targets The indicator automatically plots thick green and red lines on the
FREE

Market Structure Order Block Dashboard MT5 Market Structure Order Block Dashboard MT5 is an indicator for MetaTrader 5 that automates the analysis of market structure and ICT / Smart Money concepts. It does not open or manage any trades: it is a visual analysis tool , not a trading robot. What the indicator shows The indicator scans the chart and highlights the following information: Market structure: significant swings, HH, HL, LH, LL Breaks of structure: Break of Structure (BOS) and Change of

VIP Scalper is a professional Forex scalping indicator designed for traders who need accurate signals, minimal stop-loss, and high stability.
The indicator is ideal for M1 trading and performs excellently on volatile currency pairs with low spreads. Key Benefits Highly accurate scalping signals Stop-loss 2–3 pips, take-profit up to 10 pips Minimum false signals thanks to trend filtering Simple logic with one key parameter Works on EURUSD, GBPUSD, AUDUSD, EURJPY and other pairs Compatible with S

The official release price is $65 only for the first 10 copies, the next price is $125 Gold Scalper System is a multifunctional trading system that combines a breakout strategy for key liquidity levels with confirmation and a built-in Smart DOM Pro module for market depth analysis. The system identifies zones of limit order accumulation, tracks activity at support and resistance levels, and generates signals at the moment of their breako

Haven Bar Replay — Your Personal Trading Simulator Introducing Haven Bar Replay – a professional simulator for manual trading and strategy testing. It transforms your MT5 chart into a historical player, allowing you to live through months of market movements in just a minutes. Check out my other products -> CLICK HERE . Do you want to learn how to trade profitably but aren't ready to wait hours for setups to form? This tool is designed for you. Train your eyes, test hypotheses, and hone yo
FREE
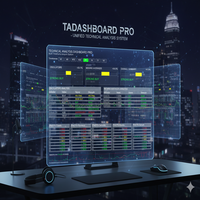
Technical Analysis Dashboard Pro (TADashboard Pro) – Unified Technical Analysis System TADashboard Pro is an advanced technical analysis panel that consolidates multiple indicators and timeframes into a single visual interface. Designed for traders who demand precision and efficiency , the system simultaneously analyzes 7 oscillators and 4 moving averages across 8 different timeframes , generating normalized scores that simplify decision-making. Key Features: Multi-Timeframe Analysis: Easily mon
FREE

Capital Vault System is a professional technical analysis suite for MetaTrader 5 engineered to identify market structure and adaptively filter market volatility. Unlike static indicators, this system integrates three mathematical models— Maximum Entropy Spectral Analysis (MESA) , Fractal Dimension , and Harmonic Geometry —to distinguish between directional trends and non-linear consolidation ranges. It includes an embedded Risk Management Dashboard designed to assist traders in real-time positio

Tady máš anglický text s přidanými ikonami pro lepší přehlednost a atraktivitu — připravený ke kopírování: Buyer Seller Balance Analyzer provides a comprehensive overview of buyer and seller strength across multiple timeframes. Main components: Buyer/Seller Balance Table Displays the ratio of buyers and sellers Covers timeframes from M1 to MN1 Color-coded values (green = buyers, red = sellers) Key metrics: Buyers (%) – Percentage of buyers Sellers (%) – Percentage of se

English ICT_SuperTrend is an "All-in-One" tool designed to help traders see the complete market picture without needing to open multiple overlapping windows. Here are the main advantages of this indicator: Hybrid Trading System The biggest advantage of this tool is combining Trend Following with Smart Money Concepts / ICT (Price Structure) . SuperTrend: Tells the main market direction, whether to look for Buy or Sell trades. ICT Concepts: Identifies structural key points such as important suppor

Indicator: Currency Strength Meter Pro Market Breadth Visualization Pros: Instead of looking at cluttered charts, this indicator displays data in a clean "Dashboard" format. Traders can instantly scan and know which pairs are the strongest or weakest. Benefits: Saves time checking individual charts and helps make faster trading decisions on pair selection. Auto-Ranking & Sorting Pros: Features a "Horizontal Ranking" mode which automatically sorts pairs from "Strongest" to "Weakest". Benefits: Al

Trend Catalyst Pro Professional Multi-Trend Indicator with 7-fold Confirmation, Smart Alerts, News Overview, and Integrated Dashboard for MetaTrader 5. Trend Catalyst Pro combines the signals from seven proven market indicators into a single, clear score. Instead of analyzing each indicator individually, you get a visible result on the chart candle: Arrows and text such as "6/7 LONG" or "7/7 SHORT" Color-coded candles based on signal strength A dashboard showing all values clearly in real-time
FREE

Signal indicator for binary options, which is also effectively used on Forex and other markets. It is suitable for short-term grid trading on M1–M5 and includes signals for step-by-step scaling into positions. The free version works only on the XAUUSD pair. The full version for MetaTrader 5 is here: https://www.mql5.com/en/market/product/156185 The indicator uses two-level adaptation: a basic speed profile (“fast/smooth” setting from the very start) and auto-adaptation based on trade results, wh
FREE

Analytics Dashboard is an indicator which analyses your past and present trades and prepare analytical dashboard which you can view with additional piecharts as details view. Mainly four categories of analysis are considered: 1)Performance metrics 2) Trade behaviors metrics 3) Execution quality metrics and 4) Position Level metrics. The four generic analytical metrics have been further broken into more specific metrics as below. Performance Metrics: gross profit gross loss overall profit fac
FREE

Fine Timeframes is a sub-minute timeframe indicator for MT5. It creates charts with intervals from 1 to 30 seconds, giving you access to market movements that remain invisible on minute and hourly charts, while preserving full trading functionality: you can open and close positions just like on standard timeframes. Fine Timeframes works only on live ticks and is not designed for the Strategy Tester — download the demo version and test the indicator under real market conditions on EURUSD and AUDU
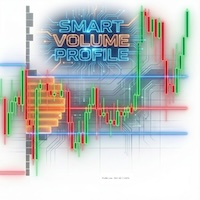
English Scan for "Smart Money" (Volume Markers): Arrows indicate abnormal volume (higher than average) with clear green/red color coding. This helps identify "Smart Money" entries and filter out fake signals. Critical Alerts: No need to stare at the screen. The system notifies you immediately when the price crosses the POC (Point of Control), which is often a decisive point for trend continuation or reversal. Instant Market Structure (Developing Profile): Displays the profile of the current form

TRADING REPORT Mini-dashboard for MetaTrader 5 Main features Updates on every tick (open position and floating P/L in real time) Current position details (BUY/SELL + volume + entry price + floating P/L with green/red color) Daily P/L and today’s balance change Full statistics: Balance, Equity, Total trades, Wins/Losses, Winrate (%), Profit Factor, Best trade, Worst trade Clickable “Report” button: one click to show, one click to completely hide the panel (perfect for cleaning the screen) Fully

PREDATOR DAILY LEVELS SOFTWARE:
Predator Daily Levels automates drawing daily High, Low, and Open (HLO) lines on MT5 charts, replacing manual level marking for efficient trading. It shows multiple days back with descriptive labels like "Monday High," color-coded lines (crimson highs, forest green lows, light coral opens), and customizable width, style, and font sizes. Updates occur automatically on new bars and chart changes for real-time precision across all symbols and timeframes.
Key Fe

Buyer Seller Arrows – Trade with Confidence! Discover a revolutionary tool for visual analysis of buyer and seller strength across all timeframes – from M1 up to MN1. This indicator gives you an instant overview of market dynamics with color‑coded percentages and arrows. Key Features: Green upward arrows = buyer dominance Red downward arrows = seller dominance Percentage strength for each timeframe (M1, M5, M15, M30, H1, H4, D1, W1, MN1) Color coding for quick orientation (bright green and

GOLD & CURRENCY STRENGTH SUITE
Professional 7-tab dashboard for real-time currency strength analysis, correlation tracking, and session-based trading intelligence. Zero repainting. Immediate setup.
Overview
Currency Strength Suite provides comprehensive multi-currency analysis through seven specialized panels. The system tracks strength across 8 currencies plus Gold, identifies correlations, analyzes session performance, and scans opportunities across multiple timeframes.
Core Features
Rea

Advanced SMC & Volumetric Order Block Indicator Overview
This enhanced-grade for MetaTrader 5 indicator is designed to decode market behavior using Smart Money Concepts (SMC) method . It goes beyond standard price action analysis by integrating Volumetric Data directly into market structure, helping traders identify high-probability reversal and continuation zones with precision. Key Features Volumetric Order Blocks: A unique, split-gauge visualization within Order Block zones that disp
FREE

The SSL ST Strategy MT5 Indicator is a technical analysis tool designed to help traders identify buy and sell signals clearly on the trading chart. It offers visual indicators like lines and arrows, alongside sound, popup, and push notifications to alert traders promptly when a trading opportunity arises. Key Advantages Provides clear visual signals directly on the chart using colored lines (SSL1 and Baseline) and arrows for buy (green triangle) and sell (red triangle) signals. Supports sound a
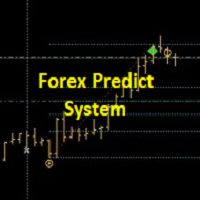
+++++++++++++++++++++++++++++++++++++++++++++++++++++++++++++++++++++++++++++++++++++++++++++++++ +++ Link to EURUSD Only Free Version --> https://www.mql5.com/en/market/product/156904?source=Unknown +++++++++++++++++++++++++++++++++++++++++++++++++++++++++++++++++++++++++++++++++++++++++++++++++ Hallo Trader, This is a traditional GANN & FIBONACCI strategy based on detection of an impulsive move in the opposite direction. This is called a Breakout. At the moment of Breakout, the indicator draw

Hamzai SR Levels Pro Gold Support Resistance is a multi-timeframe MT5 indicator that automatically maps the most reactive support and resistance levels from M5 to H4, designed for discretionary gold trading yet flexible enough for any symbol. It scans historical price action, isolates swing highs/lows, and clusters them to draw clean horizontal levels while respecting minimum distances per timeframe to avoid clutter. Integrated arrow alerts highlight breakout and rejection patterns, using blue

The Volume Impulse indicator identifies a specific chart pattern that develops on price bars and volume. It detects a proprietary reversal and trend pattern I designed. This signal is a strong indication of an imminent price movement in the indicated direction. Of course, I always recommend contextualizing the chart reading. For example, avoid buying when the stock is already at its monthly highs or shorting when it is at the current month’s lows. Combine it with support/resistance levels, overa

RockSolidInstitutional V14 - Adaptive Multi-Timeframe Professional Trading System RockSolidInstitutional V14 is an advanced technical analysis indicator for MetaTrader 5 that delivers institutional-grade market analysis across all trading styles and timeframes. This comprehensive system combines sophisticated pattern recognition with adaptive market regime detection to provide high-quality trading signals.
Core Technical Capabilities Multi-Timeframe Adaptive Engine - Automatic Trading Mode D
FREE
Unlock Precision Trading: The ATR Dynamic Pivot System Download this free ATR Pivot Signals indicator and instantly gain an edge against market noise. This is the ultimate tool for traders who demand high-conviction entry points based on genuine market swing reversals, not guesswork. The ATR Pivot Signals system is an innovative technical indicator that utilizes the Average True Range (ATR) to dynamically filter volatility, ensuring that a signal is triggered only when a price move is
FREE
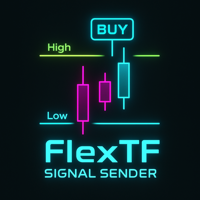
FlexTF Signal Sender — Multi-Timeframe High/Low Touch Confirmation Indicator Official Channel Updates, tools and documentation: Open official MQL5 channel | Best result Overview FlexTF Signal Sender is a multi-timeframe High/Low confirmation indicator designed for clean and structured signal generation. It reads High and Low from a higher timeframe (H1/H4/D1), monitors price interactions, and confirms BUY/SELL signals using candle-close logic on a lower timeframe (M5/M15/M30). The indic
FREE
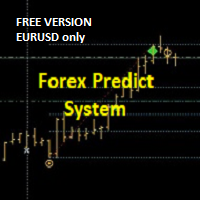
+++++++++++++++++++++++++++++
+++ FREE VERSION - EURUSD ONLY
+++++++++++++++++++++++++++++
Please add PREFIX and/or SUFFIX via settings if your Broker Chart Symbol is different (e.g. suffix = .r).
+++
This is forecast system.
On the moment of the breakout/forecast: the indicator draws retrace zone (yellow) and three targets. The levels act as support and resistance. It can be used on all pairs/indices/timeframes/periods. For the higher timeframes (H4, H1, M30) it's better to engage at Optima
FREE
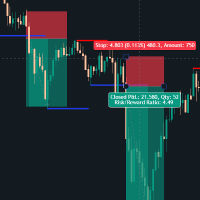
Support & Resistance Breakout Indicator This custom-built MT5 indicator automatically identifies key price levels where the market has historically reversed (support and resistance zones) and alerts traders when these levels are broken with conviction. What it does: The indicator scans price action to detect significant swing highs and lows, then draws dynamic support and resistance lines that extend forward until they're either replaced by a new level or broken by price. When a breakout occurs,

ALGO Smart Flow Structure Indicator The ALGO Smart Flow Structure Indicator is designed for serious traders who use objective Market structure. Forget noise and slow indicators; this tool provides you with a crystal-clear, unambiguous view of structural breakouts across all timeframes. Based on the rigorous rules of the ALGO Smart Flow methodology, the indicator filters out internal structure and only shows you the Major Structural Points (Swing Points) , ensuring you only trade at levels wh

BIG LOYALTY REWARD FOR EXISTING BUYERS!
did you buy this indicator? If yes, STOP! DO NOT BUY THE EA VERSION! As a thank you for your early support, I am giving you the fully automated **ICT Gold Sweeper EA** (Worth $149) for FREE!
HOW TO CLAIM YOUR GIFT: 1. Do not buy the robot. 2. Send me a **Private Message (DM)** here on MQL5. 3. I will verify your purchase and send you the EA file immediately.
We build winners together!
ICT Gold Sweeper: The Smartest Way to T
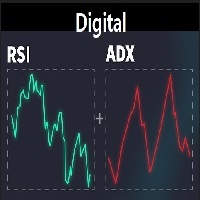
A lightweight digital indicator that combines the most important momentum tools directly on the chart. It displays real-time values of RSI, ADX, +DI, −DI, and DI Spread in a clean and compact format, without drawing any lines or graphical objects on the chart. Designed to provide fast insight into trend strength and the balance between buyers and sellers, without the need to open additional indicator windows. Fully customizable—font, size, and screen position can be adjusted easily.
FREE
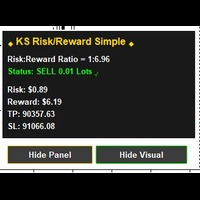
RR Ratio KS Simple Calculator Indicator Overview The RR Ratio KS Simple Calculator Indicator is a free, lightweight tool for MetaTrader 5 that automatically visualizes risk-reward (RR) ratios on your chart. Designed for manual traders and automated systems (EAs), it detects open positions with defined stop-loss (SL) and take-profit (TP) levels, then overlays clear visual zones to show potential risk and reward areas, including precise dollar amounts. This helps traders quickly assess trade setup
FREE
Mystic Pulse V2.0 is a trend-strength indicator built on the Directional Movement System (DI+ / DI−). It counts how many consecutive candles show increasing bullish or bearish momentum. Rising DI+ builds a Positive Count (uptrend pressure), while rising DI− builds a Negative Count (downtrend pressure). These counts reset when momentum weakens, giving a clear visual view of trend persistence and potential reversals. This MQL5 version is a conversion of the original TradingView script by chervolin
FREE
Overview Unlock a fresh perspective on your charts with the KS Invert Chart Pro Indicator – a powerful, zero-lag tool designed exclusively for MetaTrader 5. This innovative indicator inverts bars or candles mathematically (by multiplying price data by -1), revealing hidden patterns, contrarian opportunities, and inverse correlations that traditional views might miss. Perfect for advanced traders employing correlation strategies, multi-timeframe analysis, or hedge monitoring. Whether you're spott
FREE
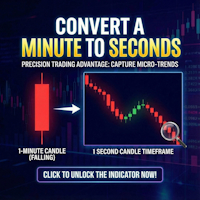
Second Timeframe Pro — See the Market Before Anyone Else!
Unlock a Hidden Level of Price Action
While other traders look at minute candles, you can see 60 candles within each minute!
What is Second Timeframe Pro?
It's a revolutionary indicator that creates full-fledged candlestick charts with second timeframes directly in MetaTrader 5.
Standard MT5 limits you to a minute chart. But the market doesn't stop every minute — it pulsates every second. Second Timeframe Pro removes this limitation

SUP – Support & Resistance Zone Detection Tool
The SUP Indicator is a professional trading tool designed to automatically detect and highlight Support and Resistance price zones on any market chart. Using advanced zone-mapping algorithms, it visualizes the strongest price levels where the market frequently reacts — helping traders identify entries, reversals, breakouts, and risk-management areas.
In addition to automatic detection, the indicator also allows you to manually add your own zones,

Session Finder – Track Forex Market Sessions with Precision
Stay ahead of the market with Session Finder , a sleek HUB style design for MetaTrader 5. It provides real-time visibility into the world’s major trading sessions—Sydney, Tokyo, London, and New York—so you always know which markets are open, closed, or about to change. Key Features: Live Session Status: See whether a session is currently open or closed at a glance. Countdown Timers: Track exactly how long until a session opens or close
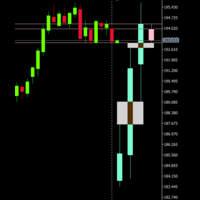
If you like this product, please give it a 5 star rating as a token of appreciation. This indicator projects Higher-Timeframe (HTF) candles onto the current chart and optionally shows their OHLC lines and Fair Value Gaps (FVGs) using ICT 3-candle logic.
Projects multiple higher timeframe candles.
Accurately preserves HTF OHLC on any lower timeframe.
Allows spacing adjustment between projected candles.
Optionally displays OHLC horizontal reference lines.
Automatically detects and draws HTF Fair
FREE
If you like this product, please give it a 5 star rating as a token of appreciation.
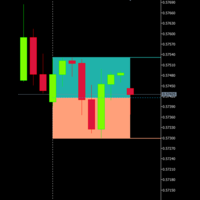
This indicator draws the premium and discount zones of a single candle from any timeframe on your chart.
You choose which candle (current or previous) using CandleOffset, and the indicator automatically retrieves that candle’s high, low, and midpoint.
It then visually displays:
Premium Zone (Upper 50%)
A shaded rectangle from the candle’s midpoint to high.
Discount Zone (Lower 50%)
A shaded rectangle from th
FREE
RSI Bollinger DualStrike Signals offers a clear and structured approach to identifying areas that may be favorable for potential trend reversals. By combining the RSI with Bollinger Bands, the indicator highlights moments when price shows signs of pressure or loss of momentum. The BUY/SELL signals help traders make more organized and disciplined decisions. It is a useful tool for scalping, day trading, or swing trading not to predict the market, but to improve the reading and understanding of pr
FREE
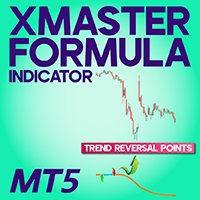
XMaster XHMaster Formula MT5 Indicator – No Repaint Strategy The XMaster / XHMaster Formula Indicator for MetaTrader 5 (MT5) is an upgraded version of the popular MT4 tool, designed to detect trend direction, momentum shifts, and high-probability reversal zones. With enhanced optimization for the MT5 engine, the indicator delivers stable No Repaint signals and performs efficiently on multiple asset classes including Forex, Gold, Cryptocurrencies, and Indices. The MT5 version integrates improved
FREE

Global Session 4X Indicator Global Session 4X is a visual indicator that displays active Forex trading sessions around the world in real time. Designed with precision and respect for market diversity, it covers financial hubs such as London, New York, Tokyo, Sydney, São Paulo, Istanbul, Riyadh, Toronto, and more. Each session is shown as a color-coded band highlighting the most traded currency pairs in that region. The layout is clean, modern, and fully customizable — traders can choose which se
FREE

LIQUIDITY SWEEPS INDICATOR - MT5 Advanced Smart Money Concept Tool
OVERVIEW
The Liquidity Sweeps Indicator is a professional-grade MT5 tool designed to identify institutional liquidity grabs and stop-hunt patterns. Based on ICT (Inne
FREE

Volatility Break Signals Description:
The Volatility Break Signals is an indicator designed to detect potential trend changes while partially filtering market noise. It uses an adaptive volatility measure based on the selected price (Close, Open, High, Low, etc.) and generates Buy and Sell signals when the price shows a reversal relative to the previous direction. How it works: Price Volatility Measurement The indicator calculates the absolute price changes from bar to bar ( |price - previous
FREE
ZigZag Reversal Detector Signals This is a technical indicator based on the ZigZag principle, designed to automatically detect market reversal points and generate clear buy and sell signals. Customizable Parameters ️: Level : Determines the sensitivity of the ZigZag to price changes. Ecart : Sets the minimum distance between two ZigZag points. Rebond : Adjusts the confirmation threshold for a reversal. Alerts & Notifications : Enable or disable according to your needs. Pe
FREE

SMC LIQUIDITY Advanced Institutional-Grade Smart Money and Liquidity Analysis Suite for MT5 SMC LIQUIDITY is a comprehensive institutional toolkit engineered for traders who require precise liquidity mapping, market structure intelligence, smart money concepts, and order flow awareness in a single integrated interface. It is designed for professional workflow, multi-timeframe clarity, and seamless execution in fast-moving conditions. This indicator combines several institutional methodologies in

Trading Sessions by Mahefa R is an indicator for MetaTrader 5 that visually identifies the four main trading sessions: New York, London, Tokyo, and Sydney . Designed to provide a clean, intuitive, and professional market view, it highlights the most active periods of the Forex market using smart visualization of session ranges , session-specific candle colors , and daily separators . Main Features: Automatic detection of the 4 major sessions New York London Tokyo Sydney Each session is fully c
FREE
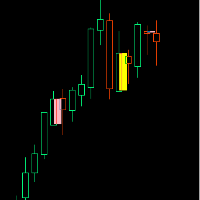
If you like this product, please give it a 5 star rating as a token of appreciation.
Inside Bar: A candle that is completely contained within the high-low range of the previous candle
Outside Bar: A candle that completely engulfs the high-low range of the previous candle (also called an "Engulfing Bar")
Inside Bars Consolidation Signals : Indicates market indecision/compression Breakout Setup : Often precedes significant price moves Continuation Patterns : Can signal pause in trend before con
FREE
If you like this product, please give it a 5 star rating as a token of appreciation.
This indicator identifies and displays Fair Value Gaps (FVG) on price charts.
Fair Value Gaps are price zones where there's a significant imbalance between buying and selling pressure, creating "gaps" in price action. The indicator detects two types and when they are mitigated(touched):
Bullish FVG: When a candle's low is above the high of a candle two periods earlier.
Bearish FVG: When a candle's high is bel
FREE

The indicator is stable on noise fluctuations in price and quickly reacts to the trend. It is based on an algorithm from a system of hyperbolic functions that allows you to aggressively smooth the flat with minimal lag on the trend. It can be applied directly to the price chart, to itself, or to other indicators in order to eliminate false signals. The main purpose of the indicator is to smooth out small sawtooth price movements as much as possible. The higher the Hyperbolic parameter, the stron

Metatrader 5 version of the known "Currency Slope Strength" MT4 indicator. This tool was designed to visually measure the strength of major global currencies in real time, allowing to identify trending currencies, reversals, and cross-currency opportunities. Currencies: AUD, CAD, CHF, EUR, GBP, JPY, NZD and USD.
Level Crossing alerts (Pop-up,Push,Email). Customizable timeframes (Main and Extra). Customizable colors. Non-repainting . The indicator runs in Strategy Tester, but it may take a while
The MetaTrader Market is a simple and convenient site where developers can sell their trading applications.
We will help you post your product and explain you how to prepare your product description for the Market. All applications on the Market are encryption-protected and can only be run on a buyer's computer. Illegal copying is impossible.
You are missing trading opportunities:
- Free trading apps
- Over 8,000 signals for copying
- Economic news for exploring financial markets
Registration
Log in
If you do not have an account, please register
Allow the use of cookies to log in to the MQL5.com website.
Please enable the necessary setting in your browser, otherwise you will not be able to log in.