Watch the Market tutorial videos on YouTube
How to buy а trading robot or an indicator
Run your EA on
virtual hosting
virtual hosting
Test аn indicator/trading robot before buying
Want to earn in the Market?
How to present a product for a sell-through
New Technical Indicators for MetaTrader 5 - 3

Questo indicatore avanzato disegna automaticamente pivot High/Low e trendline su un timeframe selezionato (es. H4, D1, ecc.) e li rende visibili su tutti i timeframe inferiori. L'obiettivo principale è fornire un contesto strutturale multi-timeframe unito a segnali di tocco sulle trendline. Caratteristiche principali: Trendline Automatiche : Disegnate tra i pivot High e Low rilevati sul timeframe selezionato.
Classificate in trendline rialziste (UpTrend), ribassiste (DownTrend) e rotte (B

Un indicatore avanzato che combina la regressione logaritmica dinamica con strumenti di analisi trend intelligente , visualizzazioni personalizzabili e filtri avanzati per confermare la direzione del mercato. Come utilizzare l’indicatore Logarithmic Regression Channel - Trend (Disegnato su timeframe superiori) Trend rialzista
(slope ≥ +3) Si può acquistare in due modi: Quando il prezzo rimbalza sulla banda inferiore del canale (trendline bassa). Quando il prezzo supera la linea centrale d

Let's follow the trend with the Goby trailing! According to your filters, you can use the arrows (Bullish [start] and Bearish [start]) as entry signals. After making an entry [position], you can use the Bullish [trailing] as a trailing stop for bullish positions and Bearish [trailing] as a trailing for bearish positions. Through the inputs, you can adjust the indicator for better performance in the assets you operate! Enjoy...
Boom and Crash Spike Detector spots high-probability trades on Boom 300 and Crash 300 indices. It shows clear buy/sell signals with green and blue arrows that never disappear. The tool automatically sets profit targets and stop losses for every trade. What it does: Finds the best moments to buy/sell on Boom 300 and Crash 300 markets Works on 1-minute charts for quick trading opportunities Shows clear signals (green for buy, blue for sell) that don't disappear Helpful features:
Automaticall

This powerful tool spots high-probability trades on major forex pairs (M1 timeframe). It shows clear buy/sell signals (green/blue arrows) and automatically sets profit targets & stop losses for stress-free trading. Key Features:
Clear non-repainting signals (green buy/blue sell arrows)
Auto TP/SL levels for every trade
Instant alerts (push, email, sound)
Works on 1-minute charts for fast opportunities
Covers all major forex pairs : XAUUSD, EURUSD, NZDUSD,

Catch boom spikes like a pro – before they happen! The KarooSpikes Boom Spike Catcher is a powerful MetaTrader 5 indicator designed for traders who want to consistently catch spikes on Boom with precision and confidence. What This Indicator Does: Detects high-probability spike zones using a combination of: RSI + Stochastic crossovers Price action 50 EMA trend filter Plots clear BUY arrows on your chart when spike conditions are met Sends instant mobile + sound alerts so you never miss a
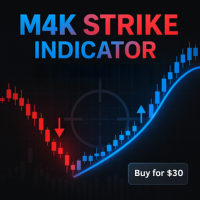
A simple indicator that changes color according to trend direction and marks each turn with an arrow and optional sound alert. Features Dual-Color Blue when the line is rising Red when the line is falling Arrow Signals Up-arrow at the start of an up-trend Down-arrow at the start of a down-trend Configurable Alerts Popup notification on each closed-bar trend change Optional custom WAV file (leave blank to use the MT5 default) Alerts fire once per closed bar to avoid repeats Native MQL5 Implem

Индикатор не перерисовывается так как использует сложную систему расчета. Индикатор послужит вам для принятия решений хеджированный сделок между коррелирующими инструментами, например между GBPUSD и EURUSD, на скриншоте показано где принять решения для открытия и закрытия сделок, верхний нижний канал для открытия сделок на покупку и продажу, и средняя линия для закрытия сделок, можете создать на основе индикатора стратегию с минимальным риском

ICT Order Blocks Premium Indicator Professional Market Structure Analysis Based on ICT Methodology OrderBlocks ICT is an advanced technical analysis tool that identifies high-probability trading zones based on the Inner Circle Trader (ICT) methodology. This professional-grade indicator detects key market turning points using institutional order block analysis, revealing where smart money is likely accumulating positions. Key Features: Smart Filtering Technology : Eliminates weak and insignific
VWAP Signal Indicator The VWAP Signal Indicator is an advanced technical analysis tool designed for traders who want to combine institutional-level price action with simple, actionable buy and sell signals. VWAP (Volume Weighted Average Price) is a widely-respected benchmark used by professional traders to identify the true average price of an asset, factoring in both price and traded volume. Key Features: Dynamic VWAP Curves:
Plots daily, weekly, and monthly VWAP lines directly on your chart,

TRADE ASSISTANT PRO – Your Ultimate Manual Trading Companion TRADE ASSISTANT PRO is a powerful all-in-one trading utility designed for manual traders who value precision, control, and efficiency. Whether you’re a scalper, day trader, or swing trader, this tool gives you everything you need at your fingertips to make faster, smarter trading decisions. Key Features: Multi-Timeframe & Multi-Symbol Display
Monitor multiple pairs and timeframes from a single chart. Get real-time info across

Introducing “OctoLevels” – Your Deep-Dive Price Navigator Explore the depths of the market with OctoLevels, the ultimate support and resistance indicator designed for precision and adaptability. OctoLevels uses 12 dynamic price levels to track key zones—support and resistance—that remain visible across months of historical data, giving traders a true long-range perspective. Unlike standard indicators, OctoLevels allows you to work with non-standard timeframes in MetaTrader 5—unlocking flex

This advanced indicator detects high-probability spike entries on PainX 400 & GainX 400 (M1 timeframe), featuring: Clear non-repainting signals (green buy/blue sell arrows)
Auto TP/SL placement for every trade
Instant alerts (push notifications, email & sound)
Real-time performance tracking
Multi-timeframe trend analysis Optimized For:
• PainX 400
• GainX 400

Professional Trading Tool for Volatility Markets This advanced indicator detects high-probability entries on Weltrade's synthetic indices (M1 timeframe), featuring: Clear non-repainting signals (green buy/red sell arrows)
Auto TP/SL placement for every trade
Instant alerts (push notifications, email & sound)
Real-time performance tracking
Multi-timeframe trend analysis Optimized For:
• Fx Vol 80 / Fx Vol 99
• FlipX 1 / FlipX 2

TrendPulse Engulf Pro – Ride the Wave of Precision Trading! TrendPulse Engulf Pro is a futuristic, precision-engineered trend-continuation indicator designed for traders who demand clarity, accuracy, and performance. Built on a 40-period moving average combined with advanced engulfing pattern detection, this tool highlights high-probability market entries that align with momentum and market structure. Whether you're a scalper, day trader, or swing trader, TrendPulse Engulf Pro gives you a clean,

Indicator Name: Auto Trend Line Description: Automatically draws trend lines with optimized and enhanced trend direction detection. Main Features: 1. Automatic Trend Line Drawing: Two main lines are plotted: Support Line – color: Magenta Resistance Line – color: Cyan Lines are calculated based on: Two extremums (highs/lows) or an extremum and a delta (custom offset) 2. Trend Direction Detection: The indicator determines the current trend as: TREND_UP (Uptrend value = 1) TREND_DOWN (Downtrend val

This is the test product. Please, DO NOT BUY IT! This is the test product. Please, DO NOT BUY IT! This is the test product. Please, DO NOT BUY IT! This is the test product. Please, DO NOT BUY IT! This is the test product. Please, DO NOT BUY IT! This is the test product. Please, DO NOT BUY IT! This is the test product. Please, DO NOT BUY IT! This is the test product. Please, DO NOT BUY IT!

Luxor – Precision & Performance for Serious Traders Luxor is an advanced trading indicator based on a powerful combination of two well-established algorithms: ALMA (Arnaud Legoux Moving Average) and PCH (Percentage Change) . It provides clear and reliable buy, sell, and exit signals , enhanced with dynamic RMS bands and real-time push notifications . Key Features: Accurate entry and exit signals – trade with confidence. Advanced ALMA smoothing – effectively reduces market noise. Dynamic PCH – d
FREE

Trade Path Indicator – Visual Framework for Algorithmic Price Action Trade Path is a professional-grade indicator designed to reveal the decision-making points of algorithmic trading strategies. It maps where algorithms are most active—entry zones, stop levels, and likely reversal points—giving manual traders a structured view of market dynamics.
Core Components Explained: Signal Line (Active Analysis) Shows the exact technical analysis level where the current algorithmic strategy generates it

designed for precision Kecia RSI Pro is engineered to transform your technical analysis capabilities by providing unprecedented insight into market momentum and trend dynamics. Unlike standard RSI indicators that limit you to a single analysis approach, this advanced suite delivers 9 specialized RSI methodologies within one powerful tool, giving you a comprehensive view of market conditions from multiple analytical perspectives. What sets this indicator apart is its ability to adapt to various m
SimSim Arrow MACD is a standard "Moving Averages Convergence/Divergence" indicator, but in an arrow version. Version for MetaTrader 4
The indicator parameters are similar to the standard ones, plus one additional parameter Delta . Delta = 0 - 100 Deviations as of the 100 value. Changing the level of the 100 indicator, Plus and minus are possible. The indicator generates arrow signals 1 or 2: The Main_line line crosses the zero level +- Delta The Signal_line line crosses the zero level +- D

The KT Gaussian Trend Filter combines Gaussian filtering with linear regression smoothing to deliver clear and accurate trend analysis. It generates easy-to-follow buy and sell signals while effectively highlighting the market's long-term direction.
Features
Fully Customizable Gaussian Filter: Adjust length and pole settings to fine-tune smoothing precision and enhance trend clarity. Linear Regression Enhancement: Further refines the Gaussian smoothing, minimizing false signals caused by market
The KT Trend Reversal Probability calculates the real-time probability of a trend reversal using a refined RSI-based algorithm. Displayed as a clear percentage, this probability helps you gauge when an ongoing trend is losing steam or when a new one is likely forming. Whether you’re planning your entries or tightening your exits, this indicator brings a data-backed edge to your trading decisions.
Features
Displays a clear probability percentage directly on the oscillator, helping traders antic
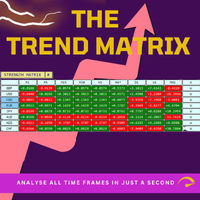
Trend Teller is a powerful, intuitive dashboard tool designed to give you a bird’s-eye view of the market trend across all major currency pairs and timeframes — from M1 to MN1. Built by traders for traders, this tool eliminates the guesswork from market trend analysis and helps you stay aligned with the bigger picture. Most beginner traders have a challenge to identify the direction of the market something which pro trader fails at times. Therefore this tool works best for beginners and any trad
Candle Time Remaining Indicator
This indicator displays the remaining time for the current candle to close in any timeframe.
Features: - Automatic MetaTrader language detection - On-screen countdown with real-time updates - Dynamic color change based on time left (green, orange, red) - Compatible with all instruments: indices, forex, crypto, etc. - Instant visualization without "Label" glitch
Perfect for scalpers and price action traders

[Ai] Autonomic computing is an intelligent computing approach that autonomously carries out robotic and interactive applications based on goal- and inference-driven mechanisms.
— 'IB ToolTip X' — это премиум-индикатор, разработанный как друг серьезного профессионального эксперта. Он мгновенно предоставляет экспертные знания по всем парам, включая многопарный анализ, все в одном передовом визуальном представлении 'wysiwyg'. От новичков до опытных трейдеров, любой может легко освоить его, и
SimSim Arrow 2MA is 2 standard MA indicators. The point of intersection of the arrows is a signal for a deal. Version for MetaTrader 4
The parameters of the indicators are similar to the standard MA indicators, one slow MA and the other fast MA.
A signal for a deal appears at the intersection point.
The indicators generate a signal when the fast MA line crosses the slow MA line.
Enable "CONTROL DEAL" for operation and trades based on the indicator signal will be opened automatically.. You an
SimSim Arrow KijunSen Plus MA is a proprietary arrow indicator. A version of the original indicator with KijuSen and MA lines. Version for MetaTrader 4 The indicator generates a signal when the Kijun-sen line crosses the MA line.
Enable "CONTROL DEAL" for operation and trades based on the indicator signal will be opened automatically. You an use the indicator for its intended purpose, as a reliable signaler. However, its secondary purpose is to serve as a signal provider for the " CONTROL DEAL
SimSim Arrow RSI is a standard "Relative Strength Index" indicator, but an arrow version. Version for MetaTrader 4
The parameters of the indicator are similar to the standard ones, plus one additional parameter Delta . Delta = 0 - 100 Deviations as of the Zero value. Changing the zero level of the indicator. The indicator generates a signal when the price crosses the level line = 50 +- Delta.
Enable "CONTROL DEAL" for operation and trades based on the indicator signal will be opened automatica
SimSim Arrow Stochastic is a standard "Stochastic Oscillator" indicator, but in an arrow version. Version for MetaTrader 4
The indicator parameters are similar to the standard ones, plus one additional parameter Delta . Delta = 0 - 100 Deviations as of the 100 value. Changing the level of the 100 indicator, Plus and minus are possible. The indicator generates a signal when the price crosses the level line = 50 +- Delta.
Enable "CONTROL DEAL" for operation and trades based on the indicator

SimSim Arrow BEAR is a standard "Bears Power" indicator, but an arrow version. Version for MetaTrader 4
The indicator parameters are similar to the standard ones, plus one additional parameter Delta . Delta = 0 - 100 Deviations as of the 100 value. Changing the level of the 100 indicator, Plus and minus are possible. The indicator generates a signal when the price crosses the zero line +- Delta.
TEnable "CONTROL DEAL" for operation and trades based on the indicator signal will be opened au
SimSim Arrow ADX is a standard "Average Directional Movement Index" indicator, but in an arrow version. Version for MetaTrader 4
The indicator parameters are similar to the standard ones.
Enable "CONTROL DEAL" for operation and trades based on the indicator signal will be opened automatically.
You an use the indicator for its intended purpose, as a reliable signaler. However, its secondary purpose is to serve as a signal provider for the " CONTROL DEAL " utility. The symbiosis between the in
SimSim Arrow Momentum is a standard "Momentum" indicator, but an arrow version. Version for MetaTrader 4
The indicator parameters are similar to the standard ones, plus one additional parameter Delta . Delta = 0 - 100 Deviations as of the 100 value. Changing the level of the 100 indicator, Plus and minus are possible. The indicator generates a signal when the price crosses the level line = 100 +- Delta.
Enable "CONTROL DEAL" for operation and trades based on the indicator signal will be opened

SimSim Arrow BULLS is a standard "Bulls Power" indicator, but in an arrow version. Version for MetaTrader 4
The indicator parameters are similar to the standard ones, plus one additional parameter Delta . Delta = 0 - 100 Deviations as of the 100 value. Changing the level of the 100 indicator, Plus and minus are possible. The indicator generates a signal when the price crosses the zero line +- Delta.
Enable "CONTROL DEAL" for operation and trades based on the indicator signal will be open
SimSim Arrow CCI is a standard "Commodity Channel Index" indicator, but an arrow version. Version for MetaTrader 4
The indicator parameters are similar to the standard ones, plus one additional parameter Delta . Delta = 0 - 100 Deviations as of the Zero value. Changing the zero level of the indicator. The indicator generates a signal when the price crosses the zero level line +- Delta.
Enable "CONTROL DEAL" for operation and trades based on the indicator signal will be opened automatically. Yo
SimSim Arrow Simple Signal is a proprietary arrow indicator. Version for MetaTrader 4
This is a very simple indicator, it has only one parameter, the period for calculating the indicator. Enable "CONTROL DEAL" for operation and trades based on the indicator signal will be opened automatically. You an use the indicator for its intended purpose, as a reliable signaler. However, its secondary purpose is to serve as a signal provider for the " CONTROL DEAL " utility. The symbiosis between the indi
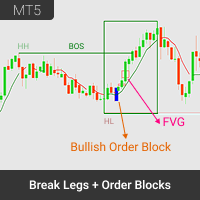
Overview Break Legs and Order Block Finder is a cutting-edge market structure indicator for MetaTrader 5, tailored for smart money traders, structure-based traders, and institutional-style strategies. It automatically highlights critical market events – from Break of Structure (BOS) and Market Structure Shift (MSS) to Fair Value Gaps (FVGs) and Order Blocks (OBs) – directly on your charts. Designed for professional and serious retail traders, this tool delivers clarity in real time, helping you
Ay Signal Trend Indicator Trend Signal Generation Indicator Non-repainting, real-time trend signals! Supports BTCUSD, XAUUSD, USDJPY, GBPJPY and other major FX/CFD pairs. The original “Ay Signal” algorithm minimizes false signals and unnecessary entries. Highly effective in high volatility markets (Bitcoin, Gold, Yen crosses, etc.)
Clear color-coded arrows and dots for intuitive signal recognition
Designed for M1 chart – ideal for scalping and day trading
Fast trades: average entry to exit compl

The Candle Number Indicator for MetaTrader 5 adds a clear, customizable number label to each candlestick on your chart, helping traders visually track bar progression for pattern recognition, breakout setups, or time-based strategies. Key features: Counts each candle from the most recent bar backward Customizable offset, color, and direction (horizontal or vertical text) Option to display only recent history (e.g., last N days) Lightweight and efficient for real-time use
FREE
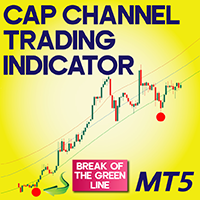
Download Cap Channel Trading Indicator for MetaTrader 5 The Cap Channel Trading Indicator leverages the Triangular Moving Average (TMA) to help traders identify ranging market conditions and potential trend reversals . This indicator comprises three lines: the middle line , which represents the TMA, and two additional lines positioned at a fixed distance above and below the TMA. «Indicator Installation & User Guide» MT5 Indicator Installation | Cap Channel Trading Indicator MT 4 | ALL Prod
FREE
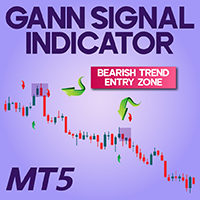
Gann Signal Indicator for MetaTrader 4 Download The Gann Signal Indicator is a robust tool for technical analysis, inspired by the Gann model and incorporating the Williams Percent Range. It helps traders pinpoint market trend reversals and provides precise entry points for trading opportunities. «Indicator Installation & User Guide» MT5 Indicator Installation | Gann Signal Indicator MT4 | ALL Products By TradingFinderLab | Best MT5 Indicator: Refined Order Block Indicator for MT 5 | Best
FREE
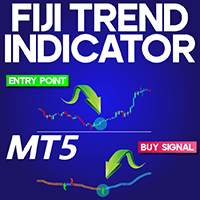
Fiji Trend Indicator in MetaTrader 5 The Fiji Trend Indicator in MetaTrader 5 is a reliable technical tool used for spotting directional movement and planning trade execution points. Designed specifically for the MT5 platform, this indicator leverages a blend of adaptive moving averages and directional arrows to produce a clean, streamlined chart that highlights trading signals with minimal market noise. When integrated with additional technical strategies, it helps traders find high-probability
FREE
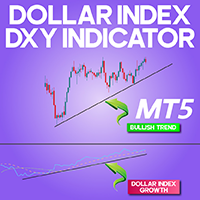
Dollar Index DXY indicator for MT5 The Dollar Index DXY indicator for MT5 is a powerful analytical instrument within the MetaTrader 5 platform, designed to evaluate the performance of the U.S. Dollar relative to a basket of major currencies. This indicator can function as a standalone measure or as a complementary tool within broader technical setups to enhance investment analysis. By observing correlations and divergences between the U.S. Dollar and other global currencies, traders are better e
FREE
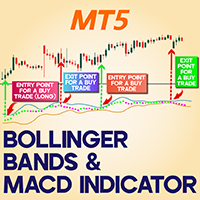
Download the Bollinger Bands MACD Indicator for MetaTrader 5 The Bollinger Bands MACD Indicator for MetaTrader 5 merges two widely-used technical analysis tools: the MACD oscillator and Bollinger Bands. This hybrid indicator enhances a trader’s ability to spot potential reversals and gauge the continuation of prevailing market trends. By merging volatility-based data from Bollinger Bands with momentum insights from MACD, this tool delivers clearer Buy and Sell signals during dynamic market phase
FREE

# ** Malaysian SnR Enhanced – Multi-Timeframe Support & Resistance Indicator **
Are you tired of guessing where the key support and resistance levels are on your chart?
Say hello to **Malaysian SnR Enhanced**, the ultimate **multi-timeframe Support & Resistance indicator** designed for serious traders who want a clear, top-down view of critical price levels across **W1, D1, H4, H1, M30, and M15 timeframes**.
## What is Malaysian SnR Enhanced?
**Malaysian SnR Enhanced** is a powerful,
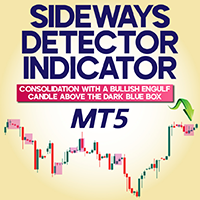
Sideways Detector indicator for MetaTrader 5 The Sideways Detector Indicator is a technical analysis tool in the MetaTrader 5 platform , designed to identify non-trending zones . This tool draws a navy blue box to display price equilibrium ranges and determine market conditions. This MetaTrader 5 indicator analyzes price movements using internal algorithms to determine whether the market is in a neutral phase or forming a new trend . «Indicator Installation & User Guide» MT5 Indicator Installati
FREE
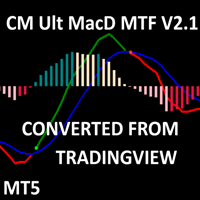
CM MACD Custom Indicator - Multiple Time Frame (V2.1) This advanced MT5 indicator, adapted from ChrisMoody’s TradingView script, delivers a powerful Multi-Timeframe MACD with customizable visuals and alerts. Plotting MACD lines, signal line, and a color-coded histogram, it highlights trend direction and momentum with distinct colors for growing/falling histograms above/below zero. Cross signals are marked with arrows, and users can enable alerts, email, or mobile notifications for buy/sell oppo
FREE
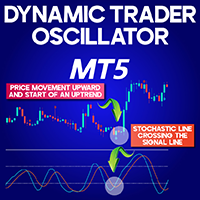
Dynamic Trader Oscillator (DTO) indicator for MetaTrader 5 The Dynamic Trader Oscillator (DTO) indicator for MetaTrader 5 is a sophisticated tool that integrates the RSI with the Stochastic Oscillator to enhance the precision of technical analysis. Built specifically for the MT5 platform, this hybrid indicator overlays the Stochastic calculation within the RSI pane, allowing traders to pinpoint overbought and oversold zones with greater reliability, which often signal upcoming price reversals.
A
FREE
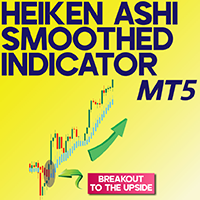
Heiken Ashi Smoothed Indicator for MT5
The "Heiken Ashi Smoothed" indicator is an advanced and updated version of Heiken Ashi candlesticks on the MetaTrader 5 platform . This indicator is specifically designed to analyze price trends and reduce chart noise .
The Heiken Ashi Smoothed indicator operates like a Moving Average (MA) , forming above or below the price. The trend's crossing with it indicates bullish or bearish market conditions. «Indicator Installation & User Guide» MT5 Indicator
FREE
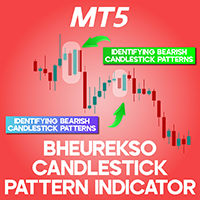
Bheurekso Candlestick Pattern Indicator for MetaTrader 5
The Bheurekso Pattern Indicator is suitable for traders to identify candlestick patterns on price charts. Developed for the MetaTrader 5 (MT5) platform, this indicator identifies candlestick reversal patterns and plots them on the chart, enabling traders to recognize them effectively. Additionally, it displays pattern labels and sends alerts to inform traders of their formation, allowing for more precise trading decisions.
«Indicator Inst
FREE
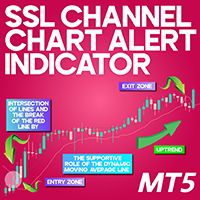
SSL Channel Chart Alert Indicator for MetaTrader 5 Introduction The SSL Channel Chart Alert Indicator is a powerful tool that leverages Moving Averages (MA) to determine buy and sell zones based on price trends. This MetaTrader 5 indicator consists of two Moving Average lines , calculated based on price highs and lows , offering traders a structured approach to identifying market direction. «Indicator Installation & User Guide» MT5 Indicator Installation | SSL Channel Chart Alert Indicator fo
FREE

The ViewTrend indicator provides a visual interpretation of market conditions by coloring the candles and the moving average line based on defined technical criteria. How does it work? The algorithm analyzes the relationship between the current closing price, the previous closing price, and the behavior of a simple moving average (SMA). Based on this analysis, the indicator colors the candles and the moving average line according to the technical scenario observed: Blue — Suggestion: Consider Bu
FREE
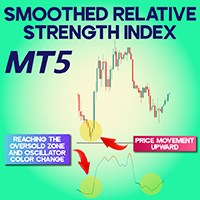
Smoothed Relative Strength Index (RSI) indicator for MetaTrader 5 The Smoothed Relative Strength Index (RSI) indicator for MetaTrader 5 is a refined oscillator designed to help traders detect potential reversal zones based on smoothed RSI data. This indicator modifies traditional RSI behavior by implementing a smoothing mechanism, which filters out erratic market noise. When the price enters a high-risk (overbought) zone, the line turns orange; in the low-risk (oversold) zone, it shifts to green
FREE

WickSniper Pro – Precision Reversal Indicator for Smart Traders ===============================================================
WickSniper Pro is a powerful **non-repainting** price action indicator that detects **inside bar breakout reversals** with sniper-like accuracy. Whether you're a scalper, swing trader, or day trader, WickSniper Pro helps you catch high-probability turning points in the market using clean, intuitive signals.
Key Features ------------ - Non-Repainting – Once a signa
FREE
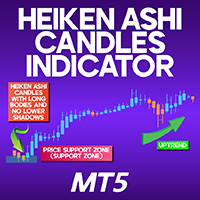
Heiken Ashi Candles Indicator for MetaTrader 5 The Heiken Ashi Candles Indicator is a highly effective tool offered on the MetaTrader 5 (MT5) platform, specifically designed to streamline the process of identifying market trends and potential reversals . By employing specialized formulas to calculate price data, this indicator removes unnecessary noise , providing traders with a clearer view of market trends. «Indicator Installation & User Guide» MT5 Indicator Installation | Heiken Ashi Candle
FREE

Complete Stochastic Indicator for MT5 The Stochastic Indicator is a commonly used momentum-based tool in MetaTrader 5, designed to help traders analyze market trends and detect potential price reversals along with overbought (Buy) or oversold (Sell) situations. This version, known as the Complete Stochastic Indicator for MT5 , enhances the basic stochastic model by including three dynamic lines: %K, %D, and Slow K, all oscillating between 0 and 100. «Indicator Installation & User Guide» MT5 Indi
FREE
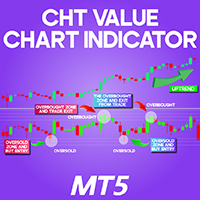
CHT Value Chart Indicator for MetaTrader 5
«Indicator Installation & User Guide» MT5 Indicator Installation | CHT Value Chart Indicator MT4 | ALL Products By TradingFinderLab | Best MT5 Indicator: Refined Order Block Indicator for MT 5 | Best MT5 Utility: Trade Assistant Expert TF MT5 | TP & SL Tool: Risk Reward Ratio Calculator RRR MT5 | Money Management: Easy Trade Manager MT5 | Trade Copier: Free Fast Local Trade Copier MT5 Introduction The CHT Value Chart Indicator is a s
FREE
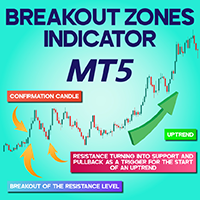
Breakout Zones indicator in MetaTrader 5 The Breakout Zones Indicator in MetaTrader 5 automatically draws support levels and resistance levels based on price movements on the chart. When the price crosses the resistance line, it indicates the start of an uptrend , and when it drops below the support line, it signals the formation of a downtrend . This indicator effectively helps identify bullish and bearish market trends. «Indicator Installation & User Guide» MT5 Indicator Installation | B
FREE

TradeJournal Plus: Auto Session Reports & Built-in PnL Indicator The ultimate automated trading diary for serious traders. Effortlessly log every session, export detailed reports in one click, and always know your real-time profits with the built-in PnL display. Take your trading journal to the next level optimize, review, and improve every trade. Key Benefits
Automated Trade Journal: Forget manual spreadsheets—TradeJournal Plus captures every detail of your trading sessions automatically, from

Indicator offers flexible fractal configuration, including the number of candles to the left and right, and the ability to filter based on sorted high/low values.
Key Features • Detects upward or downward fractals • Configurable number of candles on both sides • Optional sorting checks for high/low values • Arrow drawing on the chart
Parameters
1. Main (B) • Fractal Type (InpFractalType): Up / Down • Arrow Code (InpArrowCode): Unicode symbol for arrow • Arrow Color (InpArrowColor): Color for
FREE

Why Technical Indicators Don't Work?
Many traders lose money because of lagging indicator crossovers and fake breakouts. Indicators are rearview mirrors. They're all just pretty math equations of PAST data. Would you drive forward while staring at your rearview mirror? Absolutely NO. The "Holy Grail" indicator doesn't exist. Price Action Decoding: How Smart Money REALLY Trades?
The market don't care about your indicators, analyze price action instead, e.g. the principles of ICT, SMC, and other
MFI Multi-Scanner Indicator for MT5
The MFI Multi-Scanner Indicator is designed for automatic scanning of multiple currency pairs and timeframes to detect overbought and oversold signals using the Money Flow Index (MFI). It displays MFI values, signal arrows, and an interactive on-chart table. Ideal for traders who want to see the full market picture without constantly switching between windows. Performance Recommendations
For maximum speed and fast testing, it is recommended to: Run the i
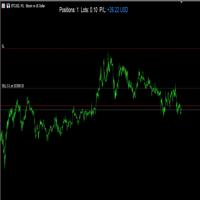
Live P/L Display – Real-time Position Summary
This indicator displays a clean and customizable summary of your current trading position directly on the chart. It shows: Number of open positions Total lot size Real-time profit/loss in USD
The profit/loss section is color-coded: Blue when in profit Red when in loss
Users can freely adjust: Font size X and Y position on the screen Text color for labels Display on/off toggles for each section
Perfect for scalpers and intraday traders w

Pivot Points Classic – L’indicatore essenziale per ogni trader tecnico Questo indicatore disegna automaticamente i livelli di Pivot Point più utilizzati dai trader professionisti, con supporto completo a 4 metodi di calcolo: Metodi supportati :
• Traditional
• Fibonacci
• Woodie
• Camarilla Caratteristiche principali :
️ Calcolo su timeframe superiore (multi-timeframe)
️ Visualizzazione chiara dei livelli P, R1, R2, R3, S1, S2, S3
️ Etichette dinamiche con nome e valore del livello
️ C
FREE
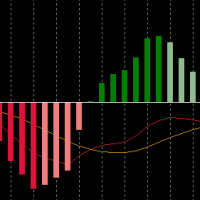
A beutiful, multi colored MACD indicator. It offers the possibility to change the colors of the "main line" and the "signal line" and uses four different colors for the "histogram"
It also returns the buffer-values from the "main line", "signal line", "histogram" and "color" to acess it from an EA
If you need some changes, or additional buffers -> send me a message
FREE

Il WaveForce Indicator è un innovativo oscillatore sviluppato per rilevare con precisione la forza dominante del mercato — bullish o bearish — e fornire segnali fluidi e affidabili per il trading direzionale. Basato su un sistema di doppia envelope esponenziale e smussamento dinamico, WaveForce separa matematicamente l'energia rialzista e ribassista, tracciando due curve (Bull e Bear) e una linea di segnale centrale. Questo consente al trader di percepire con chiarezza quale delle due forze stia
FREE
Take your Boom trading to the next level with the DC Dynamic Scalping Indicator for Boom , engineered specifically for precision scalping and small account growth. This powerful, non-repainting indicator is designed to catch short-term selling opportunities on Boom indices, backed by our proprietary Dynamic Trend Filter that ensures you always trade in the direction of the prevailing trend. With a built-in blue background template , your charts are clean, focused, and ready for action. Key Fe

Kecia MA Pro is engineered to transform your technical analysis capabilities by providing insight into market trends and price dynamics. Unlike standard moving average indicators that limit you to a single analysis approach, this advanced suite delivers 15 specialized MA methodologies within one powerful tool, giving you a comprehensive view of market conditions from multiple analytical perspectives. What sets this indicator apart is its ability to adapt to various market conditions through its

Kecia Ichimoku Pro is engineered to transform your technical analysis capabilities by providing deep insight into market dynamics through an enhanced implementation of the Ichimoku Cloud system. Unlike standard Ichimoku indicators that limit you to a single presentation style, this advanced suite delivers 10 specialized visualization methodologies within one powerful tool, giving you a comprehensive view of market conditions from multiple analytical perspectives. What sets this indicator apart i

Indicator Name: Fibaction – price action candle Detector Description:
Fibo Signal Boxes is a powerful Smart Money Concept (SMC)-inspired indicator that auto-detects price action candles. bullish hammers and shooting stars, then draws precise Fibonacci entry zones and multiple take-profit levels directly on the chart. as for the SL personally i use 40 pips rules Key Features: Detects bullish hammer and shooting star reversal candles. Automatically draws Fibonacci entry and TP boxes. as
The MetaTrader Market is the only store where you can download a free demo trading robot for testing and optimization using historical data.
Read the application overview and reviews from other customers, download it right to your terminal and test a trading robot before you buy. Only on the MetaTrader Market you can test an application absolutely free of charge.
You are missing trading opportunities:
- Free trading apps
- Over 8,000 signals for copying
- Economic news for exploring financial markets
Registration
Log in
If you do not have an account, please register
Allow the use of cookies to log in to the MQL5.com website.
Please enable the necessary setting in your browser, otherwise you will not be able to log in.