Watch the Market tutorial videos on YouTube
How to buy а trading robot or an indicator
Run your EA on
virtual hosting
virtual hosting
Test аn indicator/trading robot before buying
Want to earn in the Market?
How to present a product for a sell-through
New Technical Indicators for MetaTrader 5 - 4

DTFX Algo Zones are auto-generated Fibonacci Retracements based on market structure shifts.
These retracement levels are intended to be used as support and resistance levels to look for price to bounce off of to confirm direction.
USAGE Figure 1 Due to the retracement levels only being generated from identified market structure shifts, the retracements are confined to only draw from areas considered more important due to the technical Break of Structure (BOS) or Change of Character
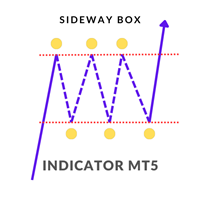
Sideway Box Indicator The Sideway Box Indicator is an advanced trading tool designed to help traders identify and capitalize on sideways market conditions. This powerful indicator detects periods when the market is in a sideways (ranging) phase, providing traders with clear visual cues. Key Features: Sideways Market Detection : The Sideway Box Indicator accurately identifies sideways market conditions, allowing traders to recognize when the price is consolidating within a specific range. Buy/Sel
You can use the indicator in trend following to detect trend changes. Each color change is a trading signal. It should be used on at least 1 hour charts. It is recommended to use it on 1-day charts. However, it should be noted that the number of meaningful candles (without gap) on your chart should be at least 80.
The calculation method is based on ATR, MA and CCI indicators. However, for a significant part of the calculation I have developed my own algorithm based on standard deviation and r
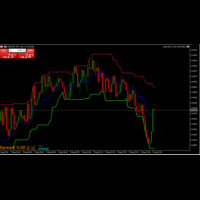
The Donchian Channel Indicator I created is a powerful tool for analyzing price trends and volatility. By plotting the highest high and lowest low over a specified period, it helps identify potential breakout opportunities and trend reversals. This indicator is valuable for traders seeking to understand market dynamics and make informed decisions based on price movements. Its simplicity and effectiveness make it an essential addition to any trading strategy.
FREE

Fractals Aydmaxx 2024 Overview: Fractals Aydmaxx 2024 is a custom indicator designed for the MQL5 trading platform, developed by Aydmaxx. This indicator identifies and displays fractal patterns on your trading chart, which are essential for recognizing potential market reversals. The indicator highlights both bull and bear fractals, making it easier for traders to spot key levels of support and resistance. Features: Customizable Fractals: Allows the user to set the number of bars on the left and
FREE
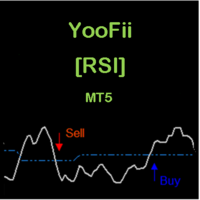
CONSTITUTION YooFii [RSI] is an indicator consisting of an oscillator and a dynamic level. The oscillator, dynamic level and warning signals can be adjusted via the inputs. It is designed for the MT5 platform only. APPLICATION This indicator should be used with a trend filter [e.g. two moving averages, MA 200 and MA 55] [see screen shots for more details]. when the oscillator crosses the dynamic level from bottom to top, we have a BULLISH move. when the oscillator crosses the dynamic level from
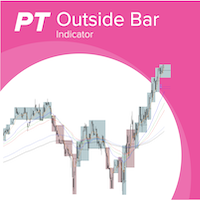
Outside bars (Außenstäbe) are important in professional price action trading and were made popular by Michael Voigt. Highs and lows of outside bars ( Aussenstäbe ) can be utilized as entry and exit for trades following different strategies. With combining different timeframes you can more easily detect the overall trend of the market, see potential resistance and support levels and also detect change in trend and framing of the market. Examples for strategies with inside bars (Innenstäbe) an

Introducing the BOOM CRASH MASTER Indicator: Unleash the Power of Precision Trading! Step into the world of unparalleled trading with the BOOM CRASH Master Indicator, exclusively designed for the Boom and Crash indices offered by Deriv broker. This cutting-edge tool is your gateway to mastering the art of spike detection and anti-spike entries, ensuring you stay ahead of the market’s every move. Key Features: Precision Spike Detection: Harness the power of advanced algorithms to catch spikes wi

This indicator/dashboard , is place on a single symbol. It shows the percentage of movement withing all time frames from M1 to W1.The text will change green if all % are in the positive for a buy signal.The text will change red if all % are below zero and in negative for a sell signal. There are audible notifications, as well as on screen notifications along with push notifications that can be turned on and ON/OFF in the settings.
This is a sure way to Find trends quickly and efficiently, with

Average Session Range: Calculate and Average the Sessions High-Low Range of Specific Time Sessions Over Multiple Days. The Session Average Range is a sophisticated and precise tool designed to calculate the volatility of specific time sessions within the trading day. By meticulously analyzing the range between the high and low prices of a defined trading session over multiple days, this tool provides traders with a clear and actionable average range. **Note:** When the trading platform is closed
FREE
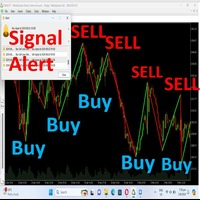
Hello Traders, *-For your bonus one indicator with SL,TP zone* just give your review, comment.Once finish developing I will give you**** Trend identification Indicator This is a indicator that will identify trend zone as bearish and bullish zone . This indicator can use for all pairs and any timeframe you can use it . *Green lime mean buy.Red line mean sell.You will receive alert sound when signal generate. The create best on high, low point and moving average calculation. You can customize valu
The VSA Scanner Dashboard is a multi-symbol, multi-timeframe scanner that displays VSA signals. It is based on the Volume Plus and VSA Signals indicator. Features Displays the VSA signal of the last closed candle. Monitors 28 customizable instruments (symbols) and up to 21 timeframes at the same time. Easily arrange symbols in any order. Each signal has a tooltip that displays the name and time of appearance. Click on each signal to open a new chart. All types of alerts (sound, pop-up, email,

This MQL5 Speed Indicator script calculates the average speed of price movements for a selected financial instrument over a specified period. It uses the arithmetic mean to determine the average speed, which is computed by dividing the distance (change in price) by the time interval. The indicator then displays this value as a histogram in a separate window. Average Speed Calculation : The speed is calculated using the formula v = d t v = \frac{d}{t} v = t d , where d d d is the price differen
The "Order Block Indicator for MetaTrader 5" is an advanced trading tool designed to help traders identify key order block zones in the financial markets. Order blocks are areas of institutional buying and selling, often marking significant price levels where market reversals or continuations are likely to occur. This indicator provides a visual representation of these zones directly on the chart, enabling traders to make more informed trading decisions. Key Features: Accurate Order Block Identi
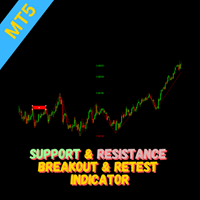
Overview The Breakout and Retest indicator is designed to identify potential trading opportunities by detecting price breakouts from significant support and resistance levels followed by a retest of the broken level. How it Works The indicator analyzes price data to determine key support and resistance areas. When the price decisively breaks through one of these levels and then retest it, then a potential breakout is signaled when it breakout again. To increase the probability of a successful t

Price and Spread Indicator
Version: 1.0 Developer: Creative Tech Solutions Website: https://www.creativetechsolutions.co.uk
Overview The Price and Spread Indicator is a great tool for MetaTrader 5 that displays the Ask and Bid prices along with the spread directly on the chart. This indicator provides real-time updates and allows traders to make informed decisions based on accurate price information.
Features - Real-time Price Updates: Continuously updates Ask and Bid prices. - Spread D
FREE
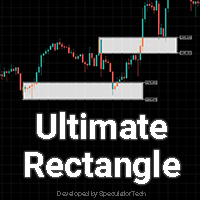
ST Ultimate Rectangle MT5
Introducing our latest MT5 indicator: the upgraded Rectangle Object Indicator. This powerful tool boasts an enhanced rectangular object, allowing for simultaneous color fill and outlining. Plus, it offers the flexibility to display prices conveniently at both the top and bottom of the rectangle. Streamline your trading analysis with this versatile indicator, designed to provide clarity and precision in every trade.
We value your input in further refining our indic
FREE
MT5用 サブウィンドウにスプレッドとBUY SWAP(BS)とSELL SWAP(SS)を表示するインジケーターです。
表示の文字フォントの大きさと色の設定、スプレッドの表示をPIPS表示もしくはPOINTS表示切替が可能ですので、チャートの色設定などに合わせて、お好みでご利用いただけます。 サブウィンドウの表示サイズに合わせて、その中央に表示するようになっています。
(ご協力お願いします!) こちらは無料でご利用いただけます。どうぞご自由にご利用ください。 もしよければ MS High Low indicator も紹介していますので、どうぞご参照の上、DEMO版のダウンロードをお試しください!
Happy Trading :)
FREE

Quantum Prime Indicator Take Note 1.This indicator works with additional license to prevent third party software from access. Kindly message me after purchase to receive license 2.You will get the quantum prime indicator for free after purchasing the Quantum prime EA.
The Quantum Prime Indicator is a cutting-edge trading tool designed to revolutionize your trading experience by integrating the powerful concepts behind the renowned Quantum Prime EA. This advanced indicator leverages sophistic
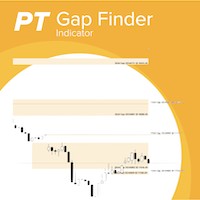
With the gaps finder indicator gaps between trading session are automatically added to you chart and you will never miss a gap which you can use in your trading strategies. Gaps often act as a magnet where the markets returns to or when a gap is closed often constitutes a reversal point.You don't have to draw manually gaps anymore. Key Features: Support for multiple trading sessions in a single chart, e.g market session and future session Configurable number of days to look back for gaps Highly

WHY IS OUR FXACCCURATE TCT MT5 THE PROFITABLE ? Gives entry, stop and target levels from time to time. It finds Trading opportunities by analyzing what the price is doing during established trends. We have made these indicators with a lot of years of hard work. It is made at a very advanced level.
Established trends provide dozens of trading opportunities, but most trend indicators completely ignore them! The trend reveals trading indicator represents an average of 10 different trades per trend

ATbot : How It Works and How to Use It How It Works The "AtBot" indicator for the MT5 platform generates buy and sell signals using a combination of technical analysis tools. It integrates Simple Moving Average (SMA), Exponential Moving Average (EMA), and the Average True Range (ATR) index to identify trading opportunities. Additionally, it can utilize Heikin Ashi candles to enhance signal accuracy. MQL Channel Leave a massage after purchase and receive a special bonus gift. 9 copies left for

Golden Spikes Detector Acknowledgement and Dedications: The name of this indicator was Inspired by an Original; Mr Grant Koopman; a Knowledgeable and experienced Synthetics trader. I dedicate this indicator to Mr Grant.
Overview: The Golden Spikes Premium is a groundbreaking trading indicator meticulously crafted for the Boom and Crash indices on the Deriv market. Tailored to meet the needs of discerning traders, this powerful tool operates exclusively on the one-minute timeframe, providin
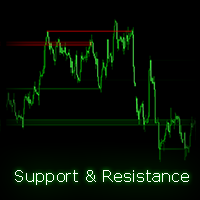
Automatically find and plot S/R channels on your chart, making it easy to identify key levels. The indicator supports multiple timeframes, allowing you to display channels from different timeframes on your current chart. Additionally, it offers transparent colors for enhanced visual clarity and lets you customize the channel colors to suit your preferences. How does this indicator work? The indicator finds swing points (highs and lows) within a range defined by the "Bars lookback" parameter. Sw
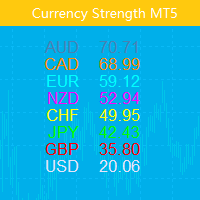
This indicator shows the relative strength of 8 major currencies: USD, EUR, GBP, AUD, NZD, CAD, CHF and JPY. The strength value is normalized to the range 0-100: The value above 60 means strong. The value below 40 means weak. The basic principle Given eight currencies, USD,EUR,GBP,AUD,NZD,CAD,CHF,JPY, where each pair of two can be combined, resulting in a total of 28 pairs, a reverse algorithm is used to extract the strength of the eight currencies from these 28 pairs EURUSD,GBPUSD,AUDUSD,NZDUS

Financial Indicator SolarTrade Suite: Uranus Market Indicator - Your Reliable Guide in the World of Financial Markets!
These are two moving averages that use special innovative and advanced algorithms to calculate their value, and also have a pleasing design.
It is very easy to understand the readings of this indicator: blue color - buy, red - sell.
The brighter the color, the stronger the signal.
Check out our other products from the SolarTrade Suite series at the bottom of the descrip

Financial Indicator SolarTrade Suite: Neptune Market Indicator - Your Reliable Guide in the World of Financial Markets!
These are six moving averages that use special innovative and advanced algorithms to calculate their value, and also have a pleasing design.
It is very easy to understand the readings of this indicator: blue color - buy, red - sell.
The brighter the color, the stronger the signal.
Check out our other products from the SolarTrade Suite series at the bottom of the descri

SolarTrade Suite Financial Indicator: Venus Market Indicator - Your Reliable Guide in the World of Financial Markets!
This is an oscillator that uses special innovative and advanced algorithms to calculate its value, and also has an eye-pleasing design.
It is very easy to understand the readings of this indicator: blue color - buy, red - sell.
The brighter the color, the stronger the signal.
Check out our other products from the SolarTrade Suite series at the bottom of the description.

Financial Indicator SolarTrade Suite: Mars Market Indicator - Your Reliable Guide in the World of Financial Markets!
This is an oscillator that uses special innovative and advanced algorithms to calculate its value, and also has a pleasing design.
It is very easy to understand the readings of this indicator: blue color - buy, red - sell.
The brighter the color, the stronger the signal.
Check out our other products from the SolarTrade Suite series at the bottom of the description.
Do y

SolarTrade Suite Financial Indicator: Jupiter Market Indicator - Your Reliable Guide in the World of Financial Markets!
This is a trend indicator that uses special innovative and advanced algorithms to calculate its value, and also has an eye-pleasing design.
It is very easy to understand the readings of this indicator: blue color - buy, red - sell.
Check out our other products from the SolarTrade Suite series at the bottom of the description.
Do you want to confidently navigate the wor

SolarTrade Suite Financial Indicator: Saturn Market Indicator - Your Reliable Guide in the World of Financial Markets!
This is a price channel indicator that uses special innovative and advanced algorithms to calculate its value, and also has a pleasing design.
Understanding the readings of this indicator is very simple: trade from the boundaries both on a breakout and on a rebound.
Check out our other products from the SolarTrade Suite series at the bottom of the description.
Want to c

VolaMetrics VSA | A Powerful Ally in Technical Analysis The VolaMetrics VSA is a technical analysis indicator that combines the Volume Spread Analysis (VSA) methodology with detailed analysis of trading volume . Designed to identify and track significant price movements , VolaMetrics VSA uses the interaction between volume and price spread to provide valuable insights that can aid in trading decisions. Fundamentals of Volume Spread Analysis (VSA) Volume Spread Analysis (VSA) is a respected

Currency Strength Chart for MetaTrader 5
For a free download, join our group . Limited time offer! Overview: Identify the strongest currencies at a glance with the Currency Strength Chart for MetaTrader 5. This powerful indicator provides a clear, visual representation of the relative strength of major currencies over the last 30 days, allowing you to make more informed trading decisions. Key Features: 30-Day Comparative Analysis: Compare the strength of each major currency over a 30-day perio

For a free download, join our group . Limited time offer!
Introducing our innovative MQL5 Indicator, designed to enhance your trading experience by providing clear visual cues of daily candle boundaries on lower timeframes. This tool is perfect for traders who want to stay informed about the daily candle's progress, ensuring better decision-making and strategy execution. Key Features Daily Candle Box Visualization: Draws a distinct box from the start of the daily candle to the end of the dai

Candle Time CountDown By BokaroTraderFx The Candle Timer Countdown Indicator is a versatile tool designed for the MetaTrader 5 (MT5) trading platform. It provides traders with a visual countdown of the remaining time for the current candle on a chart. The key features include:
Customizable Position: Place the countdown timer in any corner of the chart for optimal visibility. Default Text Color: Set to red for clear visibility, with options for further customization. Minimal Display: Shows onl
FREE
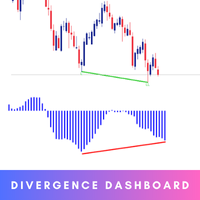
The Smart Divergence Dashboard is your ultimate tool for identifying high-probability trading opportunities. This cutting-edge indicator is meticulously designed to detect Regular Divergences, offering traders a clear and actionable advantage. MT4 Version - https://www.mql5.com/en/market/product/120702/ Key Features: Real-time Divergence Detection: Instantly pinpoints Higher High/Lower Low and Oscillator Higher Low divergences across multiple currency pairs and timeframes using Awesome Os

Balanced Work Indicator: Your Gateway to Trend Trading Balanced Work is a trend-following indicator designed to simplify market analysis and trading decisions. This algorithmic tool draws two-colored dots along the price chart, connected by lines, offering a clear visual representation of market trends. The simplicity of this indicator lies in its color-coded signals: buy when a blue dot appears and sell when a red dot appears. It is particularly effective for scalping and pipsing, and it has p
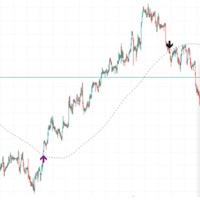
If the price is cutting above the slow length moving average, a breakout may occur. If the price is cutting below, a pullback may occur in the market. This was known for a long time, but there aren't many indicators which signal on the event. Candlestick pattern validation is also used in this indicator so that signals will not be drawn on doji candles or small "uncertainty" candles. The length of the moving average period can be defined by the user (default is 200). The number of price movement
FREE
Amazing RSI + ATR Dashboard Indicators are useful for traders, but when you put them into a dashboard and can scan 28 symbols at once they become even better, and when you can also combine different indicators and timeframes to give you synchronized alerts they become awesome. When this product gets 20 reviews I will add another indcator free to this dashboard as a thank you. This easy to use dashboard provides you with the RSI and ATR indicators, use them individually or together to create p
FREE

FVG Fair Value Gap is an indicator that plot rectangle for last found fair value gap. There will be a total of eight fair value gaps. Four is bullish fair value gaps and another four is bearish fair value gaps. Bullish Fair Value Gaps Top Bullish/Bearish Fair Value Gap is the gap that will obey the "Recent candles" and "Nearby Size In Pips" parameters. This fair value gap will be above current price. Bottom Bullish/Bearish Fair Value Gap is the gap that will obey the "Recent candles" and "Nearb
FREE

Dynamic Range and Target Indicator: Your Reliable Trading Partner
Introducing an innovative indicator that revolutionizes how you analyze markets and make trading decisions. Whether you're a beginner seeking clear guidance or an experienced trader looking to enhance your strategy, this tool is designed to meet your needs.
Key Features:
1. Dynamic Range Determination: The indicator continuously analyzes the market, identifying the most recent significant price ranges.
2. Clear Suppor
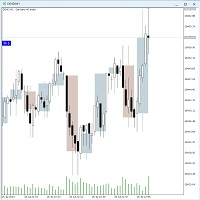
The Twotimeframe-Candles (RFrame) - Indicator for MT5 shows the candles of an higher, timeframe as an overlay on the current timeframe. You can choose the number of candles and color of the overlays. The indicator calculates the candle evevery tick. If you like the indicator, please left a comment.
Keywords:
Candlestick, Multitimefram, Two Timeframes,
FREE
Optimized for Asia- London- US- Open-Session true Momentum - time-based Indicator
Filter
Daytime Weekdays Moving Averages Keltner-Channel
Advantages Optimized for Asia- London- US- Open-Session choose your personal times to trade - select Daytime and Weekdays Keltner-Channel => to reduce market noise - sideways movement will be hidden 3x Moving Averages => for the Trend Signal after close - no repaint
Alerts
Email Screen-Alert Push-Notification

The ICT Immediate Rebalance Toolkit is a comprehensive suite of tools crafted to aid traders in pinpointing crucial trading zones and patterns within the market.
The ICT Immediate Rebalance, although frequently overlooked, emerges as one of ICT's most influential concepts, particularly when considered within a specific context. The toolkit integrates commonly used price action tools to be utilized in conjunction with the Immediate Rebalance patterns, enriching the capacity to discern con
A simple indicator for plotting a tick chart.
This indicator will allow you to track the spread dynamics and the price behavior in general.
In the settings, you can select the price to display on the chart - Bid, Ask or both prices at the same time.
Tick Chart Indicator will definitely be useful when using scalping strategies. The MT4 version is available here . Good luck to everyone and successful trading!
CLICK HERE FOR FREE DOWNLOAD This trading indicator Automatically identifies and plots contract blocks, which are essential zones marked by significant levels of support and resistance. This powerful tool provides traders with a clear and intuitive visualization of critical market points where prices are likely to bounce or reverse. The contract blocks, represented by distinct colored rectangles, highlight support zones (at the bottom) and resistance zones (at the top), enabling traders not onl

The trendlines with breaks indicator return pivot point based trendlines with highlighted breakouts. Users can control the steepness of the trendlines as well as their slope calculation method.
Trendline breakouts occur in real-time and are not subject to backpainting. Trendlines can however be subject to repainting unless turned off from the user settings.
The indicator includes integrated alerts for trendline breakouts. Any valid trendlines methodology can be used with the indicator, u
FREE

** All Symbols x All Timeframes scan just by pressing scanner button ** *** Contact me to send you instruction and add you in "Head & Shoulders Scanner group" for sharing or seeing experiences with other users. Introduction: Head and Shoulders Pattern is a very repetitive common type of price reversal patterns. The pattern appears on all time frames and can be used by all types of traders and investors. The Head and Shoulders Scanner indicator Scans All charts just by pressing
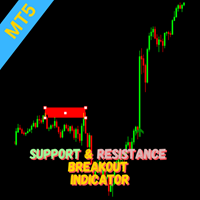
Indicator Overview This indicator utilizes the Zigzag indicator to identify potential support and resistance levels. When the price action breaks through one of these levels, a trading signal is generated. How it Works The Zigzag indicator is employed to pinpoint significant price highs and lows, forming potential support and resistance areas. A signal is triggered when the current candle closes beyond a previously established support or resistance level. Traders can consider entering a position
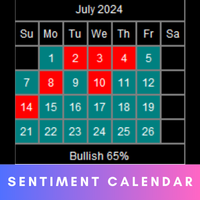
The Market Sentiment calendar provides a visual representation of market sentiment for each day or month. It will display daily and monthly BIAS . The calendar also highlights the percentage of bullish days or months within a given month or year. MT4 version - https://www.mql5.com/en/market/product/120767/ Inputs Frequency: Choose between "Daily" and "Monthly" calendar views. Sentiment Method: Select the method to determine daily or monthly sentiment: " L inear Regression ", " Accumu
Introducing the Gold Market Arrow Indicator, specifically designed for the 15-minute chart. This advanced tool provides clear and actionable buy and sell arrows, enabling traders to make timely and informed decisions in the gold market. Whether you're a seasoned trader or a novice, our indicator simplifies complex market data into straightforward signals, ensuring you never miss an opportunity to capitalize on gold price movements." This indicator works with a custom build in strategy The indic

FusionBlocks: Decode Market Structure Unlock the full potential of your trading with FusionBlocks, the ultimate MT5 indicator for smart money concepts (SMC) traders. Designed to provide a comprehensive understanding of market structure, FusionBlocks is an indispensable tool for traders looking to enhance their strategy and performance. Key Features Order Block Detection : Automatically identifies and draws order blocks on the chart, helping you pinpoint key areas of interest. Break of Structure

The indicator places a buy or sell signal when the conditions of the strategy it was designed with are met. The strategy is guaranteed, strong, and has been tested for 9 years. The indicator is for binary options and can be converted into a bot by linking it to MT2Trading, where it sends the signal to this platform. This platform automatically opens a trade on the trading platform you are using, whether it is Pocket Option, IQ Option, or any other binary options platforms. The entry is on the ne

Description of the Indicator Trend Stop shows the highest/lowest value of the last N periods. Can help traders identify the trend direction and potential stop levels. Use Trend Stop indicator to detects the trend direction.
Downtrend if the price crosses the Trend Stop line upwards Uptrend if the price crosses the Trend Stop line downwards
Use Trend Stop indicator to define optimal stop levels. Downtrend Place your stops above the Trend Stop line Uptrend Place your stops below the Tr
This never-before-seen Indicator is a histogram of the MACD lines crossing. It has never been easier to observe a trend reversal in advance. It fixes the crossing points of the MACD lines on the chart according to your parameter settings. Ideal for anticipating trends and studying the stock market. Detailing the Indicator: It accurately indicates the crossing of the MACD and Signal lines, being later confirmed by the MACD indicator as confirmation of the trend. it confirms the macd crossing wit

Fractal Levels based on Higher Timeframe is a powerful tool designed to build accurate support and resistance levels based on fractals from the higher timeframe, provides you with buy and sell signals with convenient alerts.
Working principle: The indicator analyzes fractal levels on the senior timeframe and displays them on your current chart. You can easily adjust the senior timeframe in the indicator properties to get maximum accuracy and consistency with your strategies.
Benefits of usi

Easy Fibonacci is an indicator for MT5 which allows you to plot fibonacci retracement easily Features 1. up to 10 fibo levels can be set from indicator settings
2. Each level may have different line style, line color, line width and other settings customizable 3. You can use Mouse with Extra buttons to map V and B keys and conveniently plot fibonacci
Button Actiions : B and V : Plot Top / Bottom fibonacci on visible area of chart N and M : Next and Previous Candles swing extensions R : Reset
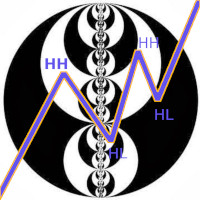
The market structure indicator on the current timeframe finds:
1. The trend (ascending and descending waves). A change in the direction of the wave occurs after the interruption of the extremum (withdrawal of liquidity from the opposite side). The trend is drawn taking into account the external bars (there can be 2 extremes on one external bar). The trend can be drawn taking into account the minimum number of bars in the wave (2 or more). It is configured by the QTY_bars_for_wave parameter
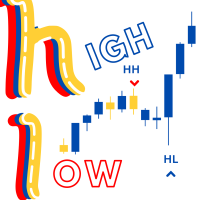
Swing High/Low Identifier
The Swing High/Low Identifier is a custom MetaTrader 5 (MT5) indicator designed to highlight significant swing points on your chart. This indicator identifies and marks swing highs and swing lows based on a configurable range of bars.
- Swing Highs are marked with red arrows above the respective candles. - Swing Lows are marked with blue arrows below the respective candles.
This tool helps traders quickly spot important price levels and patterns, whic
FREE
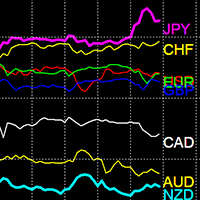
Currency Strength Indicator The Currency Strength Indicator is a powerful tool for identifying trends. It compares the strength and weakness of different currencies and makes it easy to find trending currency pairs. Sale Price: $49 Features Effectively distinguishes between strong and weak currencies Automatically identifies trending currencies Multi-timeframe Loads 28 currency pairs Performance optimized Indicator Usage Strong currencies: Currencies above 80 are considered strong. Weak currenci

Financial Indicator SolarTrade Suite: Mercury Market Indicator - Your Reliable Guide in the World of Financial Markets!
It is a moving average that uses special innovative and advanced algorithms to calculate its value and also has a design that is pleasing to the eye.
It is very simple to understand the readings of this indicator: blue color - buy, red color - sell. The brighter the color, the stronger the signal.
Check out our other SolarTrade Suite products at the bottom of the descrip

Financial Indicator SolarTrade Suite: Pluto Market Indicator - Your Reliable Guide in the World of Financial Markets!
It is a volatility oscillator that uses special innovative and advanced algorithms to calculate its value and also has a nice looking design.
It is very simple to understand the readings of this indicator: green color - low volatility and the best time to open a trade deal, orange color - high volatility and time to think about closing a trading position. The brighter the co

Financial Indicator SolarTrade Suite: Earth Market Indicator - Your Reliable Guide in the World of Financial Markets!
This is a replacement for the standard gray Japanese candlesticks, which uses special innovative and advanced algorithms to calculate its value, and also has a design that is pleasing to the eye.
It is very simple to understand the readings of this indicator: blue color - buy, red color - sell. The brighter the color, the stronger the signal.
Check out our other SolarTrade

Introducing the Gold Blitz Scalping Indicator, the ultimate tool for scalping gold on M1, M5, and M15 timeframes. Developed using advanced AI neural networks, this non-repaint indicator ensures consistent profitability and superior trading results. Tailored for precision and efficiency, Gold Blitz Scalping Indicator is optimized to provide the best results on the M15 timeframe. This Indicator Version will only work if the XAUUSD Market move between 2293 to 2473 Range. If Market Move Higher or Lo

Version 1.5: manual color change added
This indicator helps to trade price action and momentum strategies like Guerrilla Trading or similar strategies.
The indicator displays: most recent highs and lows number of consecutive breaks past breaks of most recent highs and lows retest lines flag formations manual color change User can change colors. Go to Indictor Properties/Input, set "Auto Color" to false and change the colors. Set "Auto color" back to true to go back to pre-set colors. Please
FREE

Moving pivot Average Fibonacci
The indicator compares the selected period with its counterpart from the previous period. The indicator determines the moving Fibonacci levels for the day or any time interval to assess the price movement range from the time average. The indicator helps predict the expected high or low for the day based on historical time data. The pivot line can be considered an average trend line and use it in a variety of trading strategies.
If you have any question about t
Session Bias This Strategy of bias useful for those who follow TRADESHARE on youtube. This script is designed by BokaroTraderFx for traders who want assistance in determining their session bias, particularly for those who trade within sessions typically represented by a single 4-hour candle. The method involves using price action to establish a daily bias, guiding decisions on whether to focus on buys, sells, or both. The analysis is based on the previous daily and 4-hour candle closes, fo
FREE

Contact us to receive a comprehensive user guide after purchasing. William Delbert Gann, commonly known as W.D. Gann, was an exceptional market analyst renowned for his unique trading style in the early 20th century. His trading techniques were based on a blend of mathematics, geometry, astrology, and ancient mathematics. Gann believed that stock market movements followed specific patterns and cycles, rather than being random. His methodologies, celebrated for their accuracy and relevance, con

First and foremost, the Insight Flow Indicator stands out as a Non-Repainting, Non-Redrawing, and Non-Lagging tool. This makes it a prime choice for both manual and algorithmic trading, ensuring reliable and consistent signals. User Manual: Settings, Inputs, and Strategy The Insight Flow Indicator leverages price action, strength, and momentum to provide a clear edge in the market. Equipped with advanced filters, it eliminates noise and false signals, enhancing trading potential. By using multip

Translator MeraMera Custom Indicator for MetaTrader 5
Overview:
The MeraMera indicator is a powerful tool designed for MetaTrader 5, aimed at traders who prefer a decisive, high-risk-high-reward trading strategy. Its motto, "GO Full Margin or GO Home," encapsulates its aggressive approach to trading. This custom indicator analyzes market conditions to identify potential bullish and bearish signals, helping traders make informed decisions based on historical price patterns.
Key Features:
The MetaTrader Market is a unique store of trading robots and technical indicators.
Read the MQL5.community User Memo to learn more about the unique services that we offer to traders: copying trading signals, custom applications developed by freelancers, automatic payments via the Payment System and the MQL5 Cloud Network.
You are missing trading opportunities:
- Free trading apps
- Over 8,000 signals for copying
- Economic news for exploring financial markets
Registration
Log in
If you do not have an account, please register
Allow the use of cookies to log in to the MQL5.com website.
Please enable the necessary setting in your browser, otherwise you will not be able to log in.